Стратегия индекса разворота импульса

Обзор
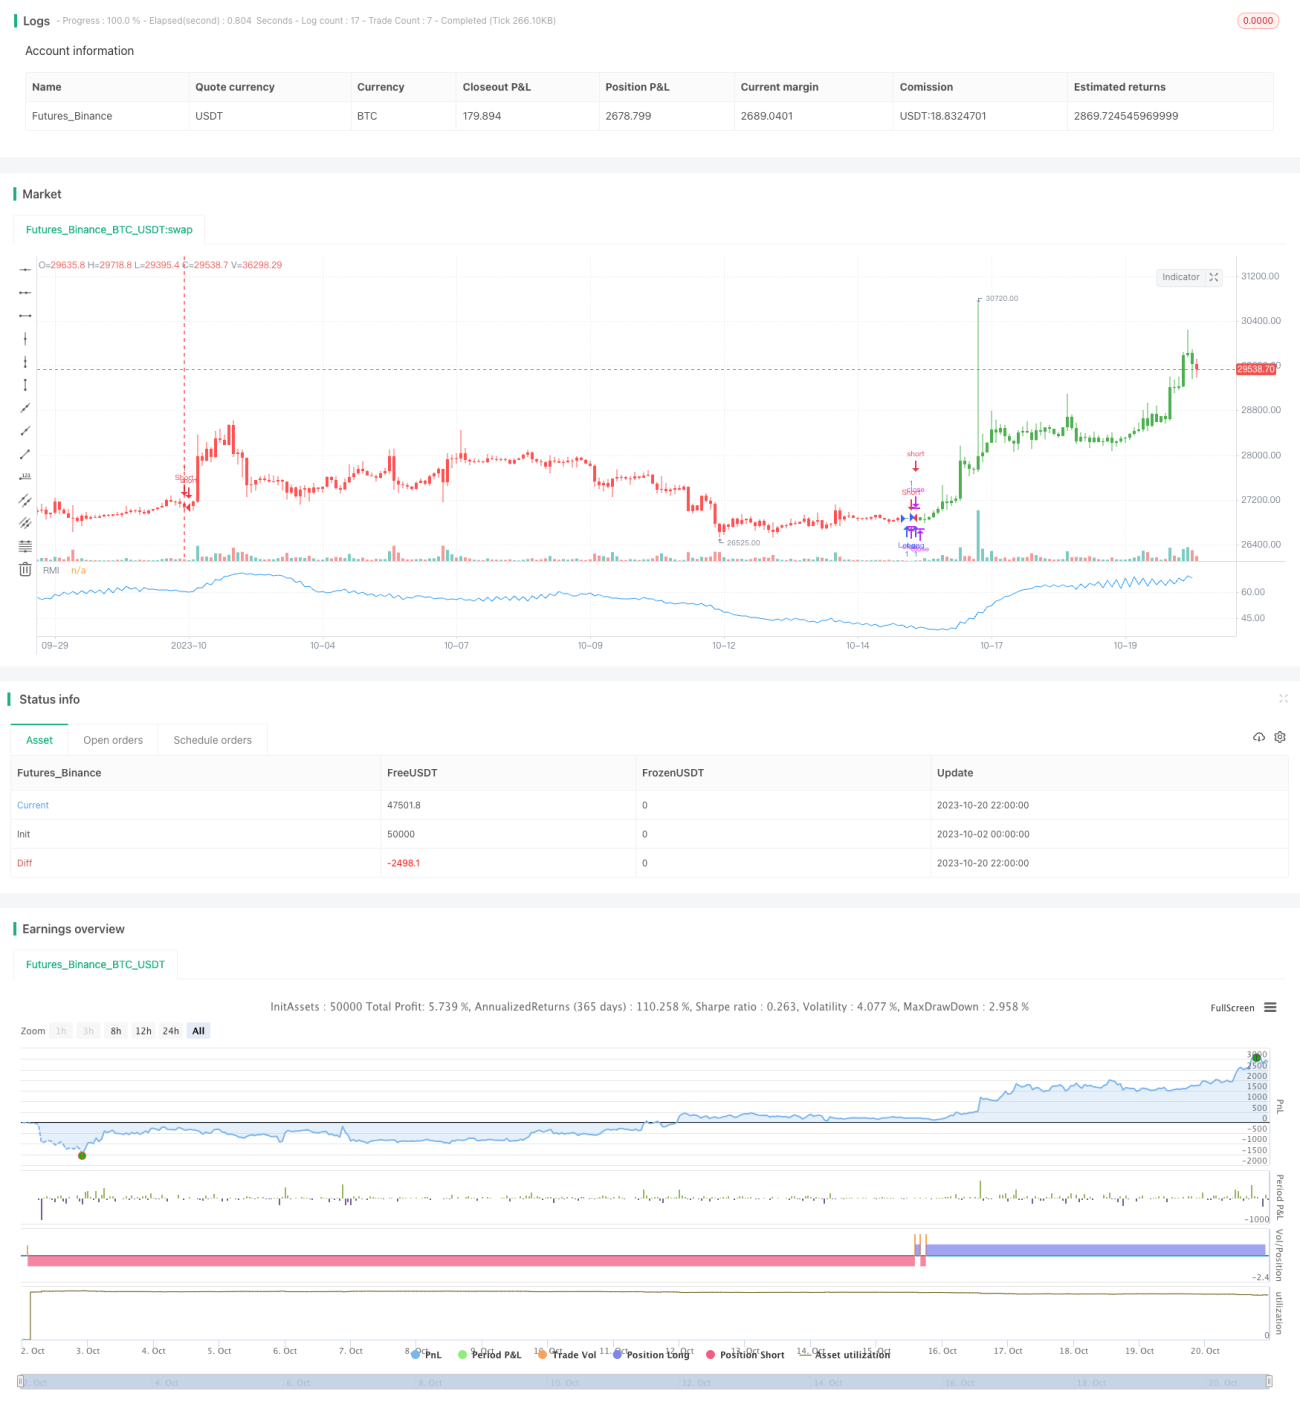
Стратегия Relative Momentum Index (RMI) - это усовершенствованная стратегия, основанная на динамическом индексе. Эта стратегия определяет, находится ли рынок в состоянии перекупа или перепродажи, чтобы поймать возможность перехода, рассчитывая динамику изменения цен за определенный период времени.
Стратегический принцип
Формула расчета стратегии RMI выглядит следующим образом:
javascript
xMom = xPrice - xPrice[Length] //计算Length周期内的价格变动
xMU = 如果xMom >= 0:之前xMU减去xMU/Length加上xMom;否则:之前xMU
xMD = 如果xMom <= 0:之前xMD减去xMD/Length加上xMom的绝对值;否则:0
RM = xMU / xMD
RMI = 100 * (RM / (1 + RM))
Сначала стратегия рассчитывает изменение цены в течение периода Length xMom. Если xMom> = 0, то цены растут, xMU добавляет xMom; если xMom < 0, то цены падают, xMD добавляет xMom.
Когда RMI выше отметки SellZone, то это означает, что вы перекупаете, и делаете ликвидный; когда RMI ниже отметки BuyZone, то это означает, что вы перепродаете, и делаете ликвидный.
Стратегические преимущества
- Индекс RMI более чувствителен, чем RSI, и может быстрее поймать шансы на обратный курс.
- RMI измеряет интенсивность падения и падения, не подвергаясь воздействию шоковых явлений.
- RMI, основанный на динамике, может более точно оценить состояние перекупа и перепродажи.
Стратегический риск
- Как и в случае с любой другой реверсивной стратегией, RMI рискует быть подвергнутой арбитражу.
- RMI параметры должны быть оптимизированы для разных сортов, иначе они могут быть неэффективными.
- Необходимо разумно установить предел перекупа, иначе будет создано слишком много ложных сигналов.
Снижение риска может быть достигнуто путем соответствующего ослабления стоп-пойнтов, оптимизации комбинации параметров и комбинации с трендовыми стратегиями.
Оптимизация стратегии
Стратегии RMI могут быть оптимизированы в следующих аспектах:
- Оптимизируйте параметр Length, выбирая длину цикла, которая максимизирует выгоду от стратегии.
- Оптимизируйте предел перекупа и перепродажи, чтобы снизить вероятность ложных сигналов.
- Увеличение механизмов сдерживания убытков и контроля за убытками.
- В сочетании с трендовым отслеживанием или равномерной стратегией повышается вероятность победы.
- Выбор подходящих торговых периодов в соответствии с характеристиками различных сортов повышает стабильность стратегии.
Подвести итог
RMI-стратегия эффективно используется для измерения изменения в ценовой динамике и проведения обратных операций. По сравнению с RSI-стратегией, RMI-стратегия более чувствительна и не подвержена воздействию шока. Однако, для достижения максимальной эффективности, стратегия все еще имеет риск быть настраиваемой, и ее параметры должны быть оптимизированы и использоваться в сочетании с трендовой стратегией.
/*backtest
start: 2023-10-02 00:00:00
end: 2023-10-21 00:00:00
period: 2h
basePeriod: 15m
exchanges: [{"eid":"Futures_Binance","currency":"BTC_USDT"}]
*/

//@version=2
////////////////////////////////////////////////////////////
//  Copyright by HPotter v1.0 19/10/2017
// The Relative Momentum Index (RMI) was developed by Roger Altman. Impressed - 1