Облачный график Ишимоку Количественная стратегия
Обзор
Это стратегия для количественного определения облачных графиков Ичимоку, которая использует индикатор Ичимоку для определения направления тренда, а также фильтрует сигналы K-линий, движущихся средних и Stochastic RSI, чтобы выбрать лучшую точку входа в тренде.
Стратегический принцип
Основные критерии оценки стратегии:
- Ичимоку пересекает линию 2 на линию 1 и показывает, что тенденция изменилась.
- K-линия проходит по линейке 1 по цене закрытия и соответствует условиям отслеживания тенденции
- K - солнечная линия, тенденция вверх
- При включении движущейся средней требуется проходить медленную линию на быстрой линии.
- Включение Stochastic RSI требует прохождения линии D на линии K.
Когда вышеперечисленные условия выполняются одновременно, стратегия открывает позицию и делает больше; когда цена падает ниже линейки лидера 1, стратегия закрывает позицию и уходит.
Эта стратегия использует основное определение направления основного тренда с помощью карты облака Ичимоку, а затем в сочетании с вспомогательными индикаторами фильтрует сигналы, чтобы выбрать лучшую точку входа, когда тренд идет вверх.
Стратегические преимущества
- Используя карту облаков Ичимоку для определения основных тенденций, отсчет показал высокую точность.
- В сочетании с различными вспомогательными показателями, фильтрация входных точек может значительно повысить доходность
- Только многостратегические, применимые к монетам, которые рассматриваются как многоголовые
- Большое пространство для оптимизации параметров, можно настроить параметры показателя для дальнейшей оптимизации
Стратегический риск
- Ичимоку: вероятность неудачи в оценке тренда может быть ошибочной
- Стоп-стоп может быть преодолен в случае срыва, что приведет к увеличению убытков.
- Монеты, которые не подходят для скрытых признаков перемены, разработанные для многообещающего поведения
- Неправильная параметровая настройка может привести к чрезмерному активному вхождению в поле или чрезмерной консервативности
Ответ:
- Повышение точности суждений в сочетании с тенденциями по большему количеству показателей
- Установка разумных стоп-пойнтов, строгий контроль за единичными потерями
- Выбор стратегий в зависимости от ситуации в разных валютах
- Тщательное тестирование и оптимизация параметров, чтобы сделать стратегию более стабильной
Направление оптимизации стратегии
- Оптимизация параметров параметров вспомогательных показателей для дальнейшего повышения стабильности стратегии
- Добавление механизмов по удержанию убытков, таких как отслеживание убытков, удержание убытков по скользящим средним показателям
- Добавление управления позициями, например, фиксированные позиции, средние позиции и т. д.
- Оптимизация настройки параметров для конкретных валют
Подвести итог
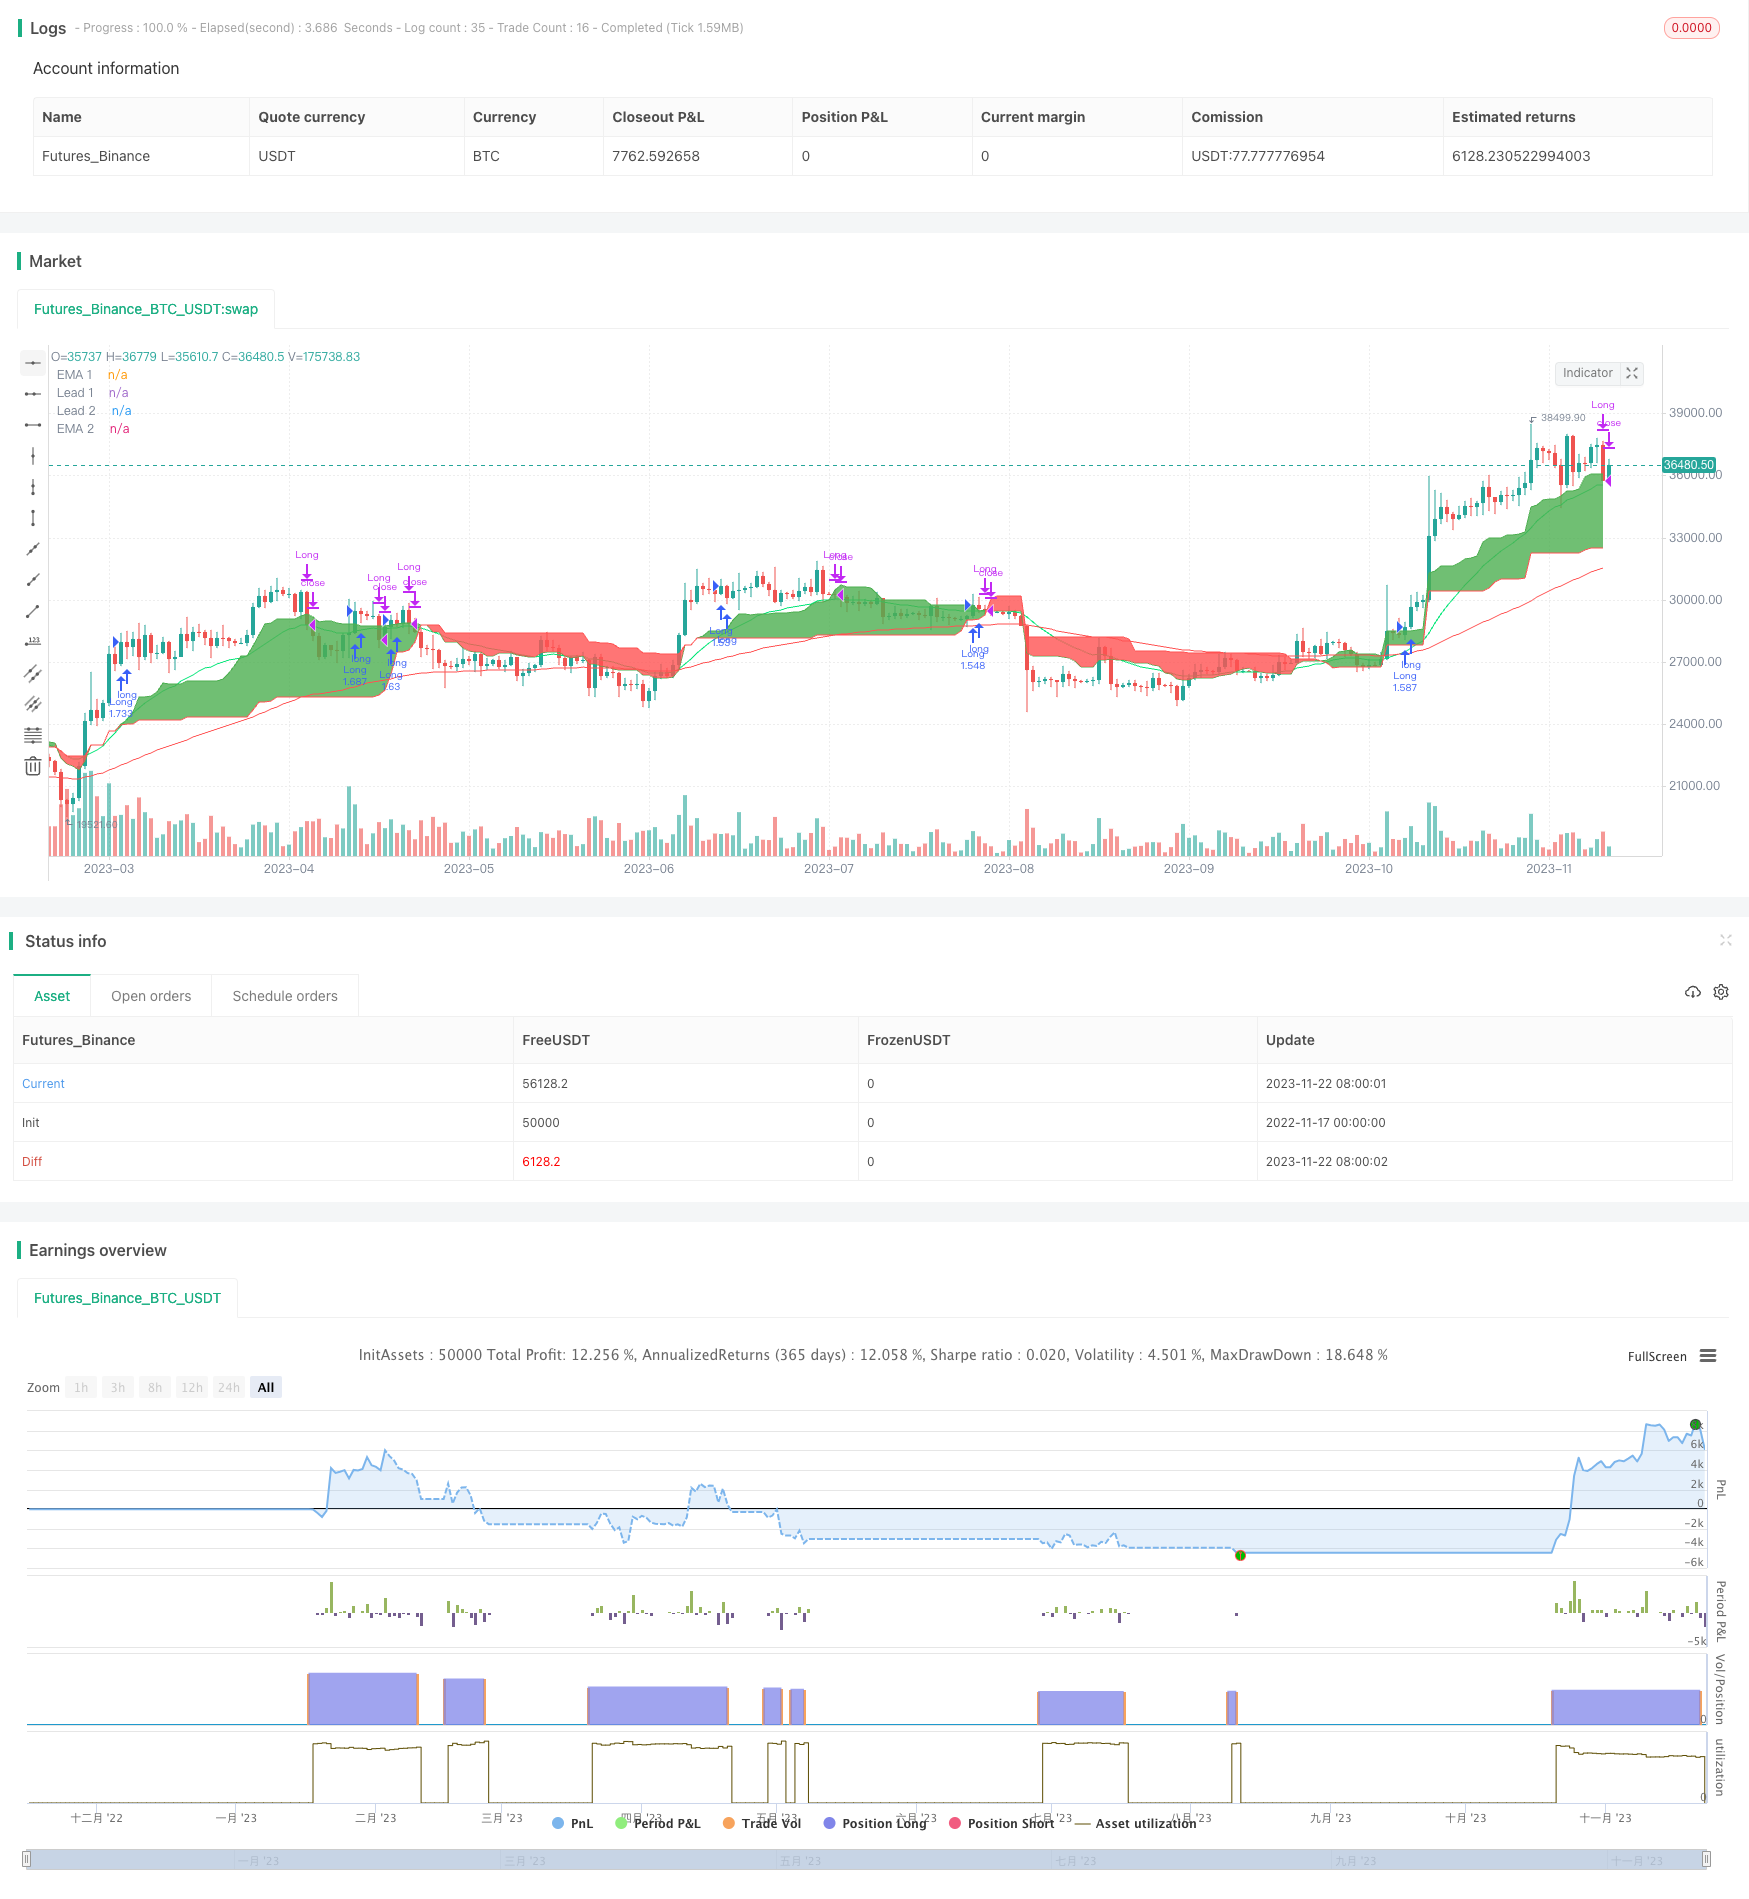
Стратегия Ichimoku Cloud Chart Quantitative Strategy используется для определения направления тренда, достижения высокой выигрышности и контролируемого риска. Преимущества стратегии очевидны, эффективность выделяется в многосторонних ситуациях. Следующий шаг может быть улучшен с точки зрения оптимизации показателей, механизма остановки убытков, управления позициями и т. Д., Чтобы сделать стратегию более совершенной и стабильной.
/*backtest
start: 2022-11-17 00:00:00
end: 2023-11-23 00:00:00
period: 1d
basePeriod: 1h
exchanges: [{"eid":"Futures_Binance","currency":"BTC_USDT"}]
*/

//@version=4

strategy(title="Ichimoku only Long Strategy", shorttitle="Ichimoku only Long", overlay = true, pyramiding = 0, calc_on_order_fills = false, commission_type =  strategy.commission.percent, commission_value = 0, default_qty_type = strategy.percent_of_equity, default_qty_value = 100, initial_capital=10000, currency=currency.USD)

// Time Range
FromMonth=input(defval=1,title="FromMonth",minval=1,maxval=12)
FromDay=input(defval=1,title="FromDay",minval=1,maxval=31)
FromYear=input(defval=2017,title="FromYear",minval=2017)
ToMonth=input(defval=1,title="ToMonth",minval=1,maxval=12)
ToDay=input(defval=1,title="ToDay",minval=1,maxval=31)
ToYear=input(defval=9999,title="ToYear",minval=2017)
start=timestamp(FromYear,FromMonth,FromDay,00,00)
finish=timestamp(ToYear,ToMonth,ToDay,23,59)
window()=>true
// See if this bar's time happened on/after start date
afterStartDate = time >= start and time<=finish?true:false

//Enable RSI
enableema = input(true, title="Enable EMA?")
enablestochrsi = input(false, title="Enable Stochastik RSI?")

//EMA
emasrc = close,
len1 = input(24, minval=1, title="EMA 1")
len2 = input(90, minval=1, title="EMA 2")

ema1 = ema(emasrc, len1)
ema2 = ema(emasrc, len2)

col1 = color.lime
col2 = color.red

//EMA Plots
plot(ema1, title="EMA 1", linewidth=1, color=col1)
plot(ema2, title="EMA 2", linewidth=1, color=col2)

//STOCH RSI
smoothK = input(3, minval=1, title="RSI K Line")
smoothD = input(3, minval=1, title="RSI D Line")
lengthRSI = input(14, minval=1, title="RSI Length")
lengthStoch = input(14, minval=1, title="Stochastik Length")
src = input(close, title="RSI Source")

rsi1 = rsi(src, lengthRSI)
k = sma(stoch(rsi1, rsi1, rsi1, lengthStoch), smoothK)
d = sma(k, smoothD)

//Ichimoku
conversionPeriods = input(9, minval=1, title="Ichi Conversion Line Length")
basePeriods = input(26, minval=1, title="Ichi Base Line Length")
laggingSpan2Periods = input(52, minval=1, title="Ichi Lagging Span 2 Length")
displacement = input(1, minval=0, title="Ichi Displacement")
donchian(len) => avg(lowest(len), highest(len))
conversionLine = donchian(conversionPeriods)
baseLine = donchian(basePeriods)
leadLine1 = avg(conversionLine, baseLine)
leadLine2 = donchian(laggingSpan2Periods)
p1 = plot(leadLine1, offset = displacement - 1, color=color.green,
	 title="Lead 1")
p2 = plot(leadLine2, offset = displacement - 1, color=color.red,
	 title="Lead 2")
fill(p1, p2, color = leadLine1 > leadLine2 ? color.green : color.red)


//Long Condition
crossup = k[0] > d[0] and k[1] <= d[1]
ichigreenabovered = leadLine1 > leadLine2
ichimokulong = close > leadLine1
greencandle =  close > open
redcandle = close < open
emacond = ema1 > ema2
longcondition = ichigreenabovered and ichimokulong and greencandle

//Exit Condition
ichimokuexit = close < leadLine1

exitcondition = ichimokuexit and redcandle

//Entrys

if (enablestochrsi == false) and (enableema == false) and (longcondition) and (afterStartDate) and (strategy.opentrades < 1)
    strategy.entry("Long", strategy.long)

if (enablestochrsi == true) and (enableema == false) and (longcondition) and (crossup) and (afterStartDate) and (strategy.opentrades < 1)
    strategy.entry("Long", strategy.long)

if (enableema == true) and (enablestochrsi == false) and (longcondition) and (emacond) and (afterStartDate) and (strategy.opentrades < 1)
    strategy.entry("Long", strategy.long)

if (enableema == true) and (enablestochrsi == true) and (longcondition) and (emacond) and (crossup) and (afterStartDate) and (strategy.opentrades < 1)
    strategy.entry("Long", strategy.long)


//Exits
if (afterStartDate)
    strategy.close(id = "Long", when = exitcondition)