
Эта стратегия объединяет в себе четыре технических показателя: временная последовательность, средневзвешенная стоимость сделки, брин-полоса и дельта (OBV-PVT) для многомерного определения ценовых тенденций, перекупа и перепродажи.
Можно оптимизировать стратегию путем корректировки среднелинейных циклов, ширины буринских полос и рисково-убыточного соотношения, снижая частоту торговли и одновременно увеличивая убыточный коэффициент по одной сделке.
Эта стратегия использует различные аналитические инструменты, такие как разбивка временной последовательности, индикатор Бринбинтовых полос, индикатор OBV, чтобы эффективно улавливать основные тенденции рынка путем идентификации краткосрочных последствий, путем органического сочетания количественных отношений, статистических характеристик и определения тенденций. В то же время существует определенный риск, который требует корректировки параметров для достижения оптимального состояния.
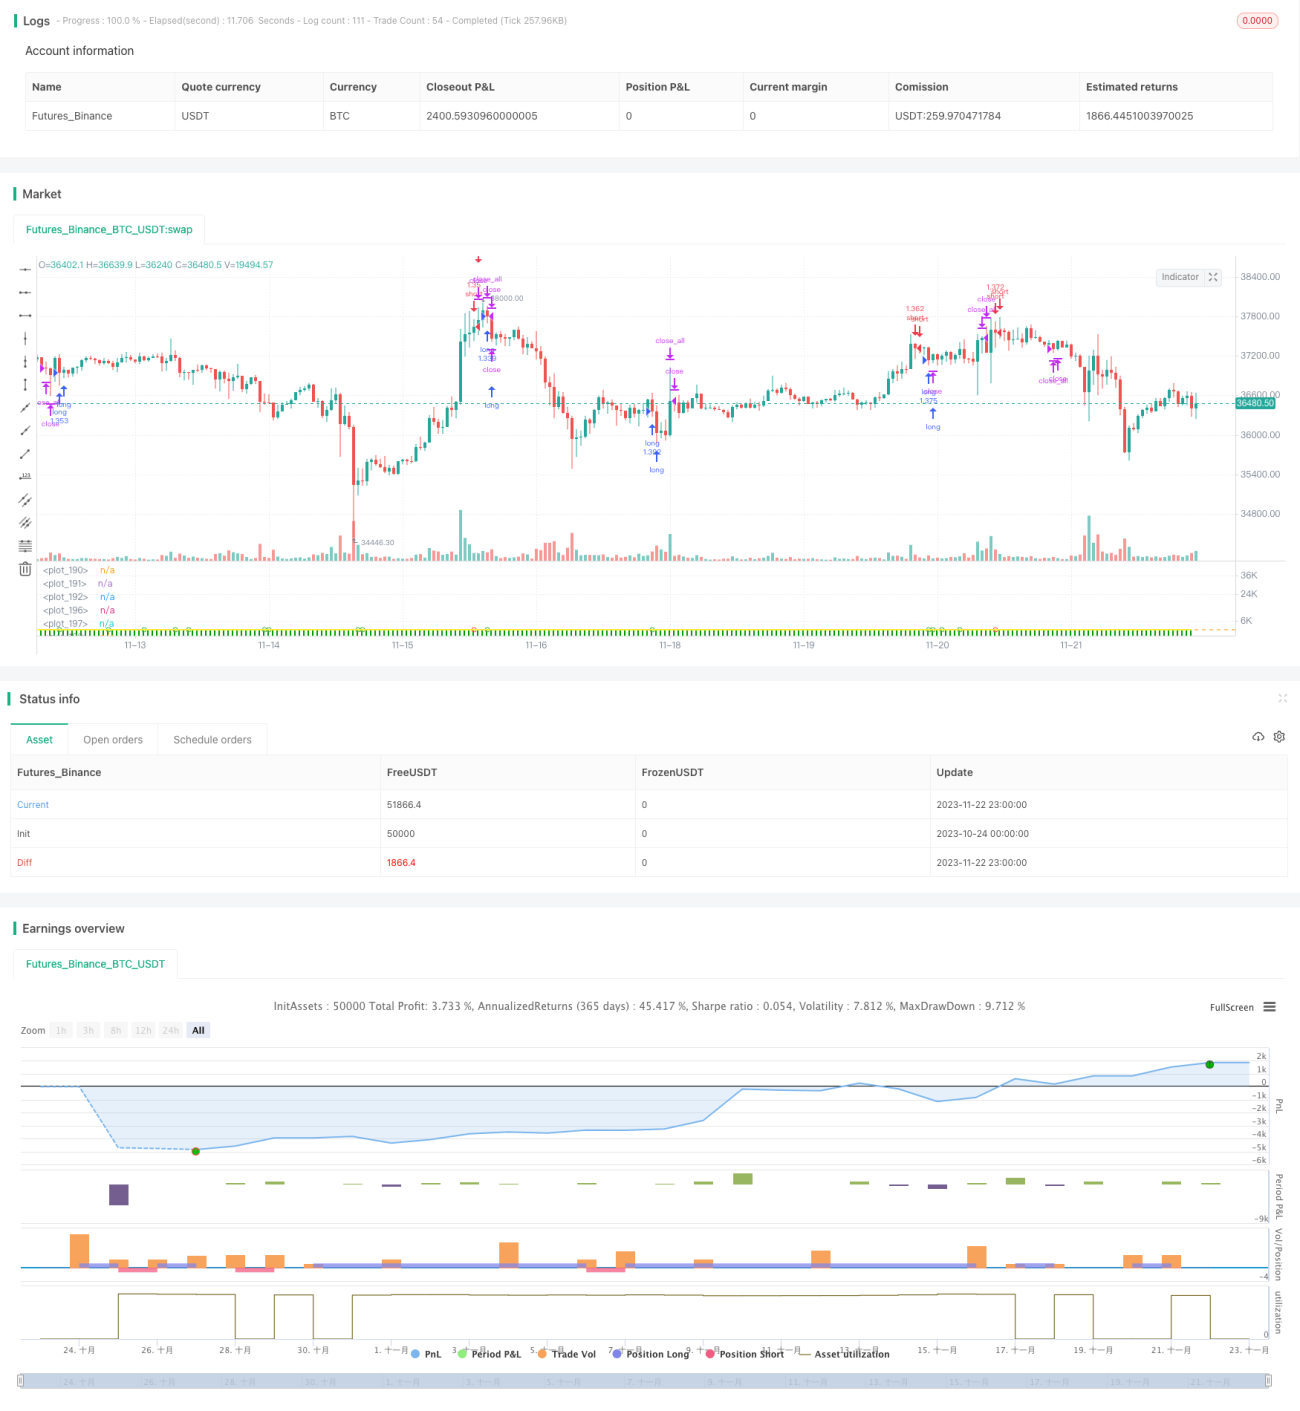
/*backtest
start: 2023-10-24 00:00:00
end: 2023-11-23 00:00:00
period: 1h
basePeriod: 15m
exchanges: [{"eid":"Futures_Binance","currency":"BTC_USDT"}]
*/
// This source code is subject to the terms of the Mozilla Public License 2.0 at https://mozilla.org/MPL/2.0/
//// This source code is subject to the terms of the Mozilla Public License 2.0 at https://mozilla.org/MPL/2.0/
// © oakwhiz and tathal
//@version=4
strategy("BBPBΔ(OBV-PVT)BB", default_qty_type=strategy.percent_of_equity, default_qty_value=100)
startDate = input(title="Start Date", type=input.integer,
defval=1, minval=1, maxval=31)
startMonth = input(title="Start Month", type=input.integer,
defval=1, minval=1, maxval=12)
startYear = input(title="Start Year", type=input.integer,
defval=2010, minval=1800, maxval=2100)
endDate = input(title="End Date", type=input.integer,
defval=31, minval=1, maxval=31)
endMonth = input(title="End Month", type=input.integer,
defval=12, minval=1, maxval=12)
endYear = input(title="End Year", type=input.integer,
defval=2021, minval=1800, maxval=2100)
// Normalize Function
normalize(_src, _min, _max) =>
// Normalizes series with unknown min/max using historical min/max.
// _src : series to rescale.
// _min, _min: min/max values of rescaled series.
var _historicMin = 10e10
var _historicMax = -10e10
_historicMin := min(nz(_src, _historicMin), _historicMin)
_historicMax := max(nz(_src, _historicMax), _historicMax)
_min + (_max - _min) * (_src - _historicMin) / max(_historicMax - _historicMin, 10e-10)
// STEP 2:
// Look if the close time of the current bar
// falls inside the date range
inDateRange = true
// Stop loss & Take Profit Section
sl_inp = input(2.0, title='Stop Loss %')/100
tp_inp = input(4.0, title='Take Profit %')/100
stop_level = strategy.position_avg_price * (1 - sl_inp)
take_level = strategy.position_avg_price * (1 + tp_inp)
icreturn = false
innercandle = if (high < high[1]) and (low > low[1])
icreturn := true
src = close
float change_src = change(src)
float i_obv = cum(change_src > 0 ? volume : change_src < 0 ? -volume : 0*volume)
float i_pvt = pvt
float result = change(i_obv - i_pvt)
float nresult = ema(normalize(result, -1, 1), 20)
length = input(20, minval=1)
mult = input(2.0, minval=0.001, maxval=50, title="StdDev")
basis = ema(nresult, length)
dev = mult * stdev(nresult, length)
upper = basis + dev
lower = basis - dev
bbr = (nresult - lower)/(upper - lower)
////////////////INPUTS///////////////////
lambda = input(defval = 1000, type = input.float, title = "Smoothing Factor (Lambda)", minval = 1)
leng = input(defval = 100, type = input.integer, title = "Filter Length", minval = 1)
srcc = close
///////////Construct Arrays///////////////
a = array.new_float(leng, 0.0)
b = array.new_float(leng, 0.0)
c = array.new_float(leng, 0.0)
d = array.new_float(leng, 0.0)
e = array.new_float(leng, 0.0)
f = array.new_float(leng, 0.0)
/////////Initialize the Values///////////
//for more details visit:
// https://asmquantmacro.com/2015/06/25/hodrick-prescott-filter-in-excel/
ll1 = leng-1
ll2 = leng-2
for i = 0 to ll1
array.set(a,i, lambda*(-4))
array.set(b,i, src[i])
array.set(c,i, lambda*(-4))
array.set(d,i, lambda*6 + 1)
array.set(e,i, lambda)
array.set(f,i, lambda)
array.set(d, 0, lambda + 1.0)
array.set(d, ll1, lambda + 1.0)
array.set(d, 1, lambda * 5.0 + 1.0)
array.set(d, ll2, lambda * 5.0 + 1.0)
array.set(c, 0 , lambda * (-2.0))
array.set(c, ll2, lambda * (-2.0))
array.set(a, 0 , lambda * (-2.0))
array.set(a, ll2, lambda * (-2.0))
//////////////Solve the optimization issue/////////////////////
float r = array.get(a, 0)
float s = array.get(a, 1)
float t = array.get(e, 0)
float xmult = 0.0
for i = 1 to ll2
xmult := r / array.get(d, i-1)
array.set(d, i, array.get(d, i) - xmult * array.get(c, i-1))
array.set(c, i, array.get(c, i) - xmult * array.get(f, i-1))
array.set(b, i, array.get(b, i) - xmult * array.get(b, i-1))
xmult := t / array.get(d, i-1)
r := s - xmult*array.get(c, i-1)
array.set(d, i+1, array.get(d, i+1) - xmult * array.get(f, i-1))
array.set(b, i+1, array.get(b, i+1) - xmult * array.get(b, i-1))
s := array.get(a, i+1)
t := array.get(e, i)
xmult := r / array.get(d, ll2)
array.set(d, ll1, array.get(d, ll1) - xmult * array.get(c, ll2))
x = array.new_float(leng, 0)
array.set(x, ll1, (array.get(b, ll1) - xmult * array.get(b, ll2)) / array.get(d, ll1))
array.set(x, ll2, (array.get(b, ll2) - array.get(c, ll2) * array.get(x, ll1)) / array.get(d, ll2))
for j = 0 to leng-3
i = leng-3 - j
array.set(x, i, (array.get(b,i) - array.get(f,i)*array.get(x,i+2) - array.get(c,i)*array.get(x,i+1)) / array.get(d, i))
//////////////Construct the output///////////////////
o5 = array.get(x,0)
////////////////////Plottingd///////////////////////
TimeFrame = input('1', type=input.resolution)
start = security(syminfo.tickerid, TimeFrame, time)
//------------------------------------------------
newSession = iff(change(start), 1, 0)
//------------------------------------------------
vwapsum = 0.0
vwapsum := iff(newSession, o5*volume, vwapsum[1]+o5*volume)
volumesum = 0.0
volumesum := iff(newSession, volume, volumesum[1]+volume)
v2sum = 0.0
v2sum := iff(newSession, volume*o5*o5, v2sum[1]+volume*o5*o5)
myvwap = vwapsum/volumesum
dev2 = sqrt(max(v2sum/volumesum - myvwap*myvwap, 0))
Coloring=close>myvwap?color.green:color.red
av=myvwap
showBcol = input(false, type=input.bool, title="Show barcolors")
showPrevVWAP = input(false, type=input.bool, title="Show previous VWAP close")
prevwap = 0.0
prevwap := iff(newSession, myvwap[1], prevwap[1])
nprevwap= normalize(prevwap, 0, 1)
l1= input(20, minval=1)
src2 = close
mult1 = input(2.0, minval=0.001, maxval=50, title="StdDev")
basis1 = sma(src2, l1)
dev1 = mult1 * stdev(src2, l1)
upper1 = basis1 + dev1
lower1 = basis1 - dev1
bbr1 = (src - lower1)/(upper1 - lower1)
az = plot(bbr, "Δ(OBV-PVT)", color.rgb(0,153,0,0), style=plot.style_columns)
bz = plot(bbr1, "BB%B", color.rgb(0,125,125,50), style=plot.style_columns)
fill(az, bz, color=color.white)
deltabbr = bbr1 - bbr
oneline = hline(1)
twoline = hline(1.2)
zline = hline(0)
xx = input(.3)
yy = input(.7)
zz = input(-1)
xxx = hline(xx)
yyy = hline(yy)
zzz = hline(zz)
fill(oneline, twoline, color=color.red, title="Sell Zone")
fill(yyy, oneline, color=color.orange, title="Slightly Overbought")
fill(yyy, zline, color=color.white, title="DO NOTHING ZONE")
fill(zzz, zline, color=color.green, title="GO LONG ZONE")
l20 = crossover(deltabbr, 0)
l30 = crossunder(deltabbr, 0)
l40 = crossover(o5, 0)
l50 = crossunder(o5, 0)
z1 = bbr1 >= 1
z2 = bbr1 < 1 and bbr1 >= .7
z3 = bbr1 < .7 and bbr1 >= .3
z4 = bbr1 < .3 and bbr1 >= 0
z5 = bbr1 < 0
a1 = bbr >= 1
a2 = bbr < 1 and bbr >= .7
a4 = bbr < .3 and bbr >= 0
a5 = bbr < 0
b4 = deltabbr < .3 and deltabbr >= 0
b5 = deltabbr < 0
c4 = o5 < .3 and o5 >= 0
c5 = o5 < 0
b1 = deltabbr >= 1
b2 = deltabbr < 1 and o5 >= .7
c1 = o5 >= 1
c2 = o5 < 1 and o5 >= .7
///
n = input(16,"Period")
H = highest(hl2,n)
L = lowest(hl2,n)
hi = H[1]
lo = L[1]
up = high>hi
dn = low<lo
lowerbbh = lowest(10)[1]
bbh = (low == open ? open < lowerbbh ? open < close ? close > ((high[1] - low[1]) / 2) + low[1] :na : na : na)
plot(normalize(av,-1,1), linewidth=2, title="Trendline", color=color.yellow)
long5 = close < av and av[0] > av[1]
sell5 = close > av
cancel = false
if open >= high[1]
cancel = true
long = (long5 or z5 or a5) and (icreturn or bbh or up)
sell = ((z1 or a1) or (l40 and l20)) and (icreturn or dn) and (c1 or b1)
short = ((z1 or z2 or a1 or sell5) and (l40 or l20)) and icreturn
buy= (z5 or z4 or a5 or long5) and (icreturn or dn)
plotshape(long and not sell ? -0.5 : na, title="Long", location=location.absolute, style=shape.circle, size=size.tiny, color=color.green, transp=0)
plotshape(short and not sell? 1 : na, title="Short", location=location.absolute, style=shape.circle, size=size.tiny, color=color.red, transp=0)
if (inDateRange)
strategy.entry("long", true, when = long )
if (inDateRange) and (strategy.position_size > 0)
strategy.close_all(when = sell or cancel)
if (inDateRange)
strategy.entry("short", false, when = short )
if (inDateRange) and (strategy.position_size < 0)
strategy.close_all(when = buy)