Стратегия Supertrend на основе ATR и трейлинг-стопа


Дата создания: 2023-11-28 14:56:59 Последнее изменение: 2023-11-28 14:56:59
Копировать: 0 Количество просмотров: 939
1
Подписаться
1617
Подписчики

Стратегия Supertrend на основе ATR и трейлинг-стопа

Обзор

Эта стратегия, основанная на показателях средней реальной колебательной величины (ATR), проектирует движущуюся стоп-линию и обратную линию. Она отслеживает изменение цены для отслеживания стоп-лосса. В частности, если цена изменяется более чем на 1%, то стоп-лосса перемещается в сторону прибыли в фиксированной пропорции.

Стратегический принцип

Стратегия использует показатель ATR для расчета стоп-линии. Конкретная формула следующая:

atr = multplierFactor * atr(barsBack)

longStop = hl2 - atr 
shortStop = hl2 + atr

При этом multiplierFactor - это коэффициент увеличения ATR, barsBack - количество циклов ATR. Чем больше ATR, тем больше рыночные колебания.

На основе ATR-значений рассчитывается линия длинного стопа и линия короткого стопа. Когда цена превышает эти две линии, посылается торговый сигнал.

Кроме того, в стратегии вводится переменная direction, которая определяет направление тренда:

direction = 1
direction := nz(direction[1], direction) 
direction := direction == -1 and close > shortStopPrev ? 1 : direction == 1 and close < longStopPrev ? -1 : direction

Если направление -1, то оно находится в плюсовом тренде, а если направление -1, то в холостом тренде.

В зависимости от значения переменной направления, будет нарисована линия стоп-потери разного цвета:

if (direction == 1)
    valueToPlot := longStop
    colorToPlot := color.green 
else
    valueToPlot := shortStop
    colorToPlot := color.red

Таким образом, можно четко видеть направление текущего тренда и местонахождение стоп-линии.

Механизм отслеживания потерь

Ключевым моментом этой стратегии является введение механизма отслеживания стоп-порогов, который позволяет корректировать стоп-линии в режиме реального времени в зависимости от того, как работают цены.

Логика выглядит следующим образом:

strategyPercentege = (close - updatedEntryPrice) / updatedEntryPrice * 100.00
rideUpStopLoss = hasOpenTrade() and strategyPercentege > 1

if (rideUpStopLoss) 
    stopLossPercent := stopLossPercent + strategyPercentege - 1.0
    newStopLossPrice = updatedEntryPrice + (updatedEntryPrice * stopLossPercent) / 100
    stopLossPrice := max(stopLossPrice, newStopLossPrice)
    updatedEntryPrice := stopLossPrice

Если цена выросла более чем на 1% относительно цены входа, то следует отслеживать вверх и корректировать линию стоп-лосса.

Это позволяет зафиксировать больше прибыли, а также уменьшить убытки.

Анализ преимуществ

Основным преимуществом этой стратегии по сравнению с традиционными мобильными стоп-стратегиями является то, что она позволяет динамично корректировать линию стоп-убытков в зависимости от рыночных условий. Конкретные преимущества таковы:

  1. Высокая прибыль может быть зафиксирована в трендовых ситуациях

Механизм отслеживания стоп-лосса позволяет стоп-линии постоянно перемещаться в сторону прибыли, что позволяет закрепить более высокую прибыль, если рынок будет продолжать расти.

  1. Стойкость, которая может снизить убытки при ликвидации

Фиксированная движущаяся линия остановки легко может быть пропущена при изменении рыночных тенденций. Стоп-линия этой стратегии основана на рыночных волатильностях и позволяет разумно отслеживать изменения цен и избегать пропусков при ликвидации.

  1. Простые в использовании и легко автоматизируемые

Стратегия полностью основана на индикаторных операциях без сложной логики определения тенденций. Автоматизация торгов может быть реализована очень просто.

  1. Настраиваемые параметры для разных сортов

Параметры, такие как ATR-цикл, увеличивающий коэффициент и стоп-магнитность, могут быть настроены и оптимизированы для различных видов параметров, что делает стратегию более универсальной.

Анализ рисков

Несмотря на все преимущества, следует учитывать следующие риски:

  1. Невозможно определить переломный момент, существует риск “последствия”

Эта стратегия не определяет логику окончания тренда. В конце бычьего рынка очень легко обнаруживается преследование высоких и низких значений.

  1. Неправильные параметры могут увеличить потери

Если параметр ATR-цикла будет слишком коротким, то стоп-линия будет слишком чувствительной и может быть вызвана частыми шокирующими явлениями.

  1. Риск, что отклик текста может быть поврежден

Эта стратегия не учитывает точку дифференциации как точку стоп-помощи. Таким образом, она может быть выброшена из рынка при коротком отскоке.

В связи с вышеупомянутыми рисками можно оптимизировать следующие аспекты:

  1. Показатели трендовых колебаний и обратный тренд заранее определены

  2. Тест на оптимизацию параметров, выбор оптимального параметра

  3. Расширенный предел убытков вблизи определенной поддержки

Направление оптимизации

В этой стратегии есть место для дальнейшей оптимизации:

  1. Определение формы в сочетании с K-линией

Можно определить вероятность обратного тренда, идентифицировав некоторые типичные формы K-линии, такие как спинки, стреляющие звезды и т. д. Это позволяет избежать риска преследования высоких и низких значений.

  1. Оптимизация параметров динамического отслеживания

Можно также динамично изменять параметры, такие как цикл ATR, увеличивающий коэффициент, использовать более длительный цикл ATR и более широкий диапазон потери в значительном количестве волатильных рынков.

  1. Модели машинного обучения

Прогнозирование возможных ценовых диапазонов на рынке с помощью моделей глубокого обучения, таких как lstm, rnn и т. Д., Динамическая коррекция стоп-дистанции.

Подвести итог

Эта стратегия использует ATR для разработки мобильных стоп-линий и внедряет механизм отслеживания стоп-убытков, который может в режиме реального времени корректировать стоп-позиции в зависимости от изменений в рыночной ситуации. Это позволяет более высокой прибыли, а также снижает риск. С дальнейшей оптимизацией эта стратегия может быть более адаптирована к различным ситуациям на рынке и стать универсальной торговой стратегией.
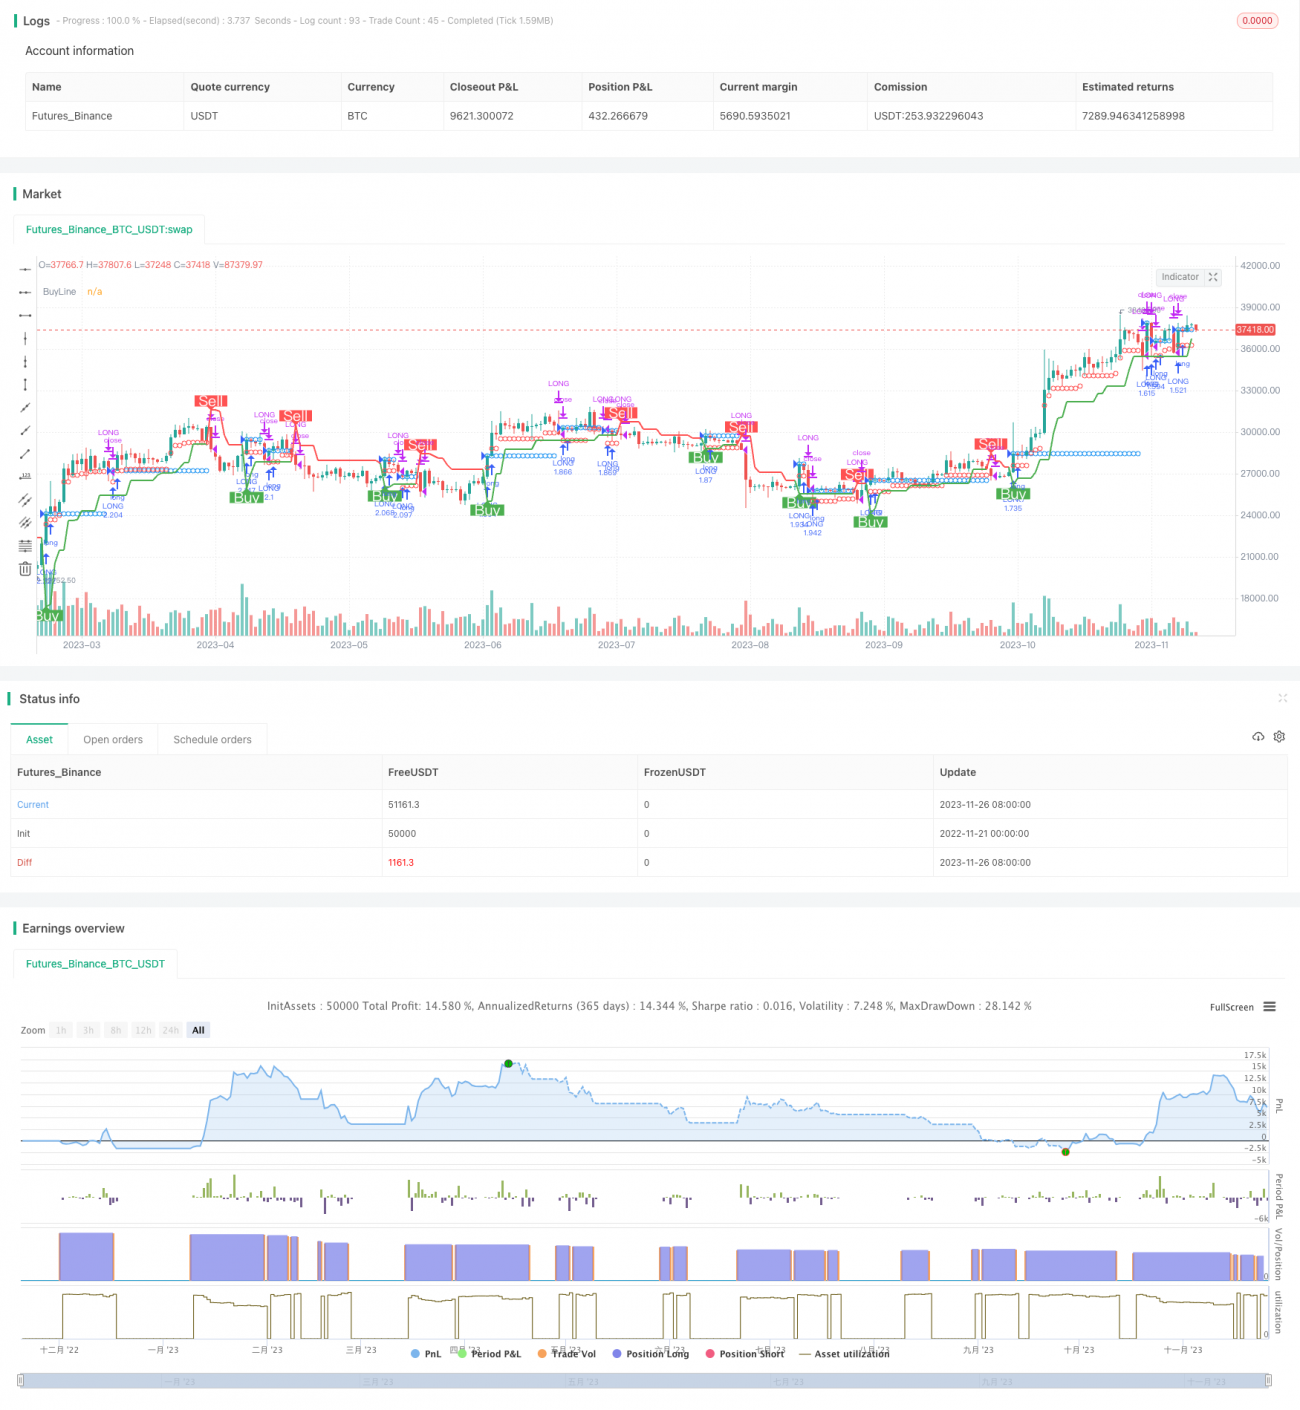
Исходный код стратегии
/*backtest
start: 2022-11-21 00:00:00
end: 2023-11-27 00:00:00
period: 1d
basePeriod: 1h
exchanges: [{"eid":"Futures_Binance","currency":"BTC_USDT"}]
*/

//@version=4
//
// ▒▒▒▒▒▒▒▒▒▒▒▒▒▒▒▒▒▒▒▒▒▒▒▒▒▒▒▒▒▒▒▒▒▒▒▒▒▒▒▒▒▒▒▒▒▒▒▒▒▒▒▒▒▒▒▒▒▒▒▒▒▒▒▒▒▒▒▒▒▒▒▒▒▒▒▒▒▒▒▒▒▒▒▒▒▒▒▒▒▒▒▒▒▒▒▒▒▒▒▒▒▒▒▒▒▒▒▒▒▒▒▒▒▒ 
//  -----------------------------------------------------------------------------
//  Copyright 2019 Mauricio Pimenta | exit490
//  SuperTrend with Trailing Stop Loss script may be freely distributed under the MIT license.
//
//  Permission is hereby granted, free of charge, 
//  to any person obtaining a copy of this software and associated documentation files (the "Software"), 
//  to deal in the Software without restriction, including without limitation the rights to use, copy, modify, merge, 
//  publish, distribute, sublicense, and/or sell copies of the Software, and to permit persons to whom the Software is furnished to do so, 
//  subject to the following conditions:
//
//  The above copyright notice and this permission notice shall be included in all copies or substantial portions of the Software.
//
//  THE SOFTWARE IS PROVIDED "AS IS", WITHOUT WARRANTY OF ANY KIND, 
//  EXPRESS OR IMPLIED, INCLUDING BUT NOT LIMITED TO THE WARRANTIES OF MERCHANTABILITY, 
//  FITNESS FOR A PARTICULAR PURPOSE AND NONINFRINGEMENT. IN NO EVENT SHALL THE AUTHORS OR COPYRIGHT HOLDERS BE LIABLE FOR ANY CLAIM, 
//  DAMAGES OR OTHER LIABILITY, WHETHER IN AN ACTION OF CONTRACT, TORT OR OTHERWISE, ARISING FROM, 
//  OUT OF OR IN CONNECTION WITH THE SOFTWARE OR THE USE OR OTHER DEALINGS IN THE SOFTWARE.
//
//  -----------------------------------------------------------------------------
//
//  Authors:  @exit490
//  Revision: v1.0.0
//  Date:     5-Aug-2019
//
//  Description
//  ===========
//  SuperTrend is a moving stop and reversal line based on the volatility (ATR).
//  The strategy will ride up your stop loss when price moviment 1%.
//  The strategy will close your operation when the market price crossed the stop loss.
//  The strategy will close operation when the line based on the volatility will crossed
//
//  The strategy has the following parameters:
//
//  INITIAL STOP LOSS - Where can isert the value to first stop.
//  POSITION TYPE - Where can to select trade position.
//  ATR PERIOD - To select number of bars back to execute calculation
//  ATR MULTPLIER - To add a multplier factor on volatility
//  BACKTEST PERIOD - To select range.
//  
//  -----------------------------------------------------------------------------
//  Disclaimer:
//    1. I am not licensed financial advisors or broker dealers. I do not tell you 
//       when or what to buy or sell. I developed this software which enables you 
//       execute manual or automated trades multplierFactoriplierFactoriple trades using TradingView. The 
//       software allows you to set the criteria you want for entering and exiting 
//       trades.
//    2. Do not trade with money you cannot afford to lose.
//    3. I do not guarantee consistent profits or that anyone can make money with no 
//       effort. And I am not selling the holy grail.
//    4. Every system can have winning and losing streaks.
//    5. Money management plays a large role in the results of your trading. For 
//       example: lot size, account size, broker leverage, and broker margin call 
//       rules all have an effect on results. Also, your Take Profit and Stop Loss 
//       settings for individual pair trades and for overall account equity have a 
//       major impact on results. If you are new to trading and do not understand 
//       these items, then I recommend you seek education materials to further your
//       knowledge.
//
//    YOU NEED TO FIND AND USE THE TRADING SYSTEM THAT WORKS BEST FOR YOU AND YOUR 
//    TRADING TOLERANCE.
//
//    I HAVE PROVIDED NOTHING MORE THAN A TOOL WITH OPTIONS FOR YOU TO TRADE WITH THIS PROGRAM ON TRADINGVIEW.
//    
//    I accept suggestions to improve the script.
//    If you encounter any problems I will be happy to share with me.
//  -----------------------------------------------------------------------------
//
// ▒▒▒▒▒▒▒▒▒▒▒▒▒▒▒▒▒▒▒▒▒▒▒▒▒▒▒▒▒▒▒▒▒▒▒▒▒▒▒▒▒▒▒▒▒▒▒▒▒▒▒▒▒▒▒▒▒▒▒▒▒▒▒▒▒▒▒▒▒▒▒▒▒▒▒▒▒▒▒▒▒▒▒▒▒▒▒▒▒▒▒▒▒▒▒▒▒▒▒▒▒▒▒▒▒▒▒▒▒▒▒▒▒▒ //

strategy(title = "SUPERTREND ATR WITH TRAILING STOP LOSS",
         shorttitle = "SUPERTREND ATR WITH TSL",
         overlay = true,
         precision = 8,
         calc_on_order_fills = true,
         calc_on_every_tick = true,
         backtest_fill_limits_assumption = 0,
         default_qty_type = strategy.percent_of_equity,
         default_qty_value = 100,
         initial_capital = 1000,
         currency = currency.USD,
         linktoseries = true)

//
// ▒▒▒▒▒▒▒▒▒▒▒▒▒▒▒▒▒▒▒▒▒▒▒▒▒▒▒▒▒▒▒▒▒▒▒▒▒▒▒▒▒▒▒▒▒▒▒▒▒▒▒▒▒▒▒▒▒▒▒▒▒▒▒▒▒▒▒▒▒▒▒▒▒▒▒▒▒▒▒▒▒▒▒▒▒▒▒▒▒▒▒▒▒▒▒▒▒▒▒▒▒▒▒▒▒▒▒▒▒▒▒▒▒▒ //

// === BACKTEST RANGE ===
backTestSectionFrom = input(title = "═══════════════ FROM ═══════════════", defval = true, type = input.bool)

FromMonth       = input(defval = 1, title = "Month", minval = 1)
FromDay         = input(defval = 1, title = "Day", minval = 1)
FromYear        = input(defval = 2019, title = "Year", minval = 2014)

backTestSectionTo = input(title = "════════════════ TO ════════════════", defval = true, type = input.bool)
ToMonth         = input(defval = 31, title = "Month", minval = 1)
ToDay           = input(defval = 12, title = "Day", minval = 1)
ToYear          = input(defval = 9999, title = "Year", minval = 2014)

backTestPeriod() => (time > timestamp(FromYear, FromMonth, FromDay, 00, 00)) and (time < timestamp(ToYear, ToMonth, ToDay, 23, 59))

//
// ▒▒▒▒▒▒▒▒▒▒▒▒▒▒▒▒▒▒▒▒▒▒▒▒▒▒▒▒▒▒▒▒▒▒▒▒▒▒▒▒▒▒▒▒▒▒▒▒▒▒▒▒▒▒▒▒▒▒▒▒▒▒▒▒▒▒▒▒▒▒▒▒▒▒▒▒▒▒▒▒▒▒▒▒▒▒▒▒▒▒▒▒▒▒▒▒▒▒▒▒▒▒▒▒▒▒▒▒▒▒▒▒▒▒ //

parameterSection = input(title = "═════════════ STRATEGY ═════════════", defval = true, type = input.bool)
// === INPUT TO SELECT POSITION ===
positionType = input(defval="LONG", title="Position Type", options=["LONG", "SHORT"])

// === INPUT TO SELECT INITIAL STOP LOSS
initialStopLossPercent = input(defval = 3.0, minval = 0.0, title="Initial Stop Loss")

// === INPUT TO SELECT BARS BACK
barsBack = input(title="ATR Period", defval=1)

// === INPUT TO SELECT MULTPLIER FACTOR 
multplierFactor = input(title="ATR multplierFactoriplier", step=0.1, defval=3.0)

//
// ▒▒▒▒▒▒▒▒▒▒▒▒▒▒▒▒▒▒▒▒▒▒▒▒▒▒▒▒▒▒▒▒▒▒▒▒▒▒▒▒▒▒▒▒▒▒▒▒▒▒▒▒▒▒▒▒▒▒▒▒▒▒▒▒▒▒▒▒▒▒▒▒▒▒▒▒▒▒▒▒▒▒▒▒▒▒▒▒▒▒▒▒▒▒▒▒▒▒▒▒▒▒▒▒▒▒▒▒▒▒▒▒▒▒ //

// LOGIC TO FIND DIRECTION WHEN THERE IS TREND CHANGE ACCORDING VOLATILITY
atr = multplierFactor * atr(barsBack)

longStop = hl2 - atr
longStopPrev = nz(longStop[1], longStop)
longStop := close[1] > longStopPrev ? max(longStop, longStopPrev) : longStop

shortStop = hl2 + atr
shortStopPrev = nz(shortStop[1], shortStop)
shortStop := close[1] < shortStopPrev ? min(shortStop, shortStopPrev) : shortStop

direction = 1
direction := nz(direction[1], direction)
direction := direction == -1 and close > shortStopPrev ? 1 : direction == 1 and close < longStopPrev ? -1 : direction

longColor = color.blue
shortColor = color.blue

var valueToPlot = 0.0
var colorToPlot = color.white

if (direction == 1)
    valueToPlot := longStop
    colorToPlot := color.green
else
    valueToPlot := shortStop
    colorToPlot := color.red

//
// ▒▒▒▒▒▒▒▒▒▒▒▒▒▒▒▒▒▒▒▒▒▒▒▒▒▒▒▒▒▒▒▒▒▒▒▒▒▒▒▒▒▒▒▒▒▒▒▒▒▒▒▒▒▒▒▒▒▒▒▒▒▒▒▒▒▒▒▒▒▒▒▒▒▒▒▒▒▒▒▒▒▒▒▒▒▒▒▒▒▒▒▒▒▒▒▒▒▒▒▒▒▒▒▒▒▒▒▒▒▒▒▒▒▒ //
//
// === GLOBAL VARIABLES AND FUNCTIONS TO STORE IMPORTANT CONDITIONALS TO TRAILING STOP
hasEntryLongConditional() => direction == 1
hasCloseLongConditional() => direction == -1

hasEntryShortConditional() => direction == -1
hasCloseShortConditional() => direction == 1

stopLossPercent = positionType == "LONG" ? initialStopLossPercent * -1 : initialStopLossPercent

var entryPrice = 0.0
var updatedEntryPrice = 0.0
var stopLossPrice = 0.0

hasOpenTrade() => strategy.opentrades != 0
notHasOpenTrade() => strategy.opentrades == 0

strategyClose() =>
    if positionType == "LONG"
        strategy.close("LONG", when=true)
    else 
        strategy.close("SHORT", when=true)

strategyOpen() =>
    if positionType == "LONG"
        strategy.entry("LONG", strategy.long, when=true)
    else 
        strategy.entry("SHORT", strategy.short, when=true)

isLong() => positionType == "LONG" ? true : false
isShort() => positionType == "SHORT" ? true : false


//
// ▒▒▒▒▒▒▒▒▒▒▒▒▒▒▒▒▒▒▒▒▒▒▒▒▒▒▒▒▒▒▒▒▒▒▒▒▒▒▒▒▒▒▒▒▒▒▒▒▒▒▒▒▒▒▒▒▒▒▒▒▒▒▒▒▒▒▒▒▒▒▒▒▒▒▒▒▒▒▒▒▒▒▒▒▒▒▒▒▒▒▒▒▒▒▒▒▒▒▒▒▒▒▒▒▒▒▒▒▒▒▒▒▒▒ //
//
// === LOGIC TO TRAILING STOP IN LONG POSITION

if (isLong() and backTestPeriod())

    crossedStopLoss = close <= stopLossPrice
    terminateOperation = hasOpenTrade() and (crossedStopLoss or hasCloseLongConditional())

    if (terminateOperation)
        entryPrice := 0.0
        updatedEntryPrice := entryPrice
        stopLossPrice := 0.0
        strategyClose()
    
    startOperation = notHasOpenTrade() and hasEntryLongConditional()

    if(startOperation)
        entryPrice := close
        updatedEntryPrice := entryPrice
        stopLossPrice := entryPrice + (entryPrice * stopLossPercent) / 100
        strategyOpen()
        
    strategyPercentege = (close - updatedEntryPrice) / updatedEntryPrice * 100.00
    rideUpStopLoss = hasOpenTrade() and strategyPercentege > 1

    if (isLong() and rideUpStopLoss)
        stopLossPercent := stopLossPercent + strategyPercentege - 1.0
        newStopLossPrice = updatedEntryPrice + (updatedEntryPrice * stopLossPercent) / 100  
        stopLossPrice := max(stopLossPrice, newStopLossPrice)
        updatedEntryPrice := stopLossPrice

//
// ▒▒▒▒▒▒▒▒▒▒▒▒▒▒▒▒▒▒▒▒▒▒▒▒▒▒▒▒▒▒▒▒▒▒▒▒▒▒▒▒▒▒▒▒▒▒▒▒▒▒▒▒▒▒▒▒▒▒▒▒▒▒▒▒▒▒▒▒▒▒▒▒▒▒▒▒▒▒▒▒▒▒▒▒▒▒▒▒▒▒▒▒▒▒▒▒▒▒▒▒▒▒▒▒▒▒▒▒▒▒▒▒▒▒ //
//
// === LOGIC TO TRAILING STOP IN SHORT POSITION

if (isShort() and backTestPeriod())

    crossedStopLoss = close >= stopLossPrice
    terminateOperation = hasOpenTrade() and (crossedStopLoss or hasCloseShortConditional())

    if (terminateOperation)
        entryPrice := 0.0
        updatedEntryPrice := entryPrice
        stopLossPrice := 0.0
        strategyClose()
    
    startOperation = notHasOpenTrade() and hasEntryShortConditional()

    if(startOperation)
        entryPrice := close
        updatedEntryPrice := entryPrice
        stopLossPrice := entryPrice + (entryPrice * stopLossPercent) / 100
        strategyOpen()
        
    strategyPercentege = (close - updatedEntryPrice) / updatedEntryPrice * 100.00
    rideDownStopLoss = hasOpenTrade() and strategyPercentege < -1

    if (rideDownStopLoss)
        stopLossPercent := stopLossPercent + strategyPercentege + 1.0
        newStopLossPrice = updatedEntryPrice + (updatedEntryPrice * stopLossPercent) / 100  
        stopLossPrice := min(stopLossPrice, newStopLossPrice)
        updatedEntryPrice := stopLossPrice

//
// ▒▒▒▒▒▒▒▒▒▒▒▒▒▒▒▒▒▒▒▒▒▒▒▒▒▒▒▒▒▒▒▒▒▒▒▒▒▒▒▒▒▒▒▒▒▒▒▒▒▒▒▒▒▒▒▒▒▒▒▒▒▒▒▒▒▒▒▒▒▒▒▒▒▒▒▒▒▒▒▒▒▒▒▒▒▒▒▒▒▒▒▒▒▒▒▒▒▒▒▒▒▒▒▒▒▒▒▒▒▒▒▒▒▒ 
//
// === DRAWING SHAPES     

entryPricePlotConditinal = entryPrice == 0.0 ? na : entryPrice
trailingStopLossPlotConditional = stopLossPrice == 0.0  ? na : stopLossPrice

plotshape(entryPricePlotConditinal, title= "Entry Price", color=color.blue, style=shape.circle, location=location.absolute, size=size.tiny)
plotshape(trailingStopLossPlotConditional, title= "Stop Loss", color=color.red, style=shape.circle, location=location.absolute, size=size.tiny)

plot(valueToPlot == 0.0 ? na : valueToPlot, title="BuyLine", linewidth=2, color=colorToPlot)
plotshape(direction == 1 and direction[1] == -1 ? longStop : na, title="Buy", style=shape.labelup, location=location.absolute, size=size.normal, text="Buy", transp=0, textcolor = color.white, color=color.green, transp=0)
plotshape(direction == -1 and direction[1] == 1 ? shortStop : na, title="Sell", style=shape.labeldown, location=location.absolute, size=size.normal, text="Sell", transp=0, textcolor = color.white, color=color.red, transp=0)

alertcondition(direction == 1 and direction[1] == -1 ? longStop : na, title="Buy", message="Buy!")
alertcondition(direction == -1 and direction[1] == 1 ? shortStop : na, title="Sell", message="Sell!")