Многофакторная адаптивная стратегия отслеживания импульса


Дата создания: 2023-12-12 12:02:13 Последнее изменение: 2023-12-12 12:02:13
Копировать: 0 Количество просмотров: 648
1
Подписаться
1621
Подписчики

Многофакторная адаптивная стратегия отслеживания импульса

Обзор

Многофакторная автоматическая стратегия отслеживания динамики позволяет автоматизировать торговлю высоко волатильными активами, такими как криптовалюты, путем объединения различных технических показателей для идентификации рыночных тенденций и ключевых уровней сопротивления. Эта стратегия использует такие показатели, как RSI, MACD и Stochastic, для определения времени покупки и продажи, а также для более точной идентификации тенденций в сочетании с процентной долей изменения цен.

Стратегический принцип

В основе стратегии многофакторного автоматического отслеживания динамики лежит интеграция различных технических показателей. Стратегия использует следующие компоненты:

  1. Индекс RSI определяет перекуп и перепродажу. В сочетании с различными параметрами можно распознать обычный сигнал RSI или улучшенный сигнал RSI Conner, чтобы определить, есть ли шанс на обратный ход.

  2. MACD-индикатор помогает определить направление тренда.

  3. Стохастический индикатор идентифицирует зоны перекупа и перепродажи.

  4. Процентное изменение цены проверяет, действительно ли это прорыв. Процентное изменение наивысшей, самой низкой, закрытой цены в течение определенного периода определяет, является ли это настоящим прорывом.

  5. Показатель EMA определяет высокий уровень пробега. Пробег вверх по быстрой линии является позитивным сигналом, а вниз - падением.

Стратегия, основанная на том, что рынок свободен, выбирает дополнительный коучинг, и после входа в позицию устанавливает стоп-стоп, эффективно контролируя риск. Выбирает выход из позиции, когда появляется сигнал об обратном движении. Весь процесс принятия решений полностью сочетает в себе несколько факторов суждения, что позволяет более точное суждение.

Анализ преимуществ

Эта стратегия имеет следующие преимущества:

  1. Многофакторный драйв имеет преимущество в оценке. По сравнению с одним показателем, комбинация из нескольких показателей может быть проверена друг другом, что делает результаты более точными и надежными, что позволяет сэкономить ненужные расходы на транзакцию.

  2. Условия строго избегают ошибочных сделок. Стратегия устанавливает строгие требования к условиям купли-продажи, требуя одновременного выпуска сигналов от нескольких индикаторов, что позволяет отфильтровать большое количество шума и избежать ошибочных сделок.

  3. Способность встроенной стратегии динамически вычислять параметры показателей, избегая субъективности искусственного выбора сверхпараметров, что делает параметры стратегии более научными.

  4. Контроль риска с помощью механизма стоп-стоп. Стратегия рассчитывает и отображает положение стоп-стоп в режиме реального времени после открытия позиции, что позволяет эффективно контролировать единичные потери и избегать появления взрыва.

Анализ рисков

В этой стратегии есть некоторые риски, которые необходимо избегать:

  1. Вероятность того, что индикатор выпустит ошибочный сигнал. Несмотря на то, что проверка с использованием нескольких показателей может значительно снизить уровень ошибочного сигнала, это может произойти. Это может привести к ненужным потерям.

  2. Риск превышения стоп-убытков. В крайних случаях может произойти обвал цены, в результате чего первоначальные стоп-убытки будут легко превышены, что приведет к большим потерям.

  3. Переоптимизация, вызванная оптимизацией параметров. Динамические параметры, хотя и избегают субъективности, вызванной искусственным выбором, могут также привести к переоптимизации параметров и потере способности к генерализации.

Решение проблемы:

  1. Увеличение строгости условий фильтрации сигнала, снижение погрешности.
  2. Для того, чтобы избежать больших потерь, необходимо строить склады по частям.
  3. Увеличение количества проб, строгая оценка стабильности параметров.

Направление оптимизации стратегии

Существуют также несколько оптимизируемых измерений стратегии многофакторного адаптивного динамического отслеживания:

  1. Увеличение количества факторов суждения. В сочетании с дополнительными суждениями о различных типах индикаторных сигналов, таких как волатильность, объем торгов и т. Д.

  2. Оптимизация алгоритмов стоп-механизмов. Можно ввести более продвинутые алгоритмы стоп-стоп, такие как стоп-трекер, стоп-шокер, чтобы еще больше снизить вероятность прорыва стоп-стоп.

  3. Внедрение моделей машинного обучения. Использование моделей, таких как RNN, LSTM, для моделирования исторических данных, которые могут помочь в принятии решений о покупке или продаже.

  4. Интеграция стратегий. Использование нескольких подстратегий и их интеграция с помощью методов интегрированного обучения позволяет достичь более стабильной комплексной производительности.

Подвести итог

Многофакторная стратегия автоматического отслеживания динамики включает в себя использование нескольких технических показателей для определения времени покупки и продажи. По сравнению с одним показателем, стратегия более точна, при этом встроенные параметры автоматически адаптируются и механизм остановки контролирует риски. Следующий шаг может дополнительно повысить эффективность стратегии путем введения дополнительных вспомогательных факторов суждения, передовых алгоритмов остановки и методов машинного обучения.
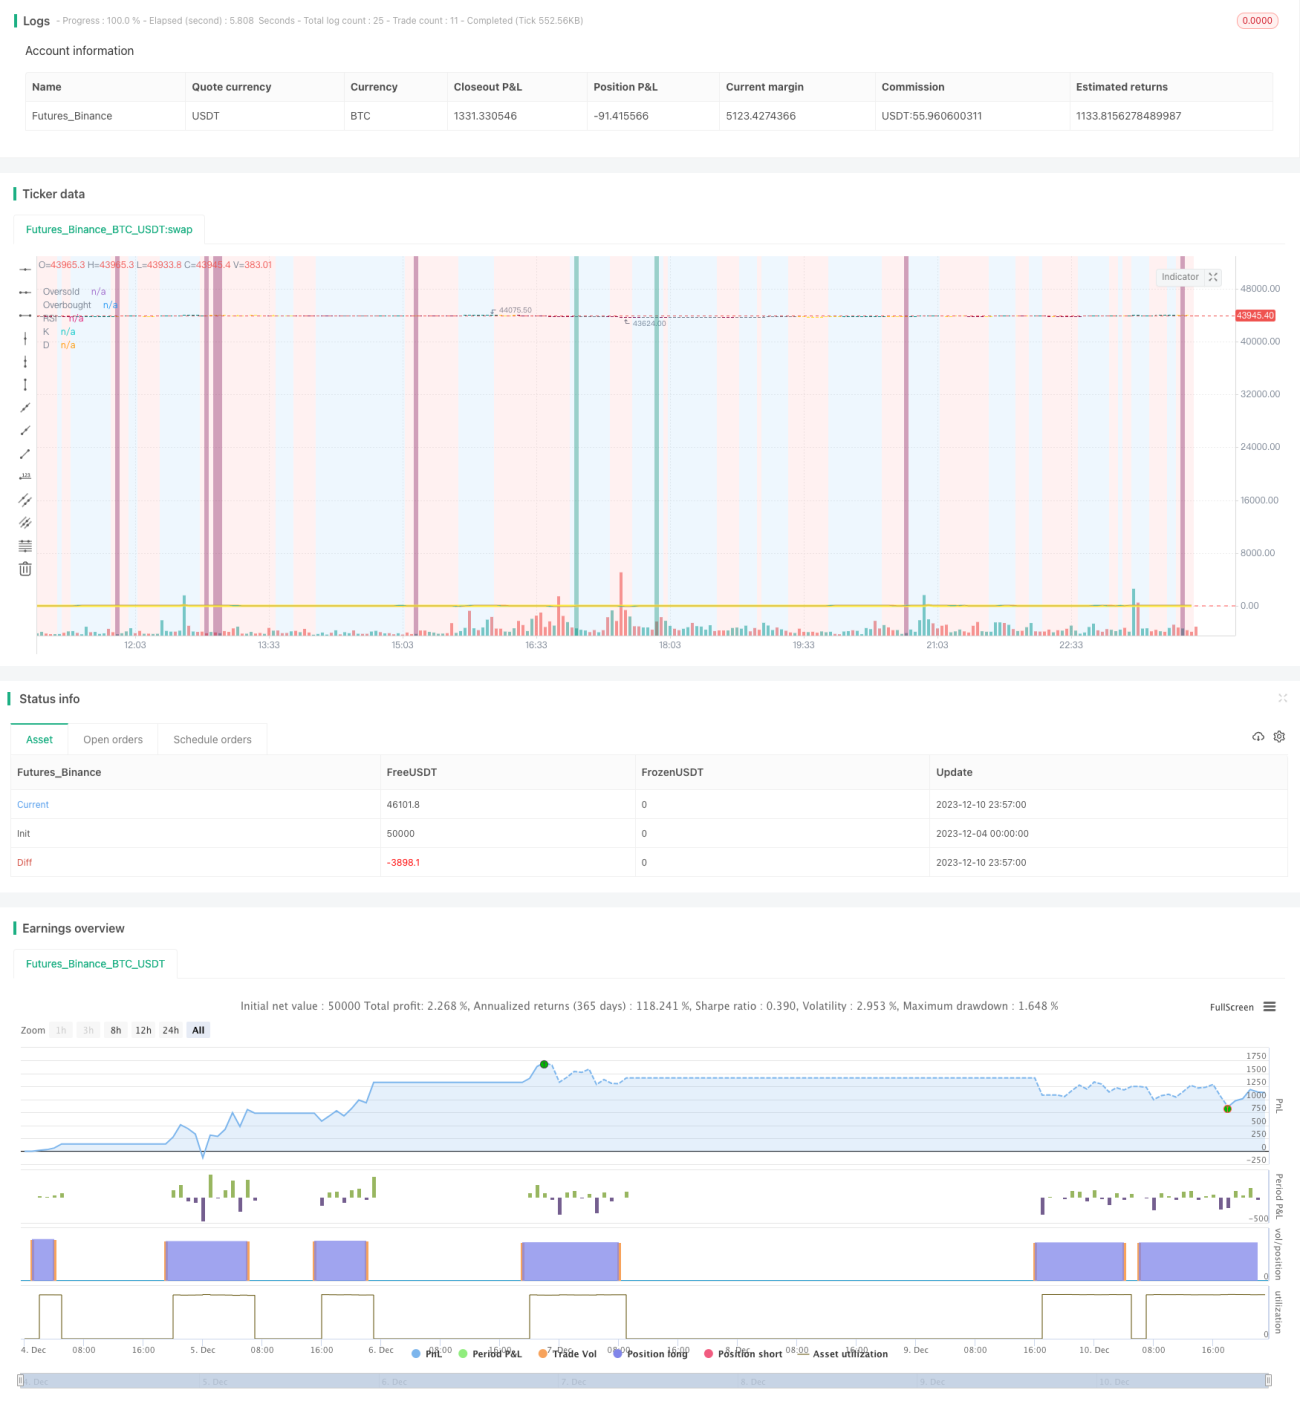
Исходный код стратегии
/*backtest
start: 2023-12-04 00:00:00
end: 2023-12-11 00:00:00
period: 3m
basePeriod: 1m
exchanges: [{"eid":"Futures_Binance","currency":"BTC_USDT"}]
*/

// This source code is subject to the terms of the Mozilla Public License 2.0 at https://mozilla.org/MPL/2.0/
//@version=4

// ██████╗██████╗ ███████╗ █████╗ ████████╗███████╗██████╗     ██████╗ ██╗   ██╗    
//██╔════╝██╔══██╗██╔════╝██╔══██╗╚══██╔══╝██╔════╝██╔══██╗    ██╔══██╗╚██╗ ██╔╝                       
//██║     ██████╔╝█████╗  ███████║   ██║   █████╗  ██║  ██║    ██████╔╝ ╚████╔╝                        
//██║     ██╔══██╗██╔══╝  ██╔══██║   ██║   ██╔══╝  ██║  ██║    ██╔══██╗  ╚██╔╝                         
//╚██████╗██║  ██║███████╗██║  ██║   ██║   ███████╗██████╔╝    ██████╔╝   ██║                          
// ╚═════╝╚═╝  ╚═╝╚══════╝╚═╝  ╚═╝   ╚═╝   ╚══════╝╚═════╝     ╚═════╝    ╚═╝                          
                                                                                                     
//███████╗ ██████╗ ██╗     ██╗   ██╗████████╗██╗ ██████╗ ███╗   ██╗███████╗ ██╗ █████╗ ███████╗ █████╗ 
//██╔════╝██╔═══██╗██║     ██║   ██║╚══██╔══╝██║██╔═══██╗████╗  ██║██╔════╝███║██╔══██╗╚════██║██╔══██╗
//███████╗██║   ██║██║     ██║   ██║   ██║   ██║██║   ██║██╔██╗ ██║███████╗╚██║╚██████║    ██╔╝╚█████╔╝
//╚════██║██║   ██║██║     ██║   ██║   ██║   ██║██║   ██║██║╚██╗██║╚════██║ ██║ ╚═══██║   ██╔╝ ██╔══██╗
//███████║╚██████╔╝███████╗╚██████╔╝   ██║   ██║╚██████╔╝██║ ╚████║███████║ ██║ █████╔╝   ██║  ╚█████╔╝
//╚══════╝ ╚═════╝ ╚══════╝ ╚═════╝    ╚═╝   ╚═╝ ╚═════╝ ╚═╝  ╚═══╝╚══════╝ ╚═╝ ╚════╝    ╚═╝   ╚════╝ 

strategy(shorttitle='Ain1 No Label',title='All in One Strategy no RSI Label', overlay=true, scale=scale.left, initial_capital = 1000, process_orders_on_close=true, default_qty_type = strategy.percent_of_equity, default_qty_value = 100, commission_type=strategy.commission.percent, commission_value=0.18, calc_on_every_tick=true)

kcolor = color.new(#0094FF, 60)
dcolor = color.new(#FF6A00, 60)


// -----------------  Strategy Inputs -------------------------------------------------------------
//Backtest dates with auto finish date of today
start = input(defval = timestamp("01 April 2021 00:00 -0500"), title = "Start Time", type = input.time)
finish = input(defval = timestamp("31 December 2021 00:00 -0600"), title = "End Time", type = input.time)
window()  => true       // create function "within window of time"


// Strategy Selection - Long, Short, or Both
stratinfo = input(true, "Long/Short for Mixed Market, Long for Bull, Short for Bear")
strat = input(title="Trade Types", defval="Long/Short", options=["Long Only", "Long/Short", "Short Only"])
strat_val = strat == "Long Only" ? 1 : strat == "Long/Short" ? 0 : -1

// Risk Management Inputs
sl= input(10.0, "Stop Loss %", minval = 0, maxval = 100, step = 0.01)
stoploss = sl/100
tp = input(20.0, "Target Profit %", minval = 0, maxval = 100, step = 0.01)
TargetProfit = tp/100


useXRSI = input(false, "Use RSI crossing back, select only one strategy")
useCRSI = input(false, "Use Tweaked Connors RSI, select only one")
RSIInfo = input(true, "These are the RSI Strategy Inputs, RSI Length applies to MACD, set OB and OS to 45 for using Stoch and EMA strategies.")
length = input(14, "RSI Length", minval=1)
overbought= input(62, "Overbought")
oversold= input(35, "Oversold")
cl1 = input(3, "Connor's MA Length 1", minval=1, step=1)
cl2 = input(20, "Connor's MA Lenght 2", minval=1, step=1)
cl3 = input(50, "Connor's MA Lenght 3", minval=1, step=1)

// MACD and EMA Inputs
useMACD = input(false, "Use MACD Only, select only one strategy")
useEMA  = input(false, "Use EMA Only, select only one strategy (EMA uses Stochastic inputs too)")
MACDInfo=input(true, "These are the MACD strategy variables")
fastLength = input(5, minval=1, title="EMA Fast Length")
slowLength = input(10, minval=1, title="EMA Slow Length")
ob_min = input(52, "Overbought Lookback Minimum Value", minval=0, maxval=200)
ob_lb = input(25, "Overbought Lookback Bars", minval=0, maxval=100)
os_min = input(50, "Oversold Lookback Minimum Value", minval=0, maxval=200)
os_lb = input(35, "Oversold Lookback Bars", minval=0, maxval=100)
source = input(title="Source", type=input.source, defval=close)
RSI = rsi(source, length)


// Price Movement Inputs
PriceInfo = input(true, "Price Change Percentage Cross Check Inputs for all Strategies, added logic to avoid early sell")
lkbk = input(5,"Max Lookback Period")

// EMA and SMA Background Inputs
useStoch    = input(false, "Use Stochastic Strategy, choose only one")
StochInfo   = input(true, "Stochastic Strategy Inputs")
smoothK     = input(3, "K", minval=1)
smoothD     = input(3, "D", minval=1)
k_mode      = input("SMA", "K Mode", options=["SMA", "EMA", "WMA"])
high_source = input(high,"High Source")
low_source= input(low,"Low Source")
HTF = input("","Curernt or Higher time frame only", type=input.resolution)

// Selections to show or hide the overlays
showZones = input(true, title="Show Bullish/Bearish Zones")
showStoch = input(true, title="Show Stochastic Overlays")
showRSIBS = input(true, title="Show RSI Buy Sell Zones")
showMACD = input(true, title="Show MACD")
color_bars=input(true, "Color Bars")


// ------------------ Dynamic RSI Calculation ----------------------------------------

AvgHigh(src,cnt,val) =>
    total = 0.0
    count = 0
    for i = 0 to cnt
        if src[i] > val
            count := count + 1
            total := total + src[i]
    round(total / count)
    
RSI_high = AvgHigh(RSI, ob_lb, ob_min)

AvgLow(src,cnt,val) =>
    total = 0.0
    count = 0
    for i = 0 to cnt
        if src[i] < val
            count := count + 1
            total := total + src[i]
    round(total / count)

RSI_low = AvgLow(RSI, os_lb, os_min)


// ------------------ Price Percentage Change Calculation -----------------------------------------
perc_change(lkbk) =>
    overall_change = ((close[0] - open[lkbk]) / open[lkbk]) * 100
    highest_high = 0.0
    lowest_low = 0.0
    for i = lkbk to 0
        highest_high := i == lkbk ? high : high[i] > high[(i + 1)] ? high[i] : highest_high[1]
        lowest_low := i == lkbk ? low : low[i] < low[(i + 1)] ? low[i] : lowest_low[1]
    
    start_to_high = ((highest_high - open[lkbk]) / open[lkbk]) * 100
    start_to_low = ((lowest_low - open[lkbk]) / open[lkbk]) * 100
    previous_to_high = ((highest_high - open[1])/open[1])*100
    previous_to_low = ((lowest_low-open[1])/open[1])*100
    previous_bar = ((close[1]-open[1])/open[1])*100
    
    [overall_change, start_to_high, start_to_low, previous_to_high, previous_to_low, previous_bar]
    
// Call the function    
[overall, to_high, to_low, last_high, last_low, last_bar] = perc_change(lkbk)

// Plot the function
//plot(overall*50, color=color.white, title='Overall Percentage Change', linewidth=3)
//plot(to_high*50, color=color.green,title='Percentage Change from Start to High', linewidth=2)
//plot(to_low*50, color=color.red, title='Percentage Change from Start to Low', linewidth=2)
//plot(last_high*100, color=color.teal, title="Previous to High", linewidth=2)
//plot(last_low*100, color=color.maroon, title="Previous to Close", linewidth=2)
//plot(last_bar*100, color=color.orange, title="Previous Bar", linewidth=2)
//hline(0, title='Center Line', color=color.orange, linewidth=2)

true_dip = overall < 0 and to_high > 0 and to_low < 0 and last_high > 0 and last_low < 0 and last_bar < 0
true_peak = overall > 0 and to_high > 0 and to_low > 0 and last_high > 0 and last_low < 0 and last_bar > 0

alertcondition(true_dip, title='True Dip', message='Dip')
alertcondition(true_peak, title='True Peak', message='Peak')

// ------------------ Background Colors based on EMA Indicators -----------------------------------
// Uses standard lengths of 9 and 21, if you want control delete the constant definition and uncomment the inputs
haClose(gap) => (open[gap] + high[gap] + low[gap] + close[gap]) / 4
rsi_ema = rsi(haClose(0), length)
v2 = ema(rsi_ema, length)                                                
v3 = 2 * v2 - ema(v2, length)  
emaA = ema(rsi_ema, fastLength)                                     
emaFast = 2 * emaA - ema(emaA, fastLength)
emaB = ema(rsi_ema, slowLength)                                     
emaSlow = 2 * emaB - ema(emaB, slowLength) 

//plot(rsi_ema, color=color.white, title='RSI EMA', linewidth=3)
//plot(v2, color=color.green,title='v2', linewidth=2)
//plot(v3, color=color.red, title='v3', linewidth=2)
//plot(emaFast, color=color.teal, title="EMA Fast", linewidth=2)
//plot(emaSlow, color=color.maroon, title="EMA Slow", linewidth=2)

EMABuy = crossunder(emaFast, v2) and window()
EMASell = crossover(emaFast, emaSlow) and window()


alertcondition(EMABuy, title='EMA Buy', message='EMA Buy Condition')
alertcondition(EMASell, title='EMA Sell', message='EMA Sell Condition')


// bullish signal rule: 
bullishRule =emaFast > emaSlow
// bearish signal rule: 
bearishRule =emaFast < emaSlow

// current trading State
ruleState = 0
ruleState := bullishRule ? 1 : bearishRule ? -1 : nz(ruleState[1])
ruleColor = ruleState==1 ? color.new(color.blue, 90) : ruleState == -1 ? color.new(color.red, 90) : ruleState == 0 ? color.new(color.gray, 90) : na
bgcolor(showZones ? ruleColor : na, title="Bullish/Bearish Zones")


// ------------------  Stochastic Indicator Overlay -----------------------------------------------

// Calculation
// Use highest highs and lowest lows
h_high = highest(high_source ,lkbk)
l_low = lowest(low_source ,lkbk)

stoch = stoch(RSI, RSI_high, RSI_low, length)
k =
 k_mode=="EMA" ? ema(stoch, smoothK) :
 k_mode=="WMA" ? wma(stoch, smoothK) :
 sma(stoch, smoothK)
d = sma(k, smoothD)
k_c = change(k)
d_c = change(d)
kd = k - d

// Plot
signalColor = k>oversold and d<overbought and k>d and k_c>0 and d_c>0 ? kcolor : 
 k<overbought and d>oversold and k<d and k_c<0 and d_c<0 ? dcolor : na
kp = plot(showStoch ? k : na, "K", color=kcolor)
dp = plot(showStoch ? d : na, "D", color=dcolor)
fill(kp, dp, color = signalColor, title="K-D")
signalUp = showStoch ? not na(signalColor) and kd>0 : na
signalDown = showStoch ? not na(signalColor) and kd<0 : na
//plot(signalUp ? kd : na, "Signal Up", color=kcolor, transp=90, style=plot.style_columns)
//plot(signalDown ? (kd+100) : na , "Signal Down", color=dcolor, transp=90, style=plot.style_columns, histbase=100)

//StochBuy = crossover(k, d) and kd>0 and to_low<0 and window()
//StochSell = crossunder(k,d) and kd<0 and to_high>0 and window()

StochBuy = crossover(k, d) and window()
StochSell = crossunder(k, d) and window()

alertcondition(StochBuy, title='Stoch Buy', message='K Crossing D')
alertcondition(StochSell, title='Stoch Sell', message='D Crossing K')


// -------------- Add Price Movement -------------------------
// Calculations
h1 = vwma(high, length)
l1 = vwma(low, length)
hp = h_high[1]
lp = l_low[1]

// Plot
var plot_color=#353535
var sig = 0
if (h1 >hp)
    sig:=1
    plot_color:=color.lime
else if (l1 <lp)
    sig:=-1
    plot_color:=color.maroon
//plot(1,title = "Price Movement Bars", style=plot.style_columns,color=plot_color)
//plot(sig,title="Signal 1 or -1",display=display.none)


// --------------------------------------- RSI Plot ----------------------------------------------
// Plot Oversold and Overbought Lines
over = hline(oversold, title="Oversold", color=color.green)
under = hline(overbought, title="Overbought", color=color.red)
fillcolor = color.new(#9915FF, 90)
fill(over, under, fillcolor, title="Band Background")


// Show RSI and EMA crosses with arrows and RSI Color (tweaked Connors RSI)
// Improves strategy setting ease by showing where EMA 5 crosses EMA 10 from above to confirm overbought conditions or trend reversals
// This shows where you should enter shorts or exit longs

// Tweaked Connors RSI Calculation
connor_ob = overbought
connor_os = oversold
ma1 = sma(close,cl1)
ma2 = sma(close, cl2)
ma3 = sma(close, cl3)

// Buy Sell Zones using tweaked Connors RSI (RSI values of 80 and 20 for Crypto as well as ma3, ma20, and ma50 are the tweaks)
RSI_SELL = ma1 > ma2 and open > ma3 and RSI >= connor_ob and true_peak and window()
RSI_BUY = ma2 < ma3 and ma3 > close and RSI <= connor_os and true_dip and window()

alertcondition(RSI_BUY, title='Connors Buy', message='Connors RSI Buy')
alertcondition(RSI_SELL, title='Connors Sell', message='Connors RSI Sell')

// Color Definition
col = useCRSI ? (close > ma2 and close < ma3 and RSI <= connor_os ? color.lime : close < ma2 and close > ma3 and RSI <= connor_ob ? color.red : color.yellow ) : color.yellow

// Plot colored RSI Line
plot(RSI, title="RSI", linewidth=3, color=col)


//------------------- MACD Strategy -------------------------------------------------
[macdLine, signalLine, _] = macd(close, fastLength, slowLength, length)

bartrendcolor = macdLine > signalLine and k > 50 and RSI > 50 ? color.teal : macdLine < signalLine and k < 50 and RSI < 50 ? color.maroon : macdLine < signalLine ? color.yellow : color.gray
barcolor(color = color_bars ? bartrendcolor : na)


MACDBuy = macdLine>signalLine and RSI<RSI_low and overall<0 and window()
MACDSell = macdLine<signalLine and RSI>RSI_high and overall>0 and window()

//plotshape(showMACD ? MACDBuy: na, title = "MACD Buy", style = shape.arrowup, text = "MACD Buy", color=color.green, textcolor=color.green, size=size.small)
//plotshape(showMACD ? MACDSell: na, title = "MACD Sell", style = shape.arrowdown, text = "MACD Sell", color=color.red, textcolor=color.red, size=size.small)
MACColor = MACDBuy ? color.new(color.teal, 50) : MACDSell ? color.new(color.maroon, 50) : na
bgcolor(showMACD ? MACColor : na, title ="MACD Signals")


// -------------------------------- Entry and Exit Logic ------------------------------------


// Entry Logic
XRSI_OB = crossunder(RSI, overbought) and overall<0 and window()
RSI_OB = RSI>overbought and true_peak and window()
XRSI_OS = crossover(RSI, oversold) and overall>0 and window()
RSI_OS = RSI<oversold and true_dip and window()

alertcondition(XRSI_OB, title='Reverse RSI Sell', message='RSI Crossing back under OB')
alertcondition(XRSI_OS, title='Reverse RSI Buy', message='RSI Crossing back over OS')

alertcondition(RSI_OS, title='RSI Buy', message='RSI Crossover OS')
alertcondition(RSI_SELL, title='RSI Sell', message='RSI Crossunder OB')


// Strategy Entry and Exit with built in Risk Management
GoLong = strategy.position_size==0 and strat_val > -1 and rsi_ema > RSI and k < d ? (useXRSI ? XRSI_OS : useMACD ? MACDBuy : useCRSI ? RSI_BUY : useStoch ? StochBuy : RSI_OS) : false

GoShort = strategy.position_size==0 and strat_val < 1 and rsi_ema < RSI and d < k ? (useXRSI ? XRSI_OB : useMACD ? MACDSell : useCRSI ? RSI_SELL : useStoch ? StochSell : RSI_OB) : false

if (GoLong)
    strategy.entry("LONG", strategy.long)

if (GoShort) 
    strategy.entry("SHORT", strategy.short)


longStopPrice  = strategy.position_avg_price * (1 - stoploss)
longTakePrice  = strategy.position_avg_price * (1 + TargetProfit)
shortStopPrice = strategy.position_avg_price * (1 + stoploss)
shortTakePrice = strategy.position_avg_price * (1 - TargetProfit)

//plot(series=(strategy.position_size > 0) ? longTakePrice : na, color=color.green, style=plot.style_circles, linewidth=3, title="Long Take Profit")
//plot(series=(strategy.position_size < 0) ? shortTakePrice : na, color=color.green, style=plot.style_circles, linewidth=3, title="Short Take Profit")
//plot(series=(strategy.position_size > 0) ? longStopPrice : na, color=color.red, style=plot.style_cross, linewidth=2, title="Long Stop Loss")
//plot(series=(strategy.position_size < 0) ? shortStopPrice : na, color=color.red, style=plot.style_cross, linewidth=2, title="Short Stop Loss")

if (strategy.position_size > 0)
    strategy.exit(id="Exit Long", from_entry = "LONG", stop = longStopPrice, limit = longTakePrice)
    
if (strategy.position_size < 0)
    strategy.exit(id="Exit Short", from_entry = "SHORT", stop = shortStopPrice, limit = shortTakePrice)


CloseLong = strat_val > -1 and strategy.position_size > 0 and rsi_ema > RSI and d > k ? (useXRSI ? XRSI_OB : useMACD ? MACDSell : useCRSI ? RSI_SELL : RSI_OB) : false

if(CloseLong)
    strategy.close("LONG")
        
CloseShort = strat_val < 1 and strategy.position_size < 0 and rsi_ema < RSI and k > d ? (useXRSI ? XRSI_OS : useMACD ? MACDBuy : useCRSI ? RSI_BUY : RSI_OS) : false

if(CloseShort)
    strategy.close("SHORT")