Стратегии торговли осциллятором

Обзор
Это реверсивная торговая стратегия, основанная на нескольких технических показателях. Она объединяет такие показатели, как CCI, динамический индикатор и RSI, чтобы идентифицировать потенциальные возможности для торговли сверх и ниже нуля.
Стратегический принцип
Торговые сигналы для этой стратегии исходят из пользовательского индикатора Edri, который учитывает перекрестное положение CCI, динамического индикатора и RSI. Конкретная логика:
Условия многоголовной сигнализации:
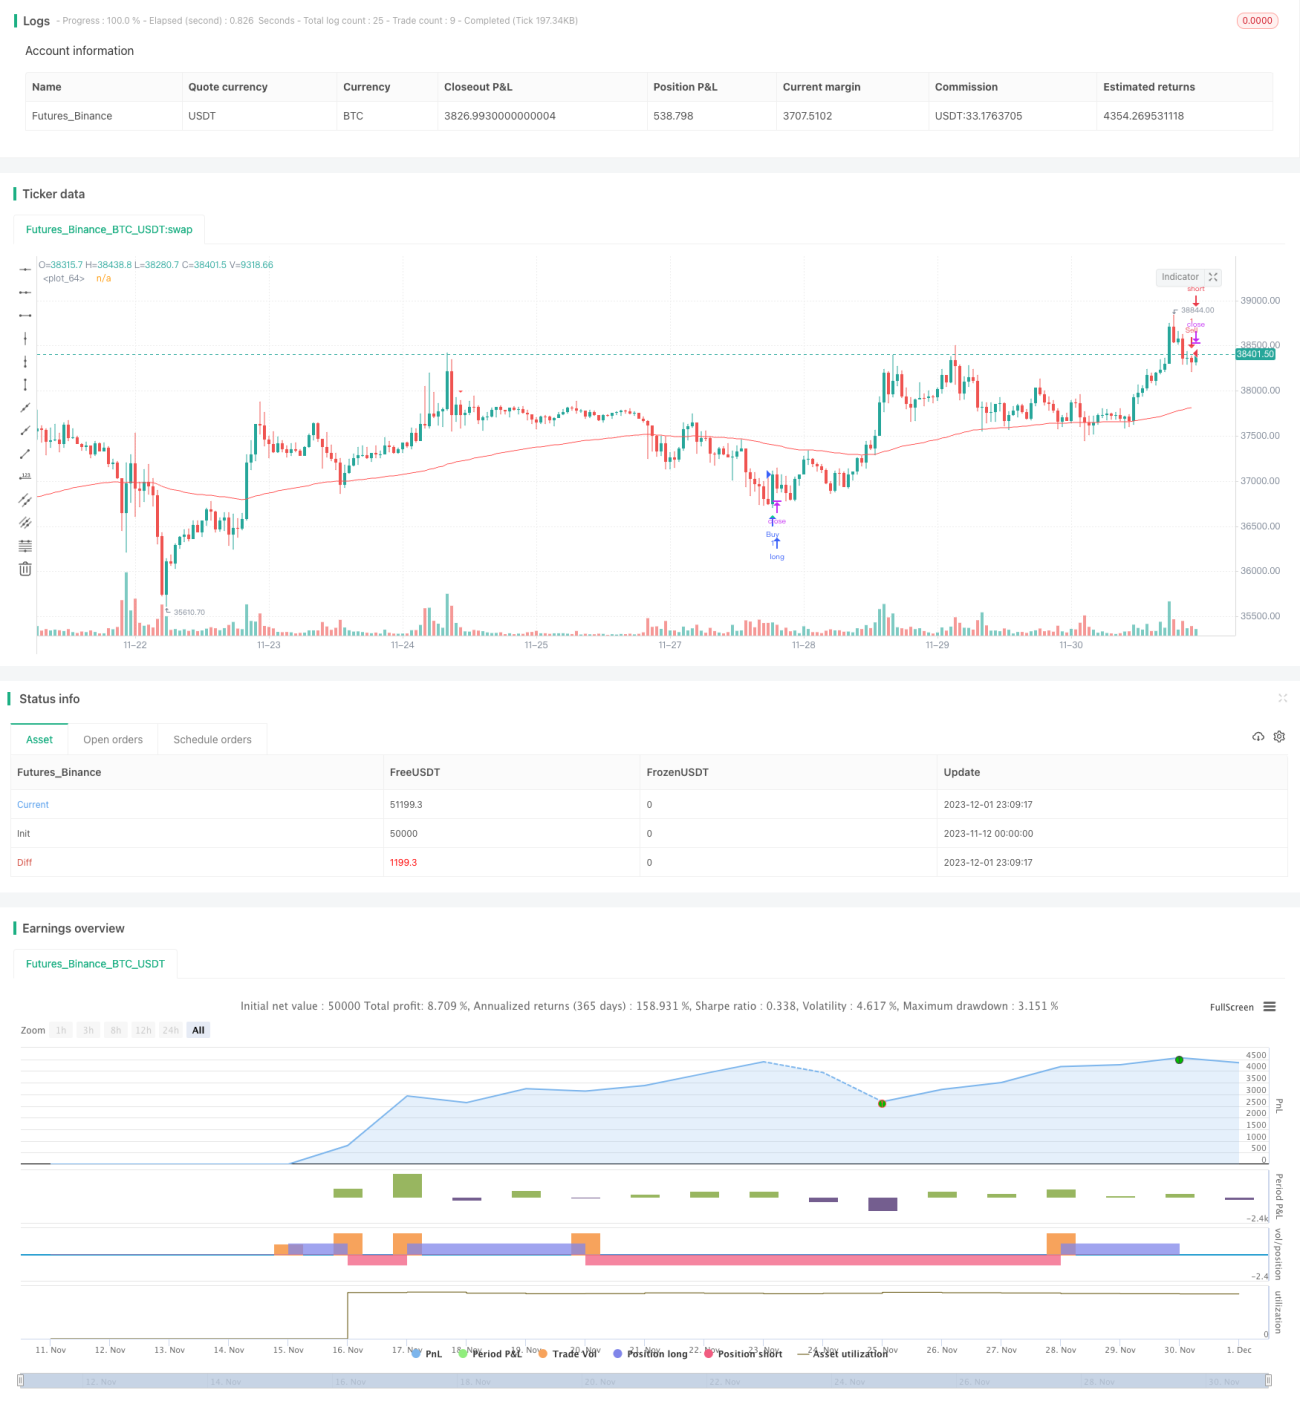
- Поточный криптовалютный индикатор "Эдри" дает сигнал "купить", то есть CCI пересекает 0-угол или динамический индикатор пересекает 0-угол, а RSI ниже линии "продавать".
- Цена снизилась или упала ниже 100-циклической EMA.
Условия пустого сигнала:
- Точка продажи - это точка продажи, когда CCI пересекает 0-ую ось, а RSI выше, чем перекуп.
- Цена снизилась или превысила 100-циклическую EMA.
Стратегия также может быть настроена на поиск обычных отклонений, то есть RSI и цены имеют явные отклонения, чтобы создать торговый сигнал.
При удовлетворении торгового сигнала, точка остановки для стратегии - входная цена ± 2 ATR, точка остановки - входная цена ± 4 ATR. Это позволяет установить разумный предел остановки для убытков в зависимости от степени волатильности рынка.
Анализ преимуществ
- Анализ нескольких показателей помогает избежать ложных сигналов в одном показателе.
- Реверсивный способ торговли, способствующий поимке коротких торговых возможностей в условиях потрясений.
- ATR Stop Loss Stop Mode, может корректировать позиции в зависимости от волатильности рынка.
- Можно искать отклонения от условий, чтобы избежать открытия позиций в не крайних случаях перекупа и перепродажи.
Анализ рисков
- Неправильная настройка параметров индикатора может привести к пропущенным торговым возможностям или создать слишком много ошибочных сигналов.
- Реверсивная торговля может привести к последовательным потерям в условиях тренда.
- ATR имеет запаздывающий характер и не может своевременно обновлять стоп-стоп-пойнт в быстро меняющихся условиях.
Решение проблемы:
- Оптимизация и повторная проверка параметров показателя позволяют определить оптимальную комбинацию параметров.
- В некоторых странах, например, в Китае и Китае, существуют различные методы борьбы с инфляцией, которые используются для борьбы с инфляцией.
- В сочетании с другими методами остановки, такими как перемещение или нарушение остановки.
Направление оптимизации
- Тестирование различных комбинаций параметров, таких как циклы CCI и динамического индикатора, параметры RSI, ATR и т. д.
- Добавить дополнительные фильтрующие условия, такие как ценовая модель, изменение объемов поставок и т.д.
- Настройка управления позициями, например, установка пропорций позиций в соответствии с значениями ATR.
- Параметры шаблонов для различных сортов и периодов.
- Вместе с этим следует рассмотреть возможность приостановки обратной торговли при наличии трендовых явлений в сочетании с механизмом отслеживания тенденций.
Подвести итог
Эта стратегия применяется в основном в шокирующих ситуациях, для получения более стабильной прибыли путем захвата средне-коротких обратных линий. Она помогает идентифицировать краткосрочные тенденции роста цены и генерировать торговые сигналы на основе нескольких показателей.
- 1