Стратегия пересечения скользящих средних CCI с индикатором RSI и полосами Боллинджера

Обзор
Данная стратегия объединяет использование полос Боллинджера, индекса относительной силы (RSI) и индекса товарного канала (CCI) для поиска пересечений этих индикаторов, генерируя сигналы на покупку и продажу. Стратегия направлена на выявление состояний перекупленности и перепроданности рынка, вход в точки разворота с целью получения хорошей доходности.
Принцип работы стратегии
Полосы Боллинджера
Полосы Боллинджера состоят из средней, верхней и нижней линий. Средняя линия обычно представляет собой 20-дневную скользящую среднюю. Верхняя и нижняя полосы находятся на расстоянии двух стандартных отклонений выше и ниже средней линии. Если цена приближается к нижней полосе, это считается сигналом перепроданности. Если цена приближается к верхней полосе, это считается сигналом перекупленности.
Индикатор RSI
Индикатор RSI отражает скорость изменения роста и падения цен закрытия за определенный период, измеряя соотношение сил покупателей и продавцов. Значения RSI в диапазоне 0–30 считаются зоной перепроданности, а 70–100 — зоной перекупленности. Когда RSI снижается из зоны перекупленности, это может служить сигналом к продаже, а когда RSI растет из зоны перепроданности — сигналом к покупке.
Индикатор CCI
Индикатор CCI используется для измерения степени отклонения цены акции от её средней цены. Значение +100 указывает на то, что цена значительно выше средней (перекупленность), а -100 — на то, что цена значительно ниже средней (перепроданность). CCI способен отражать экстремальные ценовые состояния.
Сигналы пересечения стратегии
Данная стратегия использует полосы Боллинджера для оценки краткосрочной перекупленности/перепроданности цены, индикатор RSI — для оценки баланса сил покупателей и продавцов, а индикатор CCI — для оценки степени отклонения цены. Когда все три индикатора одновременно подают сигнал на покупку или продажу, генерируется торговый приказ.
Преимущества стратегии
- Комбинация нескольких индикаторов снижает количество ложных сигналов и повышает их точность.
- Выявляет точки разворота рынка, позволяя ловить тренды на развороте.
- Все параметры настраиваются под различные рыночные условия.
- Использование скользящей средней для фильтрации индикатора CCI уменьшает шум и повышает стабильность.
Риски и пути их решения
- Индикаторы Боллинджера, RSI и CCI могут генерировать ложные сигналы, приводящие к убыткам. Можно смягчить параметры или добавить другие индикаторы для верификации.
- Индикатор CCI менее подходит для боковых рынков; его можно заменить на скользящую среднюю или индикатор волатильности.
- Торговые приказы содержат только стоп-лосс, без тейк-профита. Можно добавить скользящий тейк-профит для фиксации части прибыли.
Направления оптимизации
- Протестировать больше комбинаций параметров для поиска оптимальных.
- Добавить алгоритмы машинного обучения для оптимизации параметров в реальном времени.
- Внедрить стратегию фиксации прибыли с установкой целевой прибыли.
- Комбинировать с дополнительными индикаторами (например, MACD, стохастик) для оценки надежности сигналов.
Заключение
Данная стратегия комплексно учитывает краткосрочные, среднесрочные и долгосрочные рыночные условия, определяя моменты разворота рынка по пересечениям трех индикаторов (полосы Боллинджера, RSI и CCI). Она относится к довольно надежным стратегиям следования за разворотами. Дальнейшая оптимизация возможна путем настройки параметров, добавления способов фиксации прибыли и т.д., что делает её применимой в различных рыночных условиях.
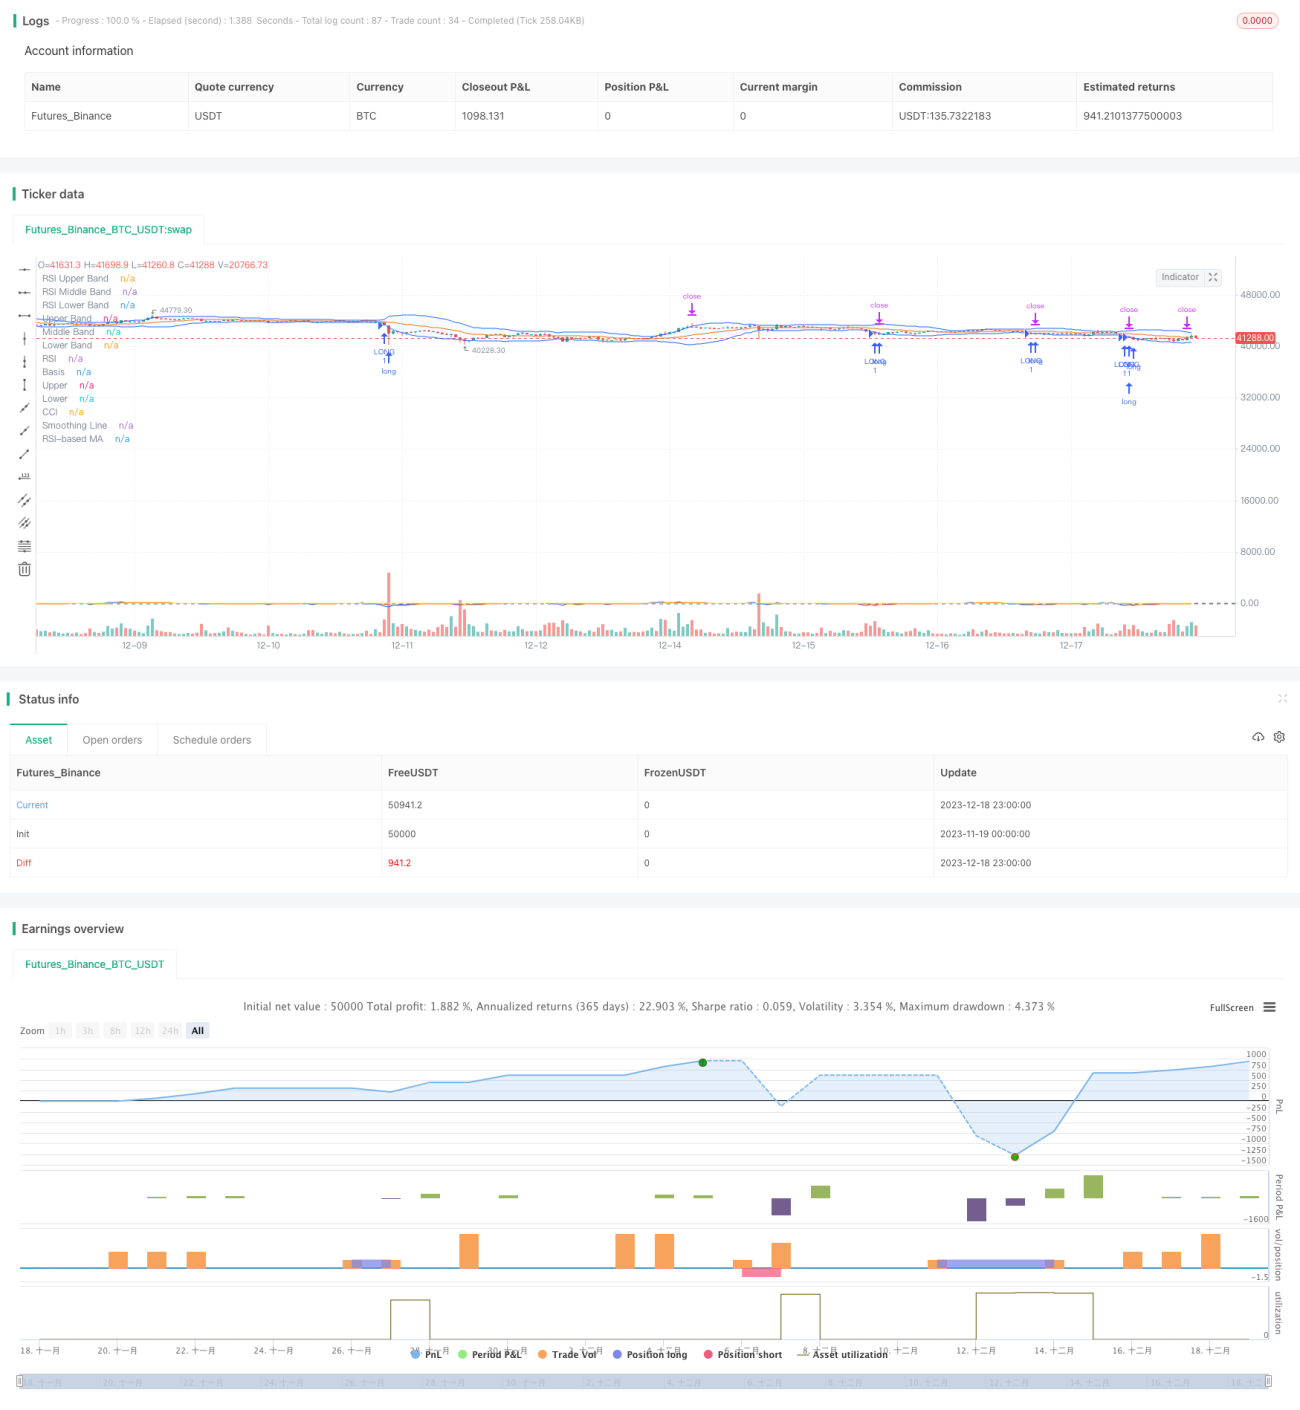
/*backtest
start: 2023-11-19 00:00:00
end: 2023-12-19 00:00:00
period: 1h
basePeriod: 15m
exchanges: [{"eid":"Futures_Binance","currency":"BTC_USDT"}]
*/

//@version=5
strategy(shorttitle="BBRSIstr", title="Bollinger Bands", overlay=true)
length = input.int(20, minval=1)
maType = input.string("SMA", "Basis MA Type", options = ["SMA", "EMA", "SMMA (RMA)", "WMA", "VWMA"])- 1