Стратегия следования за трендом на основе RSI и взвешенной скользящей средней
Обзор
Эта стратегия основана на двух известных показателях: относительно слабых показателях ((RSI) и весовых движущихся средних ((Weighted Moving Average, WMA), которые используются для идентификации рыночных тенденций и отслеживания их направления. RSI используется для определения перекупа и перепродажи, WMA используется для определения ценовых тенденций, которые в сочетании могут эффективно отфильтровывать не связанные сигналы и повышать вероятность получения прибыли.
Стратегический принцип
Индекс RSI
RSI является одним из наиболее известных индикаторов сверхпокупок и сверхпродаж. Его формула:
\[RSI = 100 - \frac{100}{1+\frac{AvgGain}{AvgLoss}}\]
где AvgGain - это сумма цены закрытия, выше которой была цена закрытия, деленная на число дней в течение определенного периода, а AvgLoss - это сумма абсолютных цен цены закрытия, ниже которой была цена закрытия, деленная на число дней.
Эта стратегия устанавливает RSI-цикл на 20, как индикатор для определения тенденции. Когда RSI больше 60, он создает многоголовый сигнал, а когда RSI меньше 40, он создает пустой сигнал.
Весовая скользящая средняя WMA
WMA более активно регулирует недавние цены по сравнению с SMA. Формула расчета:
\[WMA = \frac{\sum_{i=1}^n w_i x_i}{\sum_{i=1}^n w_i}\]
w является весом, который увеличивается с увеличением i. w увеличивается по индексу. Формула весов, используемая в этой стратегии, выглядит так:
\[w = \begin{cases} 100/(4+(n-4)*1.3), & i <= 3 \ 1.3*w, & i > 3 \end{cases}\]
То есть последние 3 дня имеют одинаковый вес, а затем каждый день вперед вес увеличивается в 1,3 раза. Это может подчеркнуть влияние недавних цен.
Продолжительность WMA в этой стратегии составляет 20 дней.
Стратегические сигналы
Многоголовый сигнал: RSI > 60 и WMA 20 дней ROC < -1
Сигнал головы: RSI < 40 и WMA 20 дней ROC > 1
В нем WMA использует формулу для расчета 20-дневного ROC:
\[ROC = (WMA_{сегодня}/WMA_{20 дней назад} - 1) \times 100\]
Стратегические преимущества
- Используйте RSI, чтобы определить направление тренда и избежать потери средств в результате рыночных колебаний
- WMA оценивает основные тенденции в снижении уровня шума за последние годы
- Используется в сочетании с RSI и WMA ROC для эффективной фильтрации не связанных сигналов
- Использование нескольких ATR для отслеживания стопов позволяет гибко блокировать прибыль.
- Методы управления капиталом позволяют регулировать размер позиции в зависимости от прибыли и убытка, контролировать риск
Стратегический риск
- Неправильные параметры стратегии могут привести к частым сделкам, рекомендуется оптимизировать параметры
- Неправильная установка стоп-пойнтов может увеличить убытки
- В качестве стратегии отслеживания трендов, не подходит для рыночных сборов в условиях шока.
- Необходимо следить за изменениями в макросреде и при необходимости устранять риски.
Направление оптимизации стратегии
- Оптимистическая комбинация параметров для тестирования длины RSI, длины WMA и порога ROC
- Испытание различных методов управления капиталом, чтобы найти оптимальный вариант коррекции позиции
- Добавление других показателей для дальнейшей фильтрации сигналов
- Снижение риска потерь в сочетании с стратегией “стоп-лосс”
- Оптимизируйте стратегию сдерживания, чтобы максимально увеличить прибыль в тренде
Подвести итог
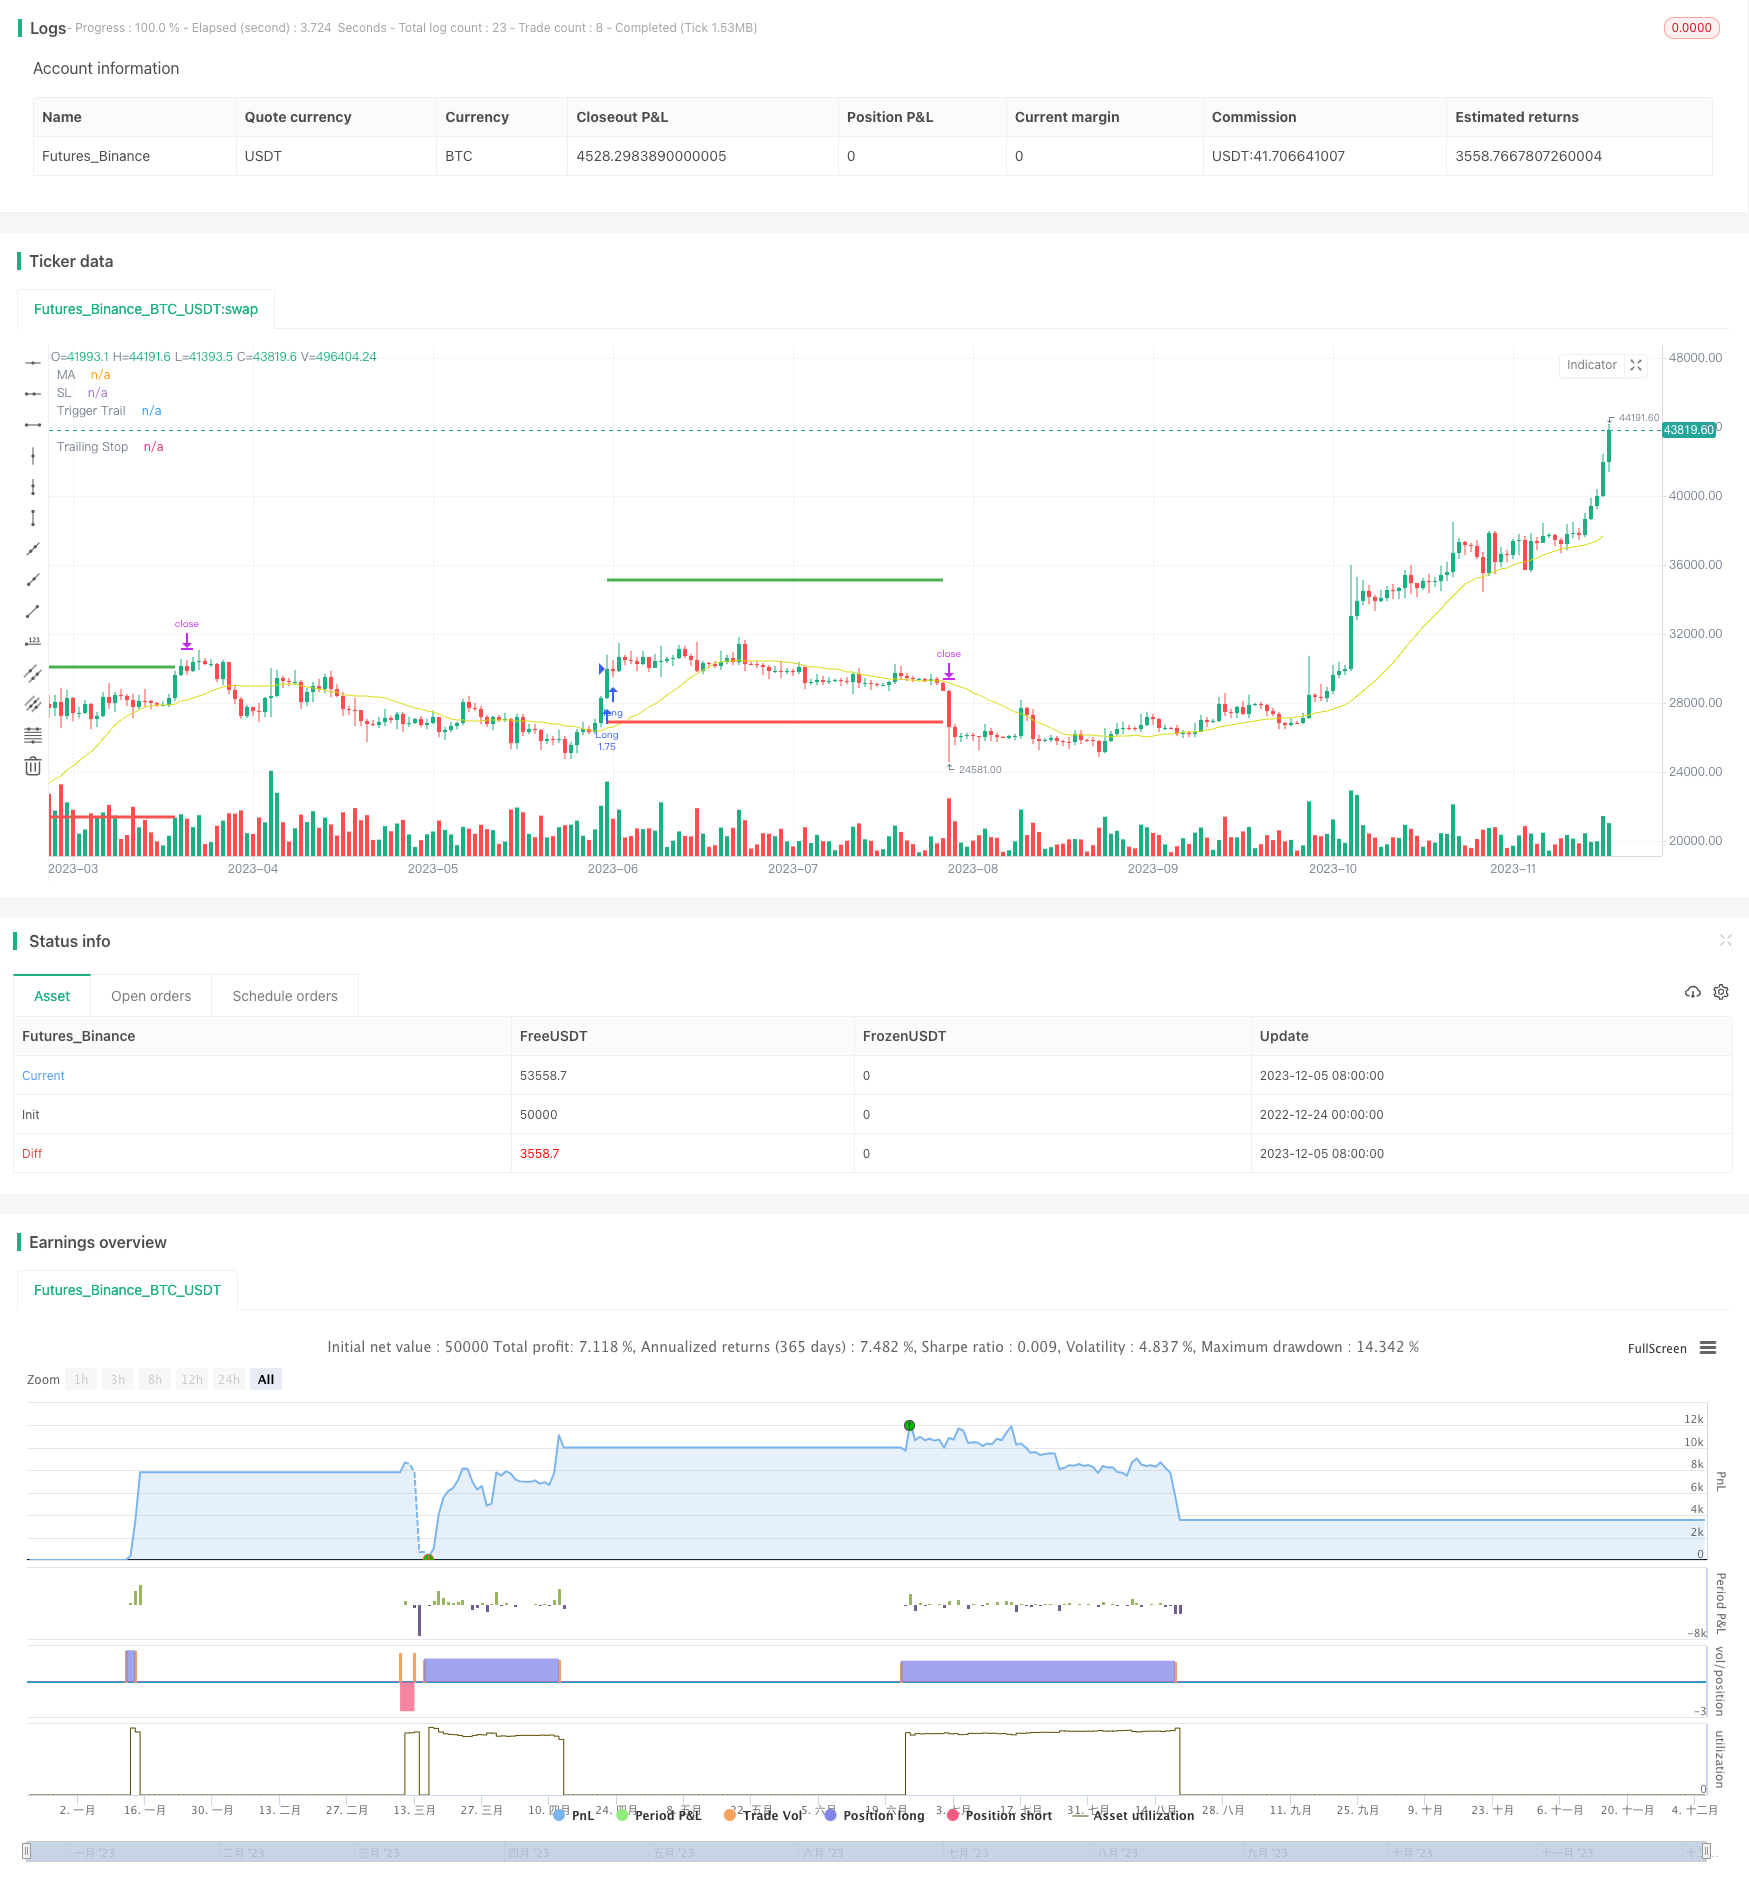
Эта стратегия использует RSI и WMA, чтобы определить направление тренда и получить прибыль от основных тенденций. Используя одновременно управление капиталом и стратегию контроля риска, она имеет некоторую реальную ценность. Однако параметры и механизм остановки должны постоянно тестироваться и оптимизироваться, чтобы получить лучший эффект.
/*backtest
start: 2022-12-24 00:00:00
end: 2023-12-06 05:20:00
period: 1d
basePeriod: 1h
exchanges: [{"eid":"Futures_Binance","currency":"BTC_USDT"}]
*/

// This source code is subject to the terms of the Mozilla Public License 2.0 at https://mozilla.org/MPL/2.0/
// © gsanson66


//This code is based on RSI and a backed weighted MA
//@version=5
strategy("RSI + MA BACKTESTING", overlay=true, initial_capital=1000, default_qty_type=strategy.fixed, commission_type=strategy.commission.percent, commission_value=0.18, slippage=3)


//------------------------TOOL TIPS---------------------------//

t1 = "Choice between a Standard MA (SMA) or a backed-weighted MA (RWMA) which permits to minimize the impact of short term reversal. Default is RWMA."
t2 = "Value of RSI to send a LONG or a SHORT signal. RSI above 60 is a LONG signal and RSI below 40 is a SHORT signal."
t3 = "Rate of Change Value of selected MA to send a LONG or a SHORT signal. By default : ROC MA below -1 is a LONG signal and ROC MA above 1 is a SHORT signal"
t4 = "Threshold value to trigger trailing Take Profit. This threshold is calculated as a multiple of the ATR (Average True Range)."
t5 = "Percentage value of trailing Take Profit. This Trailing TP follows the profit if it increases, remaining selected percentage below it, but stops if the profit decreases."
t6 = "Each gain or losse (relative to the previous reference) in an amount equal to this fixed ratio will change quantity of orders."
t7 = "The amount of money to be added to or subtracted from orders once the fixed ratio has been reached."


//------------------------FUNCTIONS---------------------------//

//@function which calculate a retro weighted moving average to minimize the impact of short term reversal
rwma(source, length) =>
    sum = 0.0
    denominator = 0.0
    weight = 0.0
    weight_x = 100/(4+(length-4)*1.30)
    weight_y = 1.30*weight_x
    for i=0 to length - 1
        if i <= 3
            weight := weight_x
        else
            weight := weight_y
        sum := sum + source[i] * weight
        denominator := denominator + weight
    rwma = sum/denominator

//@function which permits the user to choose a moving average type
ma(source, length, type) =>
    switch type
        "SMA" => ta.sma(source, length)
        "RWMA" => rwma(source, length)

//@function Displays text passed to `txt` when called.
debugLabel(txt, color) =>
    label.new(bar_index, high, text = txt, color=color, style = label.style_label_lower_right, textcolor = color.black, size = size.small)

//@function which looks if the close date of the current bar falls inside the date range
inBacktestPeriod(start, end) => (time >= start) and (time <= end)


//--------------------------------USER INPUTS-------------------------------//

//Technical parameters
rsiLengthInput = input.int(20, minval=1, title="RSI Length", group="RSI Settings")
maTypeInput = input.string("RWMA", title="MA Type", options=["SMA", "RWMA"], group="MA Settings", inline="1", tooltip=t1)
maLenghtInput = input.int(20, minval=1, title="MA Length", group="MA Settings", inline="1")
rsiLongSignalValue = input.int(60, minval=1, maxval=99, title="RSI Long Signal", group="Strategy parameters", inline="3")
rsiShortSignalValue = input.int(40, minval=1, maxval=99, title="RSI Short Signal", group="Strategy parameters", inline="3", tooltip=t2)
rocMovAverLongSignalValue = input.float(-1, maxval=0, title="ROC MA Long Signal", group="Strategy parameters", inline="4")
rocMovAverShortSignalValue = input.float(1, minval=0, title="ROC MA Short Signal", group="Strategy parameters", inline="4", tooltip=t3)
//TP Activation and Trailing TP
takeProfitActivationInput = input.float(5, minval=1.0, title="TP activation in multiple of ATR", group="Strategy parameters", tooltip=t4)
trailingStopInput = input.float(3, minval=0, title="Trailing TP in percentage", group="Strategy parameters", tooltip=t5)
//Money Management
fixedRatio = input.int(defval=400, minval=1, title="Fixed Ratio Value ($)", group="Money Management", tooltip=t6)
increasingOrderAmount = input.int(defval=200, minval=1, title="Increasing Order Amount ($)", group="Money Management", tooltip=t7)
//Backtesting period
startDate = input(title="Start Date", defval=timestamp("1 Jan 2018 00:00:00"), group="Backtesting Period")
endDate = input(title="End Date", defval=timestamp("1 July 2024 00:00:00"), group="Backtesting Period")


//------------------------------VARIABLES INITIALISATION-----------------------------//

float rsi = ta.rsi(close, rsiLengthInput)
float ma = ma(close, maLenghtInput, maTypeInput)
float roc_ma = ((ma/ma[maLenghtInput]) - 1)*100
float atr = ta.atr(20)
var float trailingStopOffset = na
var float trailingStopActivation = na
var float trailingStop = na
var float stopLoss = na
var bool long = na
var bool short = na
var bool bufferTrailingStopDrawing = na
float theoreticalStopPrice = na
bool inRange = na
equity = math.abs(strategy.equity - strategy.openprofit)
strategy.initial_capital = 50000
var float capital_ref = strategy.initial_capital
var float cashOrder = strategy.initial_capital * 0.95


//------------------------------CHECKING SOME CONDITIONS ON EACH SCRIPT EXECUTION-------------------------------//

//Checking if the date belong to the range
inRange := true

//Checking performances of the strategy
if equity > capital_ref + fixedRatio
    spread = (equity - capital_ref)/fixedRatio
    nb_level = int(spread)
    increasingOrder = nb_level * increasingOrderAmount
    cashOrder := cashOrder + increasingOrder
    capital_ref := capital_ref + nb_level*fixedRatio
if equity < capital_ref - fixedRatio
    spread = (capital_ref - equity)/fixedRatio
    nb_level = int(spread)
    decreasingOrder = nb_level * increasingOrderAmount
    cashOrder := cashOrder - decreasingOrder
    capital_ref := capital_ref - nb_level*fixedRatio

//Checking if we close all trades in case where we exit the backtesting period
if strategy.position_size!=0 and not inRange
    debugLabel("END OF BACKTESTING PERIOD : we close the trade", color=color.rgb(116, 116, 116))
    strategy.close_all()
    bufferTrailingStopDrawing := false
    stopLoss := na
    trailingStopActivation := na
    trailingStop := na
    short := false
    long := false


//------------------------------STOP LOSS AND TRAILING STOP ACTIVATION----------------------------//

// We handle the stop loss and trailing stop activation
if (low <= stopLoss or high >= trailingStopActivation) and long
    if high >= trailingStopActivation
        bufferTrailingStopDrawing := true
    else if low <= stopLoss
        long := false
    stopLoss := na
    trailingStopActivation := na
if (low <= trailingStopActivation or high >= stopLoss) and short
    if low <= trailingStopActivation
        bufferTrailingStopDrawing := true
    else if high >= stopLoss
        short := false
    stopLoss := na
    trailingStopActivation := na


//-------------------------------------TRAILING STOP--------------------------------------//

// If the traling stop is activated, we manage its plotting with the bufferTrailingStopDrawing
if bufferTrailingStopDrawing and long
    theoreticalStopPrice := high - trailingStopOffset * syminfo.mintick
    if na(trailingStop)
        trailingStop := theoreticalStopPrice
    else if theoreticalStopPrice > trailingStop
        trailingStop := theoreticalStopPrice
    else if low <= trailingStop
        trailingStop := na
        bufferTrailingStopDrawing := false
        long := false
if bufferTrailingStopDrawing and short
    theoreticalStopPrice := low + trailingStopOffset * syminfo.mintick
    if na(trailingStop)
        trailingStop := theoreticalStopPrice
    else if theoreticalStopPrice < trailingStop
        trailingStop := theoreticalStopPrice
    else if high >= trailingStop
        trailingStop := na
        bufferTrailingStopDrawing := false
        short := false


//---------------------------------LONG CONDITION--------------------------//

if rsi >= 60 and roc_ma <= rocMovAverLongSignalValue and inRange and not long
    if short
        bufferTrailingStopDrawing := false
        stopLoss := na
        trailingStopActivation := na
        trailingStop := na
        short := false
    trailingStopActivation := close + takeProfitActivationInput*atr
    trailingStopOffset := (trailingStopActivation * trailingStopInput/100) / syminfo.mintick
    stopLoss := close - 3*atr
    long := true
    qty = cashOrder/close
    strategy.entry("Long", strategy.long, qty)
    strategy.exit("Exit Long", "Long", stop = stopLoss, trail_price = trailingStopActivation,
                 trail_offset = trailingStopOffset)


//--------------------------------SHORT CONDITION-------------------------------//

if rsi <= 40 and roc_ma >= rocMovAverShortSignalValue and inRange and not short
    if long
        bufferTrailingStopDrawing := false
        stopLoss := na
        trailingStopActivation := na
        trailingStop := na
        long := false
    trailingStopActivation := close - takeProfitActivationInput*atr
    trailingStopOffset := (trailingStopActivation * trailingStopInput/100) / syminfo.mintick
    stopLoss := close + 3*atr
    short := true
    qty = cashOrder/close
    strategy.entry("Short", strategy.short, qty)
    strategy.exit("Exit Short", "Short", stop = stopLoss, trail_price = trailingStopActivation,
                 trail_offset = trailingStopOffset)


//--------------------------------PLOTTING ELEMENT---------------------------------//

// Plotting of element in the graph
plotchar(rsi, "RSI", "", location.top, color.rgb(0, 214, 243))
plot(ma, "MA", color.rgb(219, 219, 18))
plotchar(roc_ma, "ROC MA", "", location.top, color=color.orange)
// Visualizer trailing stop and stop loss movement
plot(stopLoss, "SL", color.red, 3, plot.style_linebr)
plot(trailingStopActivation, "Trigger Trail", color.green, 3, plot.style_linebr)
plot(trailingStop, "Trailing Stop",  color.blue, 3, plot.style_linebr)