Стратегия следования за трендом на основе осциллирующего канала с несколькими таймфреймами
[trans]
Обзор
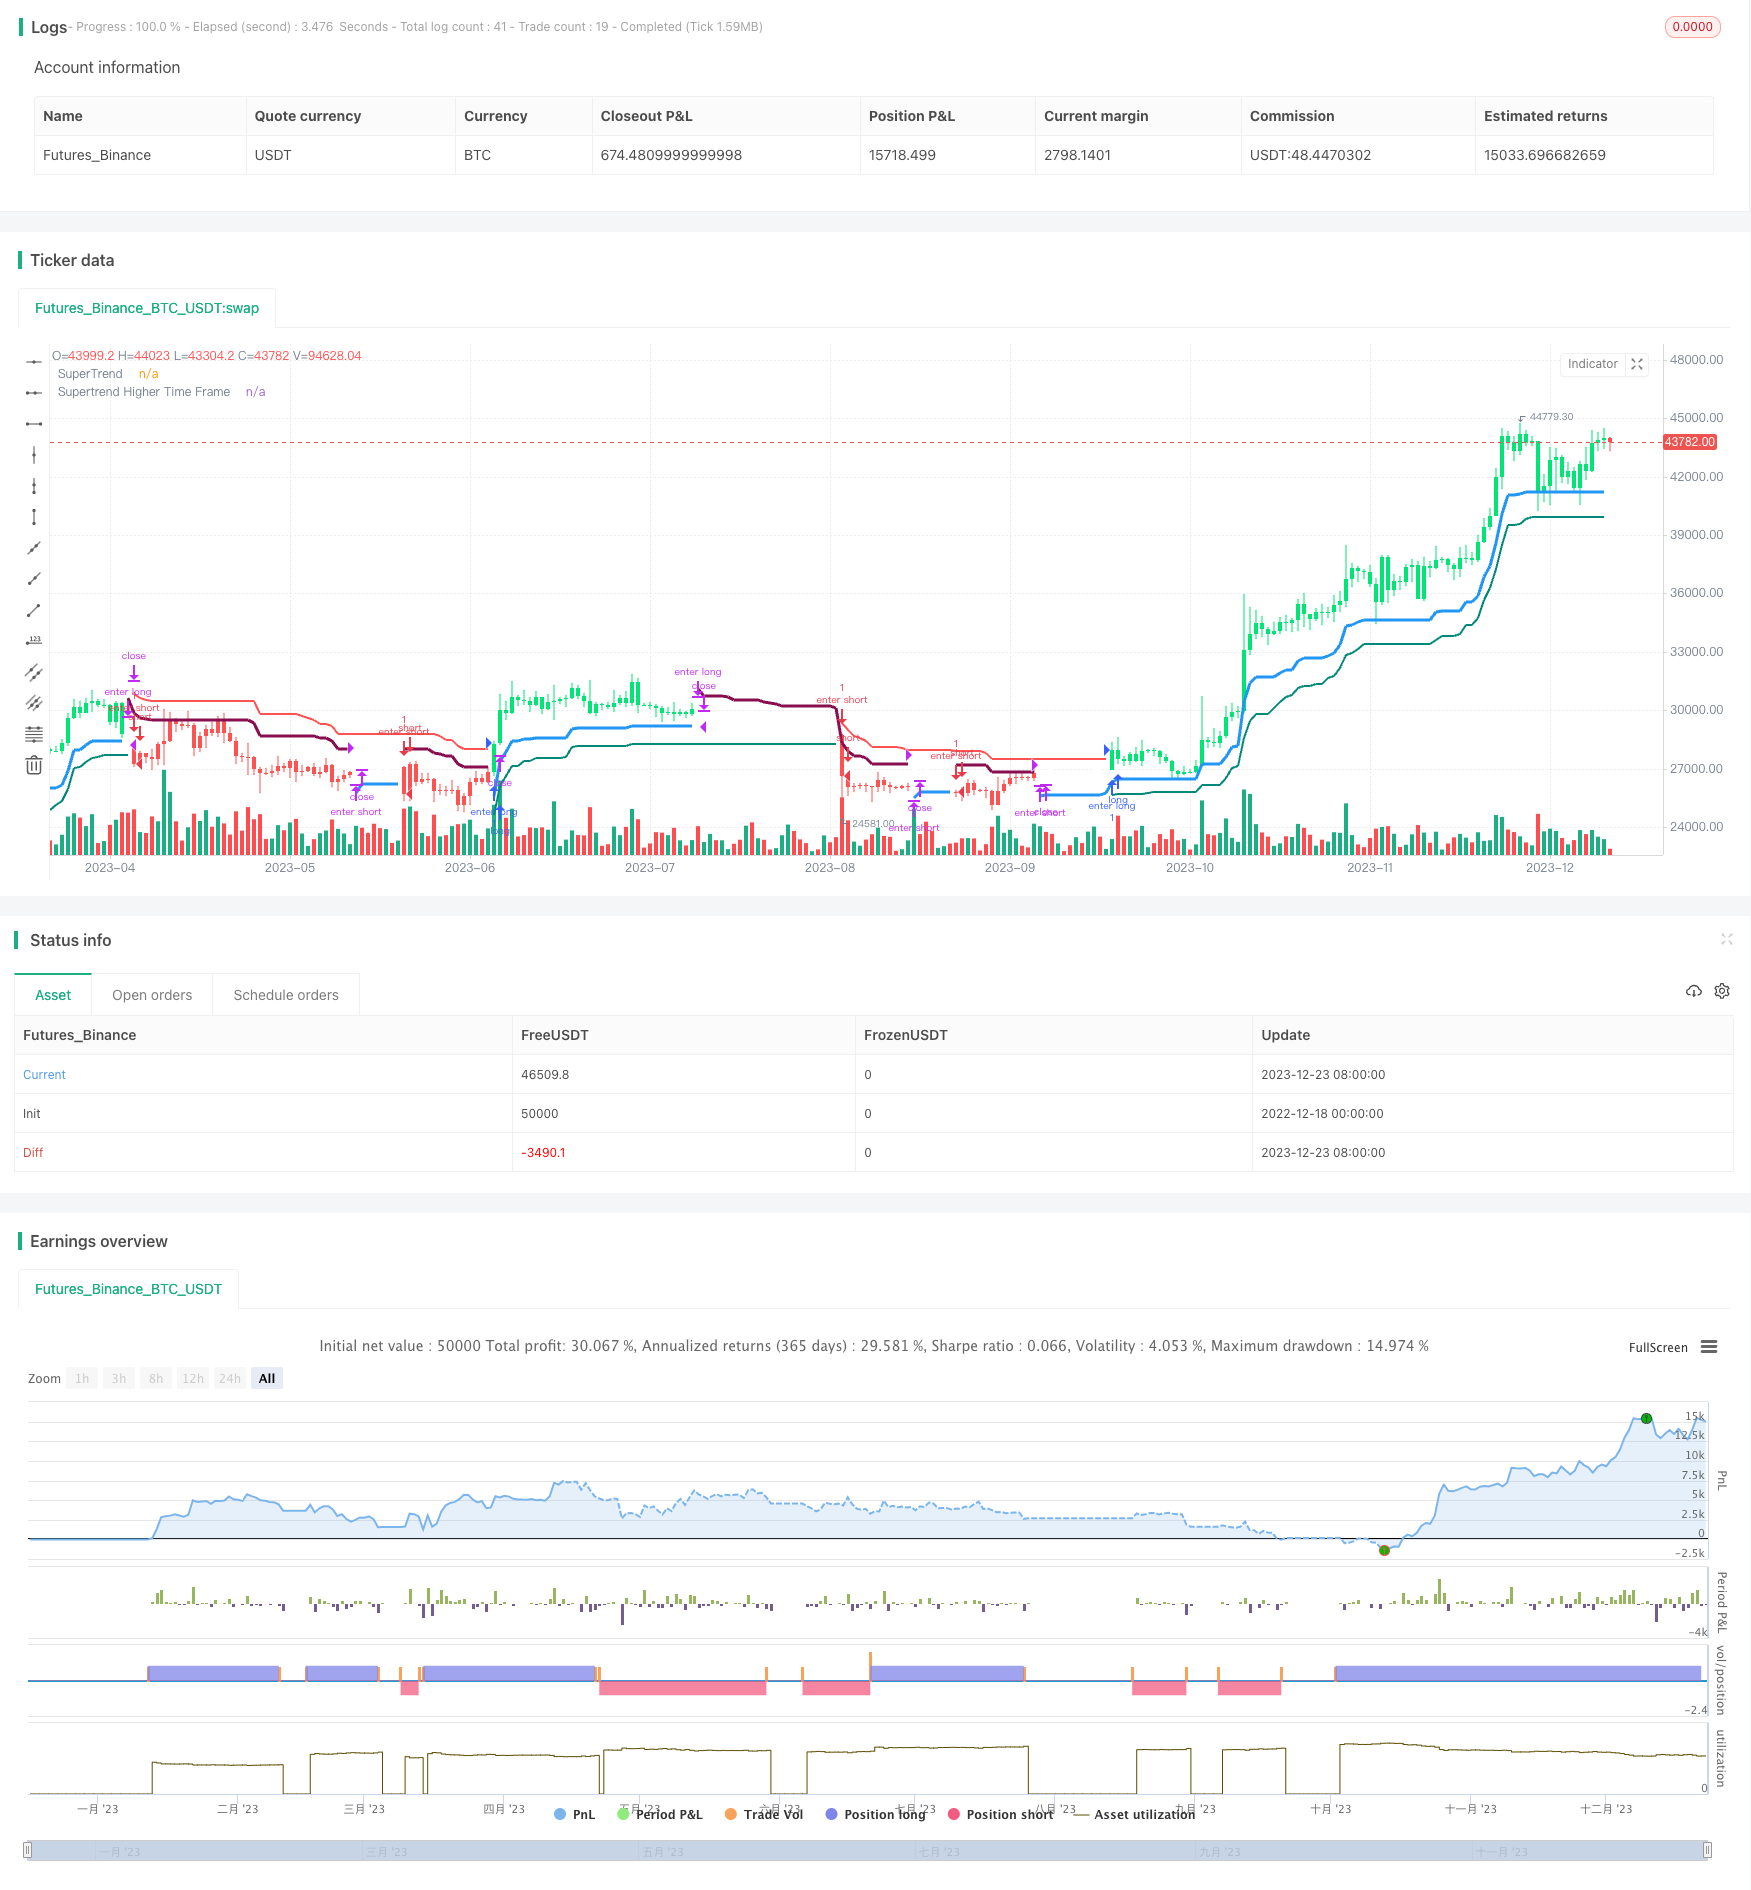
Стратегия основана на индикаторе супертенденции, в сочетании с анализом рыночных тенденций в нескольких временных рамках, используя метод шок-каналов для определения времени входа.
Стратегический принцип
- Использование традиционных супертенденционных индикаторов для определения направления тенденции
- Увеличение супертенденций высоких временных рамок, чтобы обеспечить наличие тенденций высоких временных рамок
- Судя по показателям супертенденции в двух временных рамках, можно определить направление общей тенденции
- Конкретные моменты входа определяются в зависимости от того, как цены прорываются в трейлерный канал.
Анализ преимуществ
- Анализ многократных временных рамок позволяет более надежно оценивать тенденции
- Сочетание высоких и низких временных рамок, гарантирующих одновременное появление больших тенденций и краткосрочных возможностей
- Штормовые каналы устанавливают точки остановки, помогают контролировать риски
Риски и решения
- Супертенденции, которые сами по себе имеют определенную задержку, могут пропустить переходный момент.
- Оптимизация параметров или в сочетании с другими показателями позволяет получить информацию о переходе на тренд и снизить риск отставания
Направление оптимизации
- Оптимизация параметров супертенденции, снижение отставания
- Дополнительные фильтры для определения тенденций
- Испытание и выбор наиболее подходящего способа остановки
Подвести итог
Стратегия объединяет многократный анализ временных рамок и индикаторы отслеживания тенденций, чтобы понять основные тенденции и одновременно найти конкретные моменты входа. Благодаря постоянной оптимизации, ожидается стабильная и долгосрочная прибыль.
||
Overview
This strategy is based on the Supertrend indicator, combined with multiple timeframe market trend analysis, and adopts the oscillation channel method to identify entry opportunities.
Strategy Principle
- Use the traditional Supertrend indicator to determine the trend direction
- Add Supertrend of higher timeframe to ensure there is a trend in higher timeframe too
- Determine the overall trend direction based on the Supertrend indicators of two timeframes
- Identify specific entry opportunities based on the price breakout of the upper and lower rails of the oscillation channel
Advantage Analysis
- Multi-timeframe analysis makes trend judgment more reliable
- Combining high and low timeframes ensures catching the major trend while being able to capture short-term opportunities
- The oscillation channel setting stops loss points which helps risk control
Risks and Solutions
- The Supertrend itself has some lagging phenomenon, which may miss trend reversal points
- The lagging risk can be reduced by optimizing parameters or incorporating other indicators to assist in identifying trend changes
Optimization Directions
- Optimize Supertrend parameters to reduce lagging
- Add trend filtering indicators to ensure catching the major trend more accurately
- Test and select more appropriate stop loss methods
Summary
This strategy integrates multi-timeframe analysis and trend tracking indicators to grasp the major trend while seeking specific entry opportunities. With continuous optimization, it is expected to achieve long-term steady excess returns.
/*backtest
start: 2022-12-18 00:00:00
end: 2023-12-24 00:00:00
period: 1d
basePeriod: 1h
exchanges: [{"eid":"Futures_Binance","currency":"BTC_USDT"}]
*/

// This source code is subject to the terms of the Mozilla Public License 2.0 at https://mozilla.org/MPL/2.0/
// © ramki_simple
// Thanks to LonesomeTheBlue for the original code
//@version=4
strategy("Multi Supertrend with no-repaint HTF option strategy", overlay = true, shorttitle='Multi Supertrend')
//auto higher time frame
HTFAuto = timeframe.period == '1' ? '5' :
  timeframe.period == '3' ? '15' :
  timeframe.period == '5' ? '15' :
  timeframe.period == '15' ? '60' :
  timeframe.period == '30' ? '60' :
  timeframe.period == '45' ? '60' :
  timeframe.period == '60' ? '240' :
  timeframe.period == '120' ? '240' :
  timeframe.period == '180' ? '240' :
  timeframe.period == '240' ? 'D' :
  timeframe.period == 'D' ? 'W' :
  '5W'
HTFSelection = input(title='Select HTF Automatically for Additional Supertrend', type=input.bool, defval=false)
HTFUserSel = input(title='Select Higher Timeframe for Additional Supertrend',type=input.resolution, defval ='')
HTF = HTFSelection ? HTFAuto : HTFUserSel


Mult1 = input(title='Multiplier for Default Supertrend', defval=3.0, minval = 0, maxval = 10)
Period1 = input(title='Period for Default Supertrend', defval=10, minval = 1, maxval = 100)
Mult2 = input(title='Multiplier for Additional Supertrend', defval=2.0, minval = 0, maxval = 10)
Period2 = input(title='Period for Additional Supertrend', defval=14, minval = 1, maxval = 100)

chbarcol = input(true, title = "Change Bar Color")

[Trailings, Trend] = supertrend(Mult1, Period1)

linecolor = Trend == -1 and Trend[1] == -1 ? color.teal :
   Trend == 1 and Trend[1] == 1 ? color.red :
   color.new(color.white, 100)
plot(Trailings, color = linecolor,  linewidth = 2,title = "SuperTrend")

f_Security(_symbol, _res, _src) => security(_symbol, _res, _src[1], lookahead = barmerge.lookahead_on)

nonVectorSupertrend(Mult, Period) =>
    [Trail_, Trend_] = supertrend(Mult, Period)
    Trail_*Trend_


[TrailingslHtf, TrendHtf] = supertrend(Mult2, Period2)

if HTF != timeframe.period and HTF != ''
    CompositeTrailHtf = f_Security(syminfo.tickerid, HTF,nonVectorSupertrend(Mult2, Period2) )
    TrailingslHtf := abs(CompositeTrailHtf)
    TrendHtf := CompositeTrailHtf > 0 ? 1 : -1


linecolorHtf = TrendHtf == -1 and TrendHtf[1] == -1 ? color.blue :
   TrendHtf == 1 and TrendHtf[1] == 1 ? color.maroon :
   color.new(color.white, 100)
plot(TrailingslHtf, color = linecolorHtf, linewidth = 3, title = "Supertrend Higher Time Frame")

barcolor_ = Trend == -1 and TrendHtf == -1 ? color.lime :
   Trend == 1 and TrendHtf == 1 ? color.red :
   color.white
barcolor(color = chbarcol ? barcolor_ : na)

vwapfilter = input(false)

Long = Trend == -1 and TrendHtf == -1
Short = Trend == 1 and TrendHtf == 1
strategy.entry("enter long", true, 1, when = Long and not Long[1] and (vwapfilter and close > vwap or not vwapfilter))
strategy.entry("enter short", false, 1, when = Short and not Short[1] and (vwapfilter and close < vwap or not vwapfilter))
strategy.close("enter long", when = Long[1] and not Long)
strategy.close("enter short", when = Short[1] and not Short)