Стратегия торговли биткоинами, основанная на количественных показателях
Обзор
Эта стратегия использует множество количественных показателей для определения времени покупки и продажи биткоина, для осуществления автоматизированных сделок. В основном это включает в себя индикаторы Хелла (Hull), относительно сильный индекс (RSI), Блин-пояса (BB) и транзакционный количественный осциллятор (VO).
Стратегический принцип
Используйте модифицированные Hull Moving Averages для определения основного направления тренда рынка, в сочетании с помощью Brin Belt для определения прорыва в точке покупки и продажи.
RSI в сочетании с самостоятельным адаптацией к колебаниям определяет зоны перепродажи и перекупа, посылает торговый сигнал. При этом устанавливаются два параметра для проверки дублирующего сигнала.
Оцифровщик объемов сделок определяет направление покупок и продаж, чтобы избежать ложных прорывов.
Предоставление стоп-стоп-позиции в соответствии с параметрами соотношения стоп-стоп/стоп-приз, для управления рисками.
Анализ преимуществ
Хелл-кривая позволяет быстрее улавливать смены тенденций, а Брин-панель помогает сократить количество ложных сигналов.
Оптимизация параметров RSI и проверка дублированных сигналов, повышает надежность.
Ослабитель объемов сделок объединяет трендовые и индикаторные сигналы, чтобы избежать неточных сделок.
Предварительно установленный метод остановки убытков позволяет автоматически контролировать отдельные убытки и эффективно контролировать общий риск.
Анализ рисков
Неправильная настройка параметров может привести к слишком высокой частоте торгов или неправильному эффекту сигнала.
При резких колебаниях рынка в результате внезапных событий, стоп-лосс может быть преодолен, что приводит к большим потерям.
Параметры должны быть перепроверены и оптимизированы при обмене валюты на другую.
В случае отсутствия данных об объеме сделок, он будет недействителен.
Направление оптимизации
Проведите дополнительные комбинационные тесты на RSI, чтобы найти оптимальные параметры.
Попробуйте использовать другие индикаторы, такие как MACD, KD и другие, в сочетании с RSI, чтобы повысить точность сигнала.
Добавление модуля прогнозирования моделей в сочетании с машинным обучением для определения направления рынка.
Тест на эффективность параметров других торговых сортов.
Оптимизация алгоритмов стоп-лосс для максимизации прибыли.
Подвести итог
Эта стратегия использует множество количественных технических показателей для определения времени покупки и продажи. Автоматизированная торговля биткойном осуществляется с помощью методов оптимизации параметров, контроля риска и т. Д.
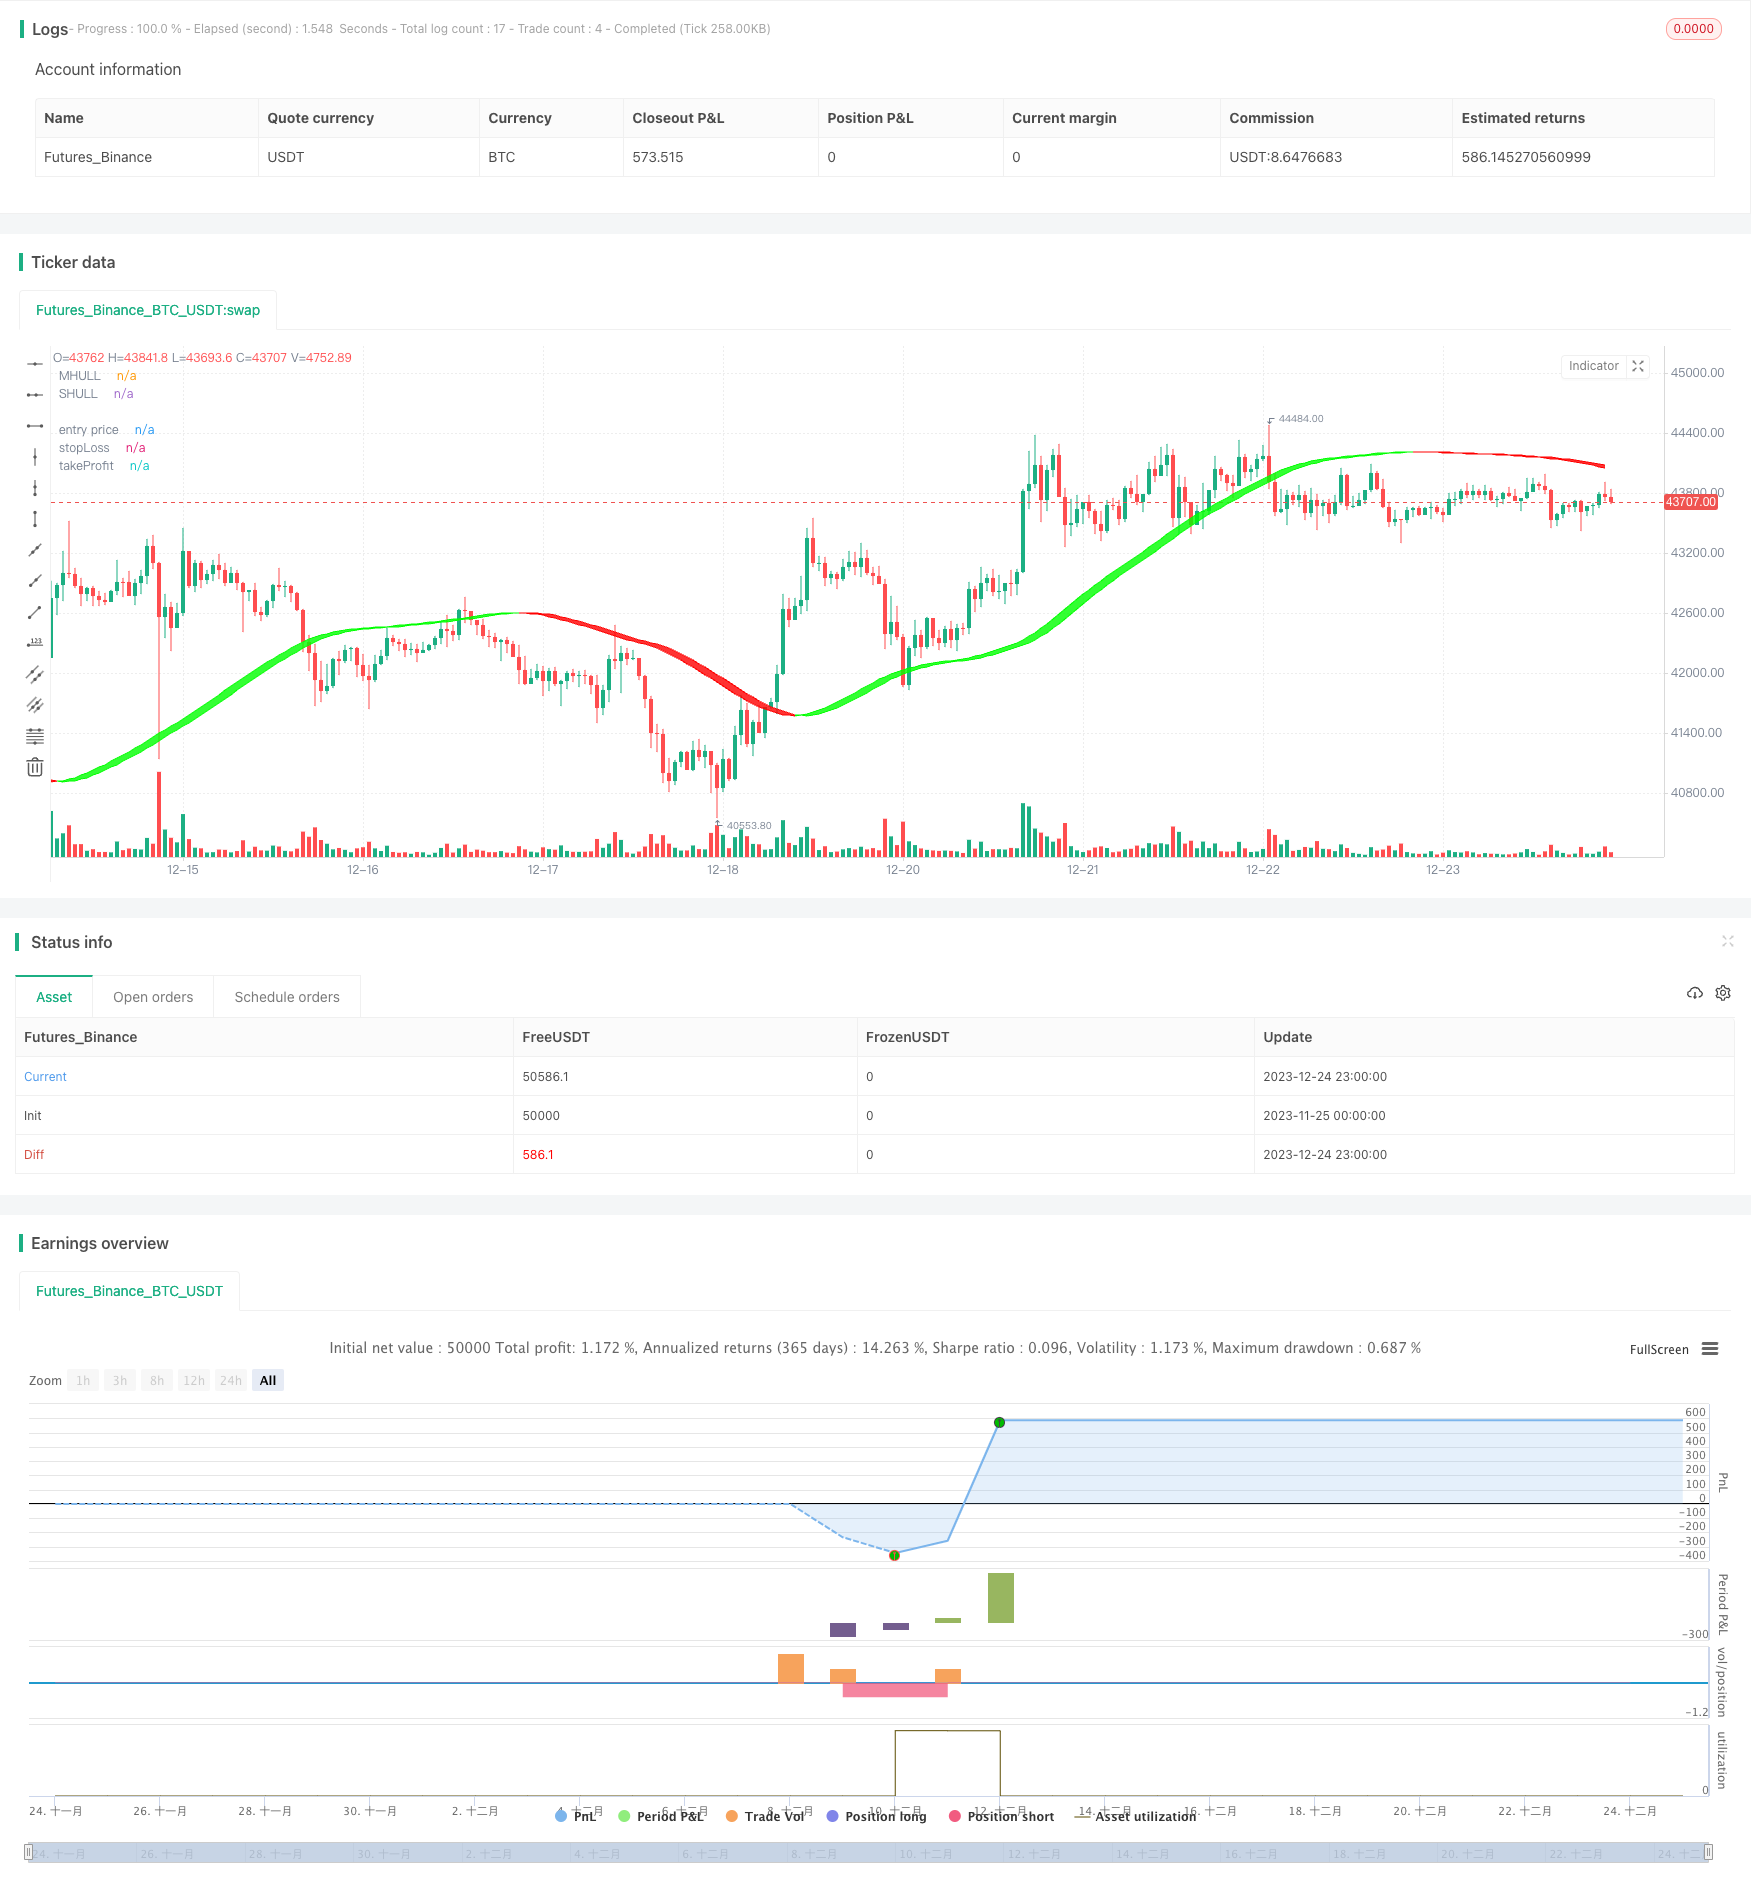
/*backtest
start: 2023-11-25 00:00:00
end: 2023-12-25 00:00:00
period: 1h
basePeriod: 15m
exchanges: [{"eid":"Futures_Binance","currency":"BTC_USDT"}]
*/


// © maxencetajet

//@version=5
strategy("Strategy Crypto", overlay=true, initial_capital=1000, default_qty_type=strategy.fixed, default_qty_value=0.5, slippage=25)

src1 = input.source(close, title="Source")
target_stop_ratio = input.float(title='Risk/Reward', defval=1.5, minval=0.5, maxval=100)

startDate = input.int(title='Start Date', defval=1, minval=1, maxval=31, group="beginning Backtest")
startMonth = input.int(title='Start Month', defval=5, minval=1, maxval=12, group="beginning Backtest")
startYear = input.int(title='Start Year', defval=2022, minval=2000, maxval=2100, group="beginning Backtest")

inDateRange = time >= timestamp(syminfo.timezone, startYear, startMonth, startDate, 0, 0)

swingHighV = input.int(7, title="Swing High", group="number of past candles")
swingLowV = input.int(7, title="Swing Low", group="number of past candles")

//Hull Suite

modeSwitch = input.string("Hma", title="Hull Variation", options=["Hma", "Thma", "Ehma"], group="Hull Suite")
length = input(60, title="Length", group="Hull Suite")
lengthMult = input(3, title="Length multiplier", group="Hull Suite")

HMA(_src1, _length) =>
    ta.wma(2 * ta.wma(_src1, _length / 2) - ta.wma(_src1, _length), math.round(math.sqrt(_length)))

EHMA(_src1, _length) =>
    ta.ema(2 * ta.ema(_src1, _length / 2) - ta.ema(_src1, _length), math.round(math.sqrt(_length)))

THMA(_src1, _length) =>
    ta.wma(ta.wma(_src1, _length / 3) * 3 - ta.wma(_src1, _length / 2) - ta.wma(_src1, _length), _length)

Mode(modeSwitch, src1, len) =>
    modeSwitch == 'Hma' ? HMA(src1, len) : modeSwitch == 'Ehma' ? EHMA(src1, len) : modeSwitch == 'Thma' ? THMA(src1, len / 2) : na

_hull = Mode(modeSwitch, src1, int(length * lengthMult))
HULL = _hull
MHULL = HULL[0]
SHULL = HULL[2]

hullColor = HULL > HULL[2] ? #00ff00 : #ff0000

Fi1 = plot(MHULL, title='MHULL', color=hullColor, linewidth=1, transp=50)
Fi2 = plot(SHULL, title='SHULL', color=hullColor, linewidth=1, transp=50)
fill(Fi1, Fi2, title='Band Filler', color=hullColor, transp=40)

//QQE MOD

RSI_Period = input(6, title='RSI Length', group="QQE MOD")
SF = input(5, title='RSI Smoothing', group="QQE MOD")
QQE = input(3, title='Fast QQE Factor', group="QQE MOD")
ThreshHold = input(3, title='Thresh-hold', group="QQE MOD")

src = input(close, title='RSI Source', group="QQE MOD")

Wilders_Period = RSI_Period * 2 - 1

Rsi = ta.rsi(src, RSI_Period)
RsiMa = ta.ema(Rsi, SF)
AtrRsi = math.abs(RsiMa[1] - RsiMa)
MaAtrRsi = ta.ema(AtrRsi, Wilders_Period)
dar = ta.ema(MaAtrRsi, Wilders_Period) * QQE

longband = 0.0
shortband = 0.0
trend = 0

DeltaFastAtrRsi = dar
RSIndex = RsiMa
newshortband = RSIndex + DeltaFastAtrRsi
newlongband = RSIndex - DeltaFastAtrRsi
longband := RSIndex[1] > longband[1] and RSIndex > longband[1] ? math.max(longband[1], newlongband) : newlongband
shortband := RSIndex[1] < shortband[1] and RSIndex < shortband[1] ? math.min(shortband[1], newshortband) : newshortband
cross_1 = ta.cross(longband[1], RSIndex)
trend := ta.cross(RSIndex, shortband[1]) ? 1 : cross_1 ? -1 : nz(trend[1], 1)
FastAtrRsiTL = trend == 1 ? longband : shortband

length1 = input.int(50, minval=1, title='Bollinger Length', group="QQE MOD")
mult = input.float(0.35, minval=0.001, maxval=5, step=0.1, title='BB Multiplier', group="QQE MOD")
basis = ta.sma(FastAtrRsiTL - 50, length1)
dev = mult * ta.stdev(FastAtrRsiTL - 50, length1)
upper = basis + dev
lower = basis - dev
color_bar = RsiMa - 50 > upper ? #00c3ff : RsiMa - 50 < lower ? #ff0062 : color.gray

QQEzlong = 0
QQEzlong := nz(QQEzlong[1])
QQEzshort = 0
QQEzshort := nz(QQEzshort[1])
QQEzlong := RSIndex >= 50 ? QQEzlong + 1 : 0
QQEzshort := RSIndex < 50 ? QQEzshort + 1 : 0

RSI_Period2 = input(6, title='RSI Length', group="QQE MOD")
SF2 = input(5, title='RSI Smoothing', group="QQE MOD")
QQE2 = input(1.61, title='Fast QQE2 Factor', group="QQE MOD")
ThreshHold2 = input(3, title='Thresh-hold', group="QQE MOD")

src2 = input(close, title='RSI Source', group="QQE MOD")

Wilders_Period2 = RSI_Period2 * 2 - 1

Rsi2 = ta.rsi(src2, RSI_Period2)
RsiMa2 = ta.ema(Rsi2, SF2)
AtrRsi2 = math.abs(RsiMa2[1] - RsiMa2)
MaAtrRsi2 = ta.ema(AtrRsi2, Wilders_Period2)
dar2 = ta.ema(MaAtrRsi2, Wilders_Period2) * QQE2
longband2 = 0.0
shortband2 = 0.0
trend2 = 0

DeltaFastAtrRsi2 = dar2
RSIndex2 = RsiMa2
newshortband2 = RSIndex2 + DeltaFastAtrRsi2
newlongband2 = RSIndex2 - DeltaFastAtrRsi2
longband2 := RSIndex2[1] > longband2[1] and RSIndex2 > longband2[1] ? math.max(longband2[1], newlongband2) : newlongband2
shortband2 := RSIndex2[1] < shortband2[1] and RSIndex2 < shortband2[1] ? math.min(shortband2[1], newshortband2) : newshortband2
cross_2 = ta.cross(longband2[1], RSIndex2)
trend2 := ta.cross(RSIndex2, shortband2[1]) ? 1 : cross_2 ? -1 : nz(trend2[1], 1)
FastAtrRsi2TL = trend2 == 1 ? longband2 : shortband2

QQE2zlong = 0
QQE2zlong := nz(QQE2zlong[1])
QQE2zshort = 0
QQE2zshort := nz(QQE2zshort[1])
QQE2zlong := RSIndex2 >= 50 ? QQE2zlong + 1 : 0
QQE2zshort := RSIndex2 < 50 ? QQE2zshort + 1 : 0

hcolor2 = RsiMa2 - 50 > ThreshHold2 ? color.silver : RsiMa2 - 50 < 0 - ThreshHold2 ? color.silver : na

Greenbar1 = RsiMa2 - 50 > ThreshHold2
Greenbar2 = RsiMa - 50 > upper

Redbar1 = RsiMa2 - 50 < 0 - ThreshHold2
Redbar2 = RsiMa - 50 < lower

//Volume Oscillator

var cumVol = 0.
cumVol += nz(volume)
if barstate.islast and cumVol == 0
    runtime.error("No volume is provided by the data vendor.")
shortlen = input.int(5, minval=1, title = "Short Length", group="Volume Oscillator")
longlen = input.int(10, minval=1, title = "Long Length", group="Volume Oscillator")
short = ta.ema(volume, shortlen)
long = ta.ema(volume, longlen)
osc = 100 * (short - long) / long

//strategy

enterLong   =  '    {  "message_type": "bot",  "bot_id": 4635591,  "email_token": "25byourtefcodeuufyd2-43314-ab98-bjorg224",  "delay_seconds": 1}  ' //start long deal

ExitLong    =  '    {  "message_type": "bot",  "bot_id": 4635591,  "email_token": "25byourtefcodeuufyd2-43314-ab98-bjorg224",  "delay_seconds": 0,  "action": "close_at_market_price"}  ' // close long deal market

enterShort  =  '    {  "message_type": "bot",  "bot_id": 4635690,  "email_token": "25byourtefcodeuufyd2-43314-ab98-bjorg224",  "delay_seconds": 1}  ' // start short deal

ExitShort   =  '    {  "message_type": "bot",  "bot_id": 4635690,  "email_token": "25byourtefcodeuufyd2-43314-ab98-bjorg224",  "delay_seconds": 0,  "action": "close_at_market_price"}  ' // close short deal market

longcondition = close > MHULL and HULL > HULL[2] and osc > 0 and Greenbar1 and Greenbar2 and not Greenbar1[1] and not Greenbar2[1]
shortcondition = close < SHULL and HULL < HULL[2] and osc > 0 and Redbar1 and Redbar2 and not Redbar1[1] and not Redbar2[1]

float risk_long = na
float risk_short = na
float stopLoss = na
float takeProfit = na
float entry_price = na

risk_long := risk_long[1]
risk_short := risk_short[1]

swingHigh = ta.highest(high, swingHighV)
swingLow = ta.lowest(low, swingLowV)

if strategy.position_size == 0 and longcondition and inDateRange
    risk_long := (close - swingLow) / close
    strategy.entry("long", strategy.long, comment="Buy", alert_message=enterLong)

if strategy.position_size == 0 and shortcondition and inDateRange
    risk_short := (swingHigh - close) / close
    strategy.entry("short", strategy.short, comment="Sell", alert_message=enterShort)

if strategy.position_size > 0

    stopLoss := strategy.position_avg_price * (1 - risk_long)
    takeProfit := strategy.position_avg_price * (1 + target_stop_ratio * risk_long)
    entry_price := strategy.position_avg_price
    strategy.exit("long exit", "long", stop = stopLoss, limit = takeProfit, alert_message=ExitLong)

if strategy.position_size < 0

    stopLoss := strategy.position_avg_price * (1 + risk_short)
    takeProfit := strategy.position_avg_price * (1 - target_stop_ratio * risk_short)
    entry_price := strategy.position_avg_price
    strategy.exit("short exit", "short", stop = stopLoss, limit = takeProfit, alert_message=ExitShort)

p_ep = plot(entry_price, color=color.new(color.white, 0), linewidth=2, style=plot.style_linebr, title='entry price')
p_sl = plot(stopLoss, color=color.new(color.red, 0), linewidth=2, style=plot.style_linebr, title='stopLoss')
p_tp = plot(takeProfit, color=color.new(color.green, 0), linewidth=2, style=plot.style_linebr, title='takeProfit')
fill(p_sl, p_ep, color.new(color.red, transp=85))
fill(p_tp, p_ep, color.new(color.green, transp=85))