Стратегия торговли Momentum Oscillator Stochastic RSI
Обзор
В данной статье в основном рассматривается стратегия торговли динамическими колебаниями, основанная на индикаторе стохастического RSI. Эта стратегия использует более короткий цикл (например, 30 минут) технических показателей, чтобы принимать торговые решения в зависимости от того, входит ли стохастический RSI в зону перекупа или перепродажи. По сравнению с другими динамическими стратегиями, эта стратегия объединяет преимущества обоих показателей RSI и стохастического одновременно, чтобы более точно улавливать краткосрочные колебания рынка.
Стратегический принцип
Ключевым показателем стратегии является стохастический RSI.
Стохастический RSI = (RSI - низкий RSI) / (высокий RSI - низкий RSI) * 100
RSI рассчитывается с помощью параметров lengthRSI ((по умолчанию 12), Stochastic RSI с помощью параметров lengthStoch ((по умолчанию 12)).
Когда стохастический RSI выше зоны фиолетового наполнения, это является зоной сверхпокупа, в которой делается пробел; когда стохастический RSI ниже зоны фиолетового наполнения, это является зоной сверхпродажи, в которой делается больше.
Кроме того, в стратегии также установлены условия равнолинейной фильтрации. Только когда быстрая EMA выше, чем медленная EMA, можно открыть позицию больше; только когда быстрая EMA ниже, чем медленная EMA, можно открыть позицию меньше. Это позволяет избежать обратной торговли.
Стратегические преимущества
По сравнению с одиночной стратегией RSI, эта стратегия в сочетании со стохастическим индикатором позволяет более четко идентифицировать зоны перекупа и перепродажи, что повышает надежность сигнала.
В отличие от одной стохастической стратегии, эта стратегия использует RSI в качестве источника входных данных для стохастической, что позволяет отфильтровать часть шума, что делает сигнал более надежным.
Установка условий равномерной фильтрации позволяет эффективно избежать создания противоположных позиций и, таким образом, уменьшить ненужные потери.
Установка задержки времени удержания позиции позволяет избежать остановки в результате ложного прорыва.
Стратегический риск
Эта стратегия использует в основном краткосрочные показатели, поэтому она подходит только для операций на коротких линиях, а может оказаться неэффективной для операций на длинных.
Стохастический RSI сам по себе имеет определенную задержку и может пропустить сигнал после резких краткосрочных ценовых изменений.
В шокирующих ситуациях Stochastic RSI приводит к многочисленным пересечениям зоны перепродажи, что может привести к переторгу, что увеличивает стоимость торгов.
Направление оптимизации стратегии
Можно тестировать различные комбинации параметров для дальнейшей оптимизации длины, K-значений и D-значений стохастического RSI.
Можно тестировать различные параметры длины RSI, чтобы найти более подходящую длину цикла RSI.
Можно попробовать комбинировать его с другими индикаторами, чтобы повысить точность сигналов. Например, MACD, Bollinger Bands и т. д.
Можно тестировать различные параметры задержки времени удержания позиции, чтобы найти более подходящее время выхода на поле.
Подвести итог
В этой статье подробно рассматриваются принципы построения, преимущества, риски и идеи оптимизации динамической стратегии, основанной на стохастическом RSI. По сравнению со стратегией с одним показателем, эта стратегия использует преимущества RSI и стохастического одновременно, чтобы более четко и надежно идентифицировать краткосрочные сверхпокупки и сверхпродажи на рынке, чтобы совершать обратную торговлю.
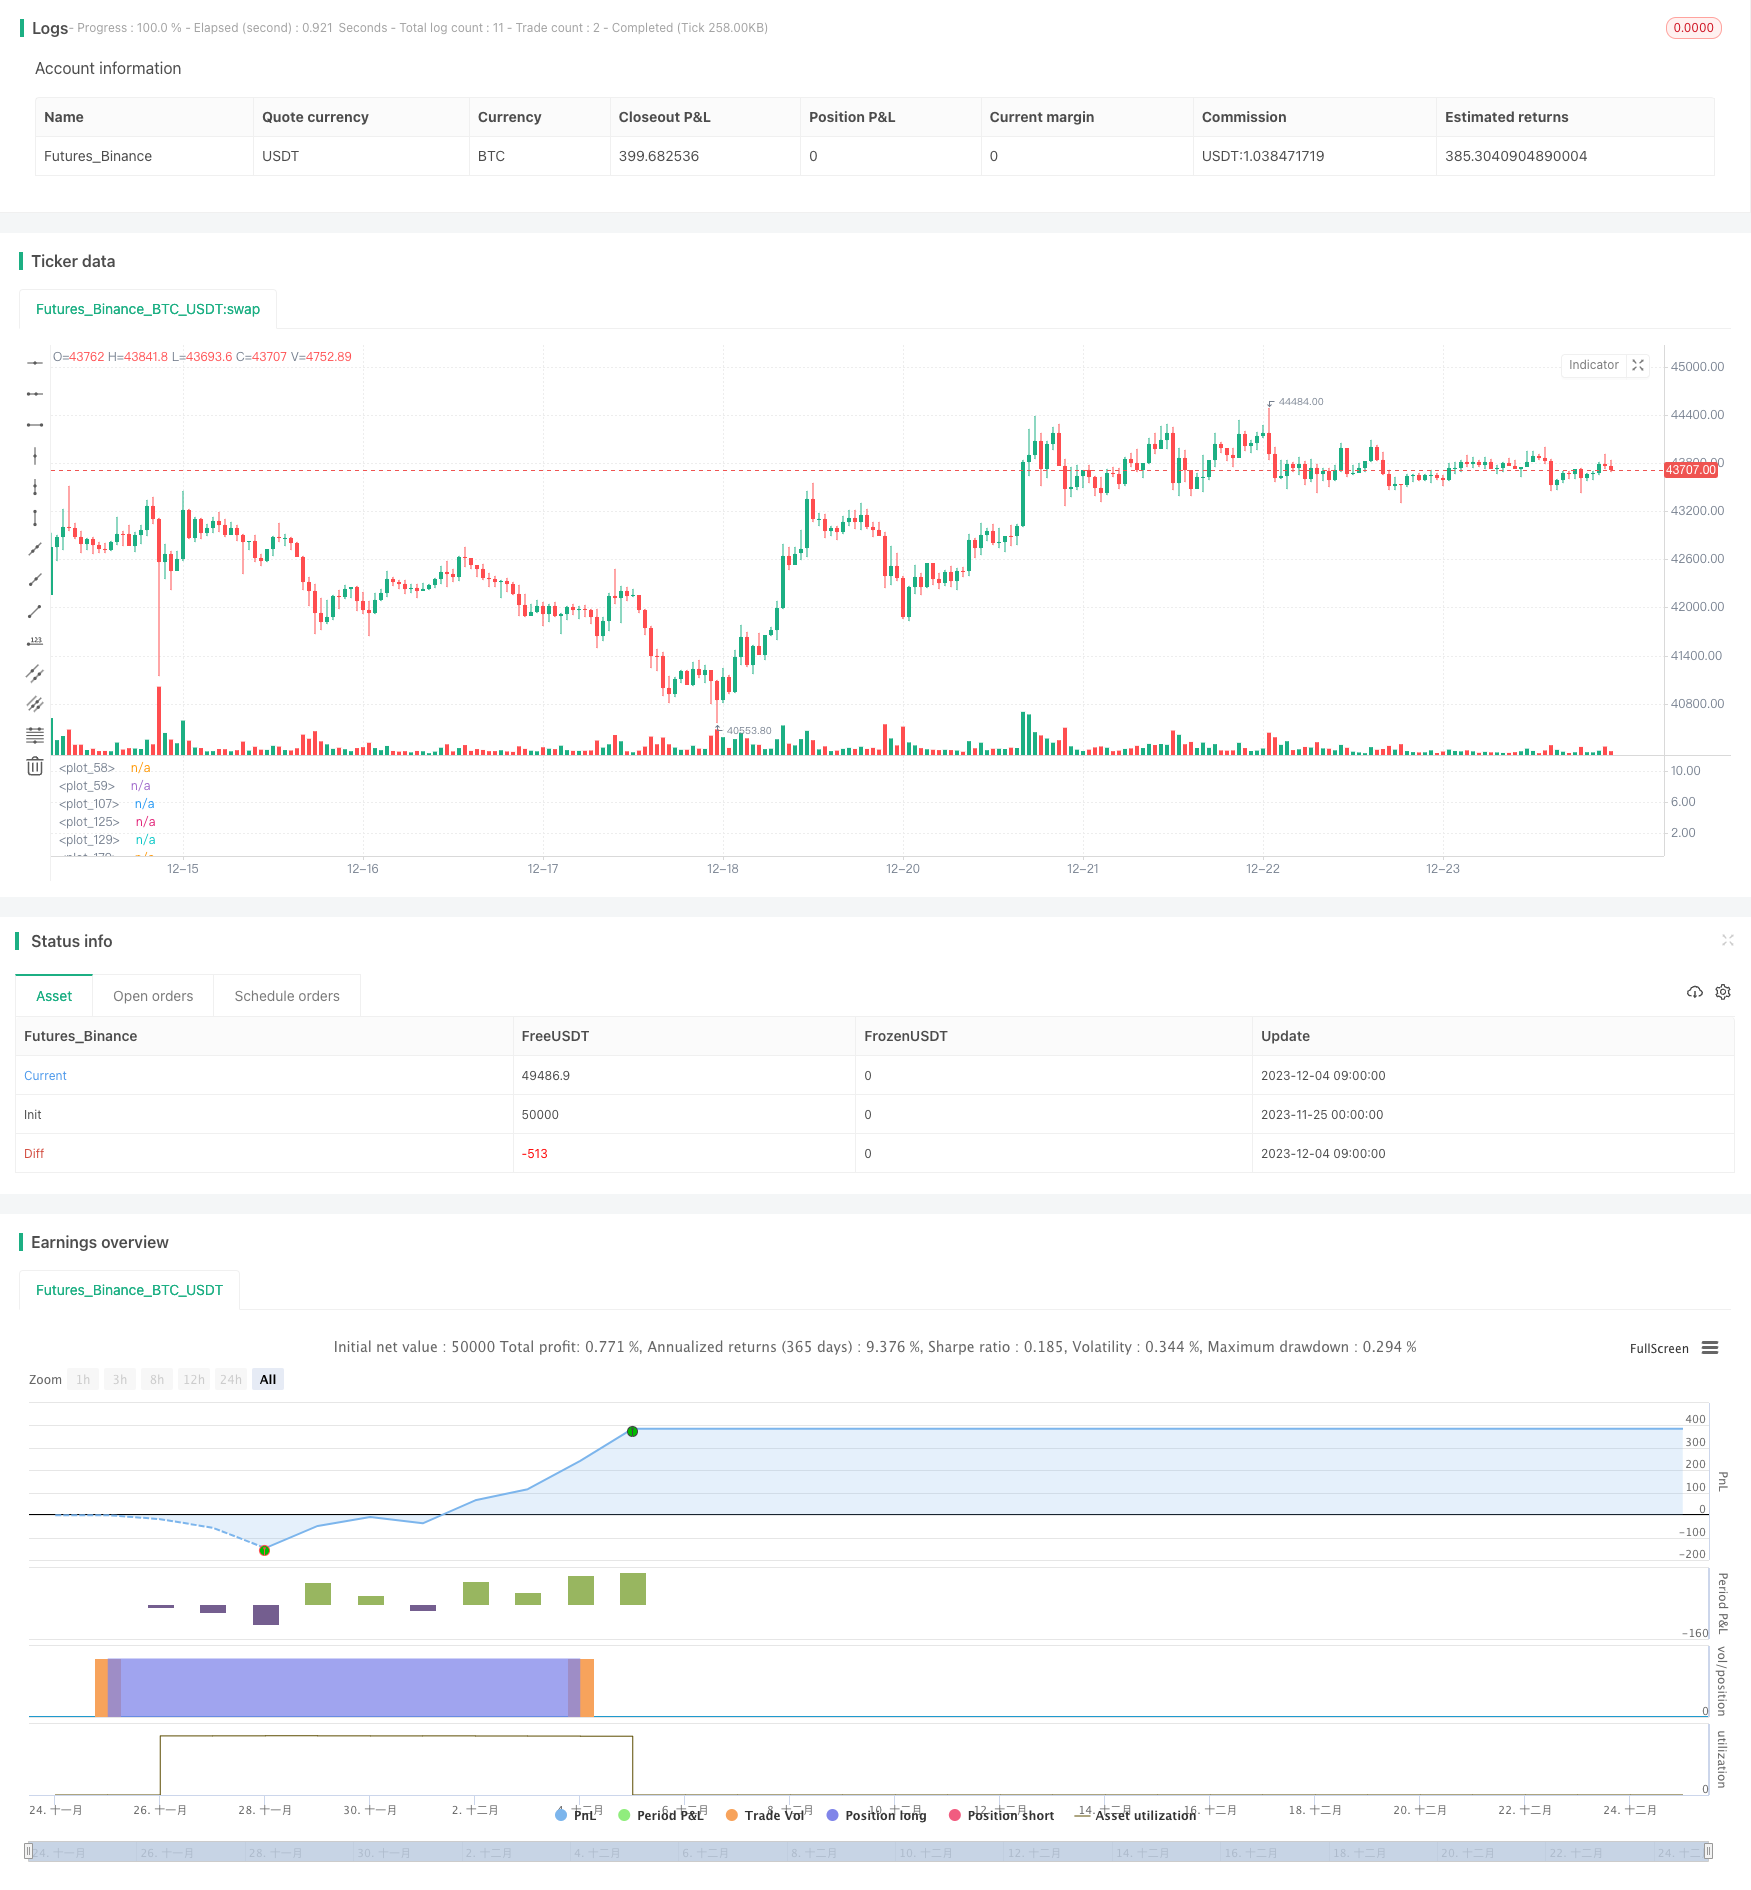
/*backtest
start: 2023-11-25 00:00:00
end: 2023-12-25 00:00:00
period: 1h
basePeriod: 15m
exchanges: [{"eid":"Futures_Binance","currency":"BTC_USDT"}]
*/

// This source code is subject to the terms of the Mozilla Public License 2.0 at https://mozilla.org/MPL/2.0/
// © Drun30 (Federico Magnani)

//@version=4
//STRATEGIA PRINCIPALE
capitaleIniziale=10000

var sizeordineInit= 50 // → % di capitale investita per ogni trade
var deltaSize = 25 // → delta% di capitale investito se trade precedente è stato in perdita
var sizeLimite = 100 //il trade non userà mai questa percentuale di capitale investito
var sizeordine = sizeordineInit

//Parametri ottimali 30 min
usiShort=false
usiLong=true
ipercomprato=85.29
ipervenduto=30.6
//

strategy("Momentum Strategy (V7.B.4)", initial_capital=capitaleIniziale, currency="USD", default_qty_type=strategy.percent_of_equity, commission_type=strategy.commission.percent, commission_value=0.1, slippage = 5, default_qty_value=sizeordineInit, overlay=false, pyramiding=0)

backtest = input(title="------------------------Backtest Period------------------------", defval = false)
start = timestamp(input(2020, "start year"), input(1, "start month"), input(1, "start day"), 00, 00)
end = timestamp(input(0, "end year"), input(0, "end month"), input(0, "end day"), 00, 00)

siamoindata=time > start?true:false
if end > 0
    siamoindata:=time > start and time <= end?true:false

basicParameters = input(title="------------------------Basic Parameters------------------------", defval = false)
smoothK = input(3, minval=1)
smoothD = input(6, minval=1)
lengthRSI = input(12, minval=1)
src = input(close, title="RSI Source")
rsi1 = rsi(src, lengthRSI)
lengthStoch = input(12, minval=1)
k = ema(stoch(rsi1, rsi1, rsi1, lengthStoch), smoothK)
d = ema(k, smoothD)
altezzaipercomprato= input(ipercomprato, title="Overbought Height", minval=1, type=input.float)
altezzaipervenduto= input(ipervenduto, title="Oversold Height", minval=1,type=input.float)

BarsDelay = input(6,title="Bars delay",minval=0)

GambleSizing = input(true, title = "Gamble Sizing?",type=input.bool)
gambleAdd = input(deltaSize,title="Gamble Add (%)",minval=0,type=input.integer)
gambleLimit = input(sizeLimite,title="Gamble MAX (%)",minval=0,type=input.integer)
if GambleSizing and strategy.closedtrades[0]>strategy.closedtrades[1]
    if strategy.losstrades[0]>strategy.losstrades[1] and sizeordine<gambleLimit
        sizeordine:=sizeordine+gambleAdd
    if strategy.wintrades[0]>strategy.wintrades[1]
        sizeordine:=sizeordineInit

periodomediamobile_fast = input(1, title="Fast EMA length",minval=1)
periodomediamobile_slow = input(60, title="Slow EMA length",minval=1)

plot(k, color=color.blue)
plot(d, color=color.orange)
h0 = hline(altezzaipercomprato)
h1 = hline(altezzaipervenduto)
fill(h0, h1, color=color.purple, transp=80)
// n=input(Vicinanzadalcentro,title="Vicinanza dal centro",minval=0)
//sarebbe il livello di D in cui si acquista o si vende, maggiore è la vicinanza maggiore sarà la frequenza dei trades, SE 0 è DISABILITATO

//     siamoinipervenduto= d<=altezzaipervenduto and d<=d[n] and d>d[1]?true:false //and d<d[3] and d>d[1]
//     siamoinipercomprato= d>=altezzaipercomprato and d>=d[n] and d<d[1]?true:false //and d>d[3] and d<d[1]
goldencross = crossover(k,d)
deathcross = crossunder(k,d)
// METTI VARIABILE IN CUI AVVIENE CROSSOVER O CROSSUNDER
valoreoro = valuewhen(goldencross,d,0)
valoremorte = valuewhen(deathcross,d,0)

siamoinipervenduto = goldencross and valoreoro<=altezzaipervenduto?true:false//d<=altezzaipervenduto?true:false
siamoinipercomprato = deathcross and valoremorte>=altezzaipercomprato?true:false//d>=altezzaipercomprato?true:false

long_separator = input(title="------------------------LONG------------------------", defval = usiLong)

sl_long_inp = input(10, title="Stop Loss LONG %", type=input.float)
tp_long_inp = input(8, title="Take Profit LONG %",type=input.float)
stop_level_long = strategy.position_avg_price * (1 - (sl_long_inp/100)) //strategy.position_avg_price corrisponde al prezzo con cui si è aperta la posizione
take_level_long = strategy.position_avg_price * (1 + (tp_long_inp/100))

//BINANCE
JSON_long = 'OPEN LONG: PUT THE JSON HERE FOR THE API CALL'
JSON_chiusura = 'CLOSE POSITION: PUT THE JSON HERE FOR THE API CALL'

webhookLong = JSON_long
webhookClose= JSON_chiusura

trendFilterL = input(title="TREND FILTER LONG?", defval = true)

EMAfast=ema(close,periodomediamobile_fast)
EMAslow=ema(close,periodomediamobile_slow)

siamoinuptrend_ema=EMAfast>EMAslow?true:false //close>=EMAfast and EMAfast>EMAslow
siamoinuptrend = siamoinuptrend_ema

// CondizioneAperturaLong = siamoinipervenduto and siamoindata // and siamoinuptrend
CondizioneAperturaLong = siamoinipervenduto and siamoindata and long_separator
if trendFilterL
    CondizioneAperturaLong := siamoinipervenduto and siamoindata and long_separator and siamoinuptrend

CondizioneChiusuraLong = siamoinipercomprato and siamoindata

possiamoAprireLong=0
if trendFilterL and siamoinuptrend
    possiamoAprireLong:=5
plot(possiamoAprireLong,color=color.green)

sonPassateLeBarreG = barssince(CondizioneAperturaLong) == BarsDelay?true:false
sonPassateLeBarreD = barssince(CondizioneChiusuraLong) == BarsDelay?true:false

haiUnLongAncoraAperto = false
haiUnLongAncoraAperto := strategy.position_size>0?true:false

// Se l'ultimo valore della serie "CondizioneAperturaLong" è TRUE, allora hai un long ancora aperto
// Se l'ultimo valore della serie "CondizioneAperturaLong" è FALSE, allora:
//       Se l'ultimo valore della serie "CondizioneChiusuraLong" è TRUE, allora NON hai un long ancora aperto
//       Se l'ultimo valore della serie "CondizioneChiusuraLong" è FALSE, allora restituisce l'ultimo valore della serie "haiUnLongAncoraAperto"

haiUnLongAncoraAperto_float = if(haiUnLongAncoraAperto==true)
    10
else
    0

plot(haiUnLongAncoraAperto_float,color=color.red) //FInché la linea rossa si trova a livello "1" allora c'è un ordine long in corso

quantita = (sizeordine/100*(capitaleIniziale+strategy.netprofit))/valuewhen(haiUnLongAncoraAperto==false and CondizioneAperturaLong,close,0)

plot(sizeordine,color=color.purple, linewidth=3)

if  strategy.position_size<=0 and CondizioneAperturaLong //and sonPassateLeBarreG and haiUnLongAncoraAperto==false strategy.opentrades==0
    strategy.entry("Vamonos",strategy.long, alert_message=webhookLong, comment="OPEN LONG", qty=quantita)

if  strategy.position_size>0 //and sonPassateLeBarreD // and CondizioneChiusuraLong
    if siamoinuptrend == true and sonPassateLeBarreD
        strategy.close("Vamonos", alert_message=webhookClose, comment="CLOSE LONG")
    else if siamoinuptrend == false and CondizioneChiusuraLong
        strategy.close("Vamonos", alert_message=webhookClose, comment="CLOSE LONG")


if strategy.position_size>0 and siamoindata
    strategy.exit("Vamonos", stop=stop_level_long, limit=take_level_long, comment="CLOSE LONG (LIMIT/STOP)")


short_separator = input(title="------------------------SHORT------------------------", defval = usiShort)

sl_short_inp = input(20, title="Stop Loss SHORT %")
tp_short_inp = input(35, title="Take Profit SHORT %")
stop_level_short = strategy.position_avg_price * (1 + (sl_short_inp/100))
take_level_short= strategy.position_avg_price * (1 - (tp_short_inp/100))

// BINANCE
JSON_short = 'OPEN SHORT: PUT THE JSON HERE FOR THE API CALL'

webhookShort = JSON_short

trendFilterS = input(title="TREND FILTER SHORT?", defval = true)

siamoindowntrend_ema=EMAfast<EMAslow?true:false //close<=EMAfast and EMAfast<EMAslow
siamoindowntrend=siamoindowntrend_ema

CondizioneAperturaShort = short_separator and siamoinipercomprato and siamoindata
if trendFilterS
    CondizioneAperturaShort:=short_separator and siamoinipercomprato and siamoindata and siamoindowntrend

CondizioneChiusuraShort = siamoinipervenduto and siamoindata

sonPassateLeBarreGs = barssince(CondizioneAperturaShort) == BarsDelay?true:false
sonPassateLeBarreDs = barssince(CondizioneChiusuraShort) == BarsDelay?true:false

haiUnoShortAncoraAperto = false
haiUnoShortAncoraAperto := strategy.position_size<0?true:false

haiUnoShortAncoraAperto_float = if(haiUnoShortAncoraAperto==true)
    15
else
    0

plot(haiUnoShortAncoraAperto_float,color=color.purple) //FInché la linea viola si trova a livello "2" allora c'è un ordine short in corso

if CondizioneAperturaShort and strategy.position_size>=0 //and haiUnoShortAncoraAperto==false
    strategy.entry("Andale",strategy.short,alert_message=webhookShort, comment="OPEN SHORT")

if  strategy.position_size<0 //and sonPassateLeBarreD // and CondizioneChiusuraLong
    if siamoindowntrend == true and sonPassateLeBarreDs
        strategy.close("Andale",alert_message=webhookClose, comment="CLOSE SHORT")
    else if siamoindowntrend == false and CondizioneChiusuraShort
        strategy.close("Andale",alert_message=webhookClose, comment="CLOSE SHORT")

if strategy.position_size<0 and siamoindata
    strategy.exit("Andale", stop=stop_level_short, limit=take_level_short, comment="CLOSE SHORT (LIMIT/STOP)")