Стратегия количественного тренда JBravo
Обзор стратегии
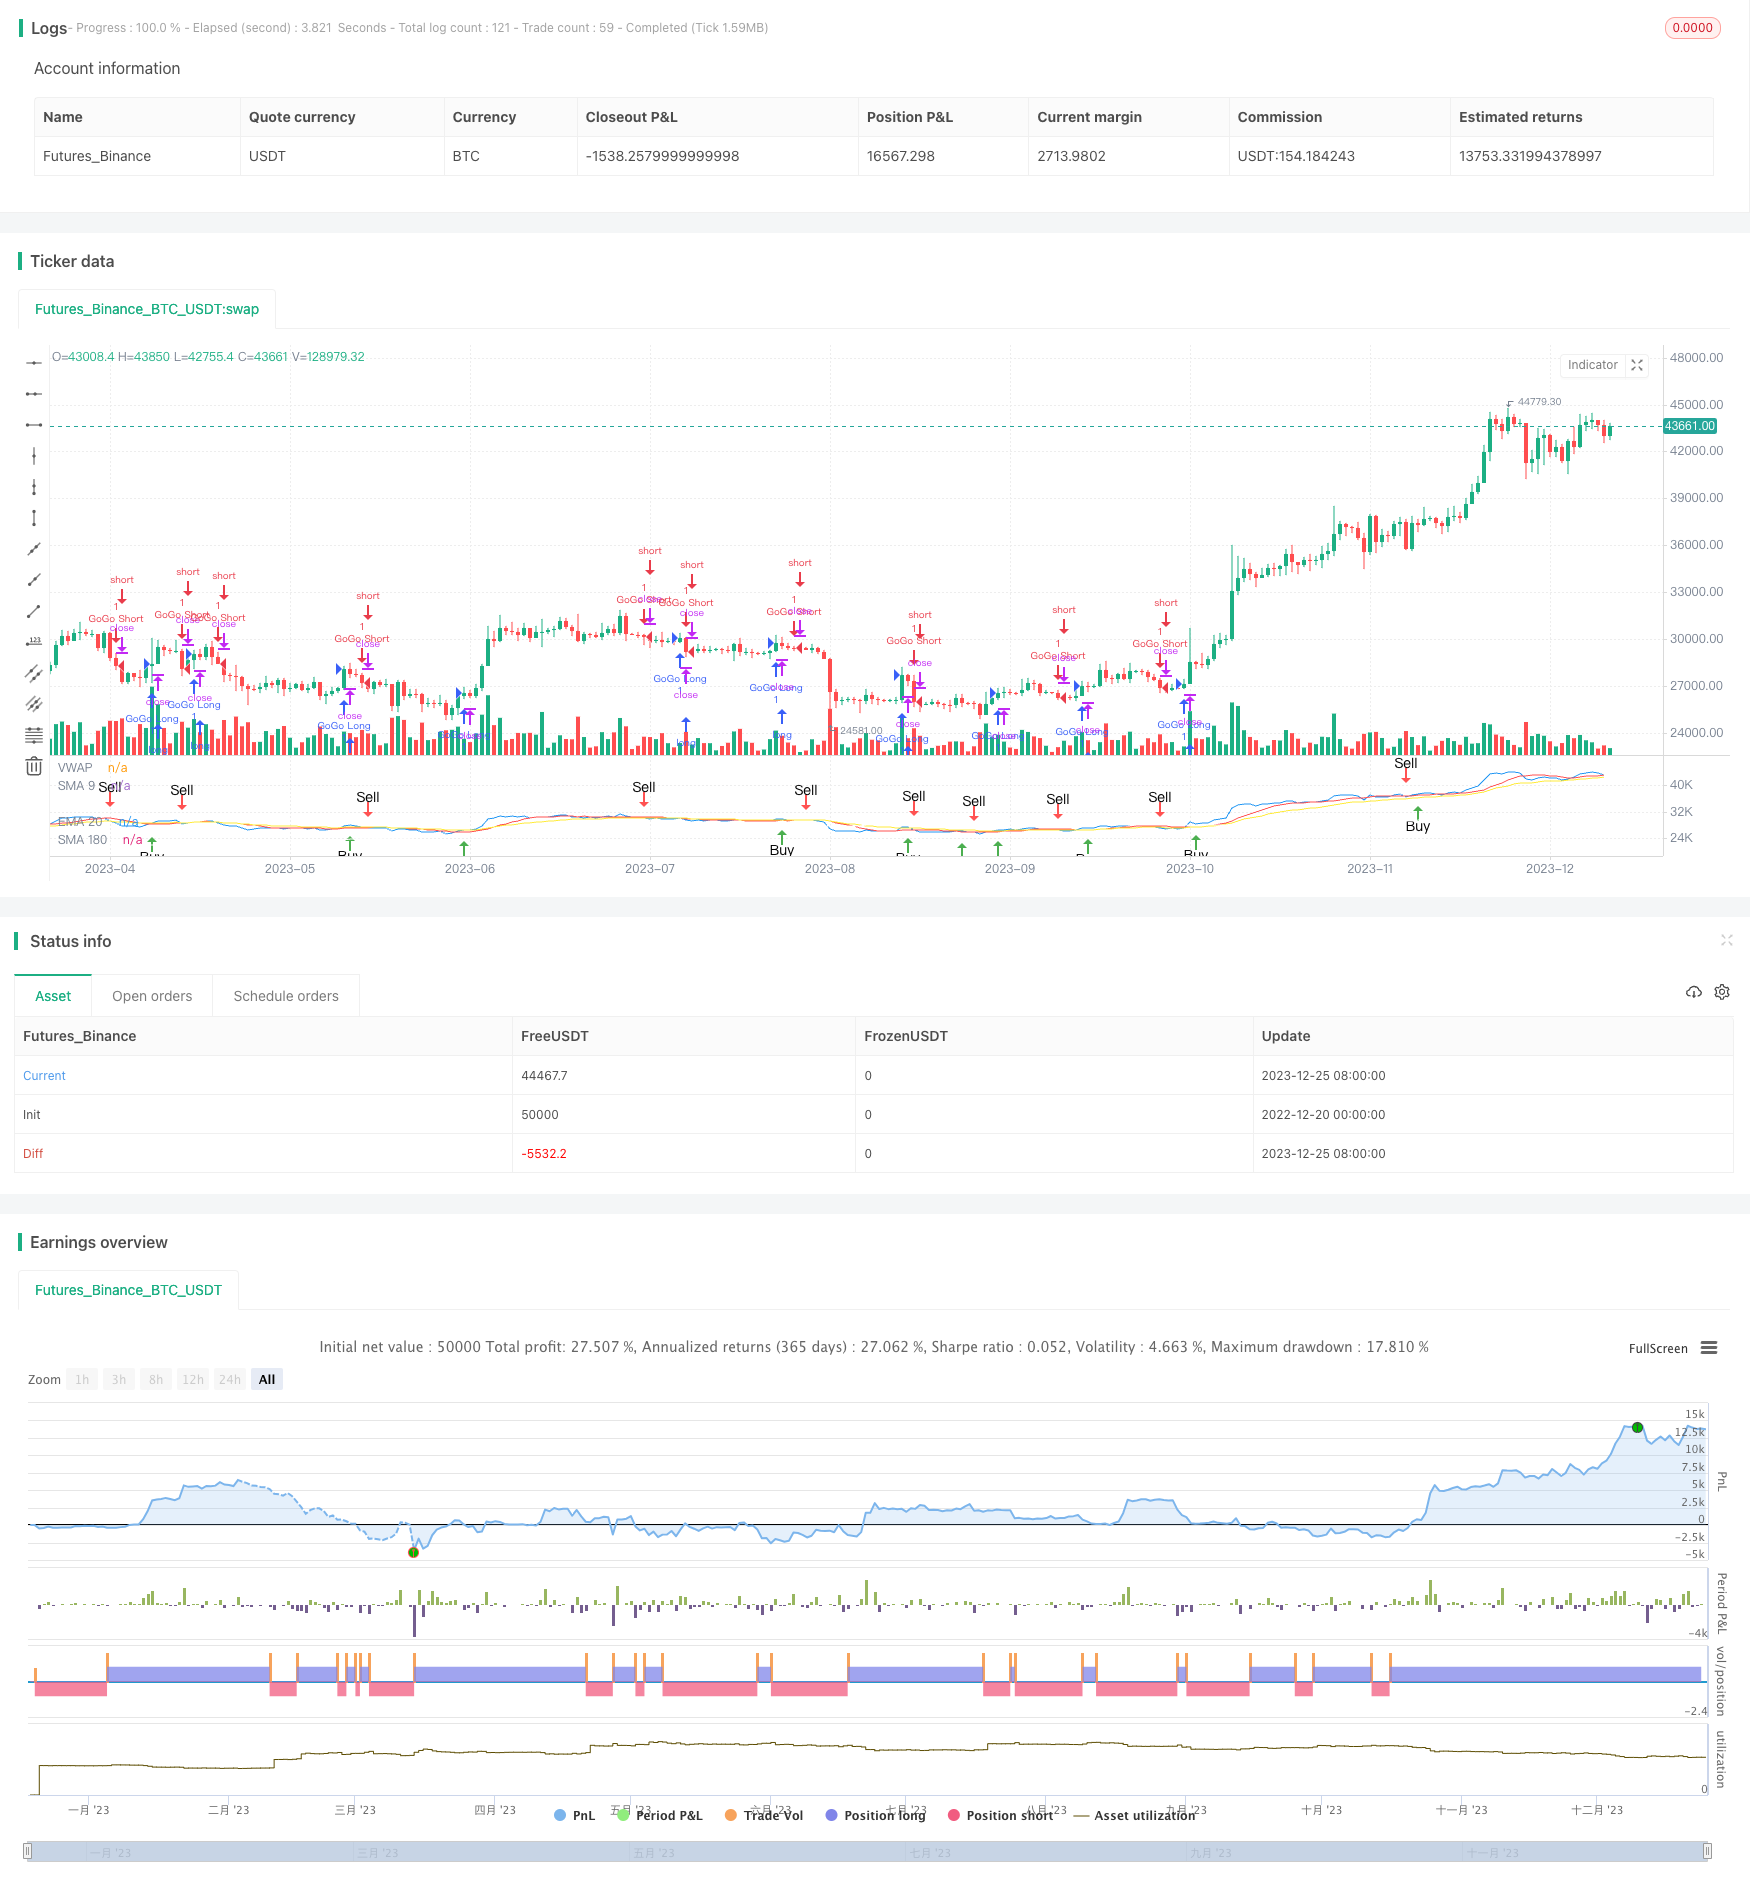
Количественная стратегия трендов JBravo - это стратегия отслеживания трендов на основе движущихся средних. Она использует 9-дневную простую движущуюся среднюю, 20-дневную индексную и 180-дневную простую движущуюся среднюю для определения направления тренда на рынке, а также для окончательных сигналов покупки и продажи.
Название стратегии было вдохновлено мультипликационным персонажем Джонни Браво, который представляет собой уверенный и решительный торговый выбор. Словарь GoGo Juice описывает активное вхождение в игру, когда линия VWAP пересекает 20-дневную индексную подвижную среднюю.
Стратегический принцип
Сигнал покупать возникает, когда K-линия проходит через 9-дневную простую скользящую среднюю цену на закрытии; сигнал продавать возникает, когда цена закрытия проходит через 20-дневную индексную скользящую среднюю цену.
Сильный сигнал к покупке возникает, если 9-й, 20-й и 180-дневная подвижные средние все вверх, а 9-я подвижная средняя выше 20-й подвижной средней, а 20-я подвижная средняя выше 180-дневной подвижной средней.
Сильный сигнал к продаже возникает, если движущиеся средние на 9, 20 и 180 дней все находятся вниз, а движущаяся средняя на 9 дней ниже движущейся средней на 20 дней, а движущаяся средняя на 20 дней ниже движущейся средней на 180 дней.
Сигнал “GoGo” производится, когда средневзвешенная линия цен пересекает 20-дневную скользящую среднюю из нижнего направления. Сигнал “GoGo” производится, когда средневзвешенная линия цен пересекает 20-дневную скользящую среднюю из верхнего направления.
Анализ преимуществ стратегии
Эта стратегия объединяет в себе стратегические идеи отслеживания тенденций и прорывов. Движущаяся средняя позволяет четко определять направление тенденций рынка и уменьшает вероятность ошибочных сделок. В то же время она гибко использует показатель средней стоимости, взвешенной по объему сделок, для определения времени входа в рынок и управления рисками, надеясь на рыночный прорыв.
По сравнению с использованием только движущейся средней, эта стратегия добавляет механизм активного входа в игру, который позволяет получить более высокую рыночную доходность в сильных ситуациях.
В целом, отступления были небольшими и имели стабильную прибыльность.
Анализ стратегических рисков
Несмотря на то, что в этой стратегии добавлены мощные механизмы входа, в условиях шока стоп-потери могут быть чаще задействованы. Кроме того, сами движущиеся средние являются сильно задержанными и не могут вовремя улавливать изменения цен.
Это означает, что стратегия может привести к некоторому количеству виртуальных сделок, которые не будут реально отражать рыночные цены. Кроме того, сильный вход увеличивает риск потерь.
Чтобы снизить риск, можно соответствующим образом изменить периодичность движущейся средней; или добавить модуль остановки, чтобы остановить убытки и выйти из него после достижения определенного размера потерь.
Направление оптимизации стратегии
Эта стратегия может быть оптимизирована в следующих направлениях:
Настройка параметров скользящих средних, оптимизация параметров циклов, поиск оптимальных комбинаций параметров
Повышение оценки объемов сделок, чтобы избежать ошибочных сигналов при резких колебаниях цен
Добавление модуля Stop Loss, установка правил выхода из игры, контроль одиночных потерь
Вместе с выбором сегментов с высоким спросом на рынке, чтобы сделать стратегию более целевой
Оптимизация пропорций открытых позиций, оптимизация различных позиций с разными параметрами scale
Подвести итог
Стратегия количественных трендов JBravo объединяет анализ движущихся средних и оценку трендов средневзвешенных цен. Она стремится к стабильной долгосрочной прибыли, а также имеет определенный механизм радикальной торговли.
||
Strategy Overview
The JBravo Quantitative Trend Strategy is a trend-following strategy based on moving averages. It uses the 9-day simple moving average, 20-day exponential moving average, and 180-day simple moving average to determine the market trend direction, as well as the final buy and sell signals.
The strategy name is inspired by the cartoon character Johnny Bravo, representing a confident and decisive trading decision. The term “GoGo Juice” depicts the aggressive entry when the VWAP line crosses the 20-day exponential moving average.
Strategy Principle
A buy signal is generated when the closing price crosses above the 9-day simple moving average; A sell signal is generated when the closing price crosses below the 20-day exponential moving average.
If the 9-day, 20-day and 180-day moving averages are all moving up, and the 9-day moving average is above the 20-day moving average, the 20-day moving average is above the 180-day moving average, a strong buy signal is generated.
If the 9-day, 20-day and 180-day moving averages are all moving down, and the 9-day moving average is below the 20-day moving average, the 20-day moving average is below the 180-day moving average, a strong sell signal is generated.
When the Volume Weighted Average Price line crosses the 20-day exponential moving average upward, a “GoGo Long” signal is generated; When the Volume Weighted Average Price line crosses the 20-day exponential moving average downward, a “GoGo Short” signal is generated.
Advantage Analysis
This strategy combines the ideas of trend following and breakout strategies. Moving averages can clearly determine the direction of the market trend and reduce the probability of wrong trades. At the same time, it flexibly uses the VWAP indicator to determine the entry time, controlling risks while favoring breakthroughs in the market.
Compared to using moving averages alone, this strategy adds the aggressive entry mechanism of “GoGo Juice”, which can obtain higher returns in strong trends.
Overall, this strategy has small drawdowns and stable profitability.
Risk Analysis
Although the strategy increases the strength of entries, stop loss points can be frequently triggered in sideways markets. In addition, moving averages themselves have high inertia and cannot keep up with price changes in time.
This means that the strategy may generate a certain number of virtual trades that do not actually reflect market price movements. In addition, aggressive entries also increase the risk of losses.
To reduce risks, we can adjust the cycle of moving averages as appropriate; or add a stop loss module to stop loss when losses reach a certain level.
Optimization Directions
The strategy can be optimized in the following directions:
Adjust moving average parameters and optimize cycle parameters to find the optimal parameter combination
Add volume indicators to avoid false signals in times of violent price fluctuations
Increase stop loss modules and set exit rules to control per trade loss
Combine selections of market hot sectors to make strategies more targeted
Optimize opening position proportions, optimize different scale for different parameters
Conclusion
The JBravo Quantitative Trend Strategy integrates moving average analysis and VWAP trend judgment. It pursues stable long-term profits while having a certain degree of aggressive trading mechanisms. The strategy is suitable for medium-long term holdings, with medium-high risks and high returns. It can become a part of portfolio trading strategies with very good market adaptability.
[/trans]
/*backtest
start: 2022-12-20 00:00:00
end: 2023-12-26 00:00:00
period: 1d
basePeriod: 1h
exchanges: [{"eid":"Futures_Binance","currency":"BTC_USDT"}]
*/

// This source code is subject to the terms of the Mozilla Public License 2.0 at https://mozilla.org/MPL/2.0/
// © bradvaughn

//@version=4
strategy("JBravo Swing", overlay = false)

var buy_in_progress = false


//Moving Averages
smaInput1 = input(title="Display SMA 9", type=input.bool, defval=true)
smaInput2 = input(title="Display EMA 20", type=input.bool, defval=true)
smaInput4 = input(title="Display SMA 180", type=input.bool, defval=true)
colored_180 = input(false, title="Color-code 180 trend direction")
vwapInput = input(title="Display VWAP", type=input.bool, defval=true)

sma9 = sma(close, 9)
ema20 = ema(close, 20)
sma180 = sma(close, 180)

//Plot Moving Averages
plot(smaInput1 ? sma9 : na, color= color.red, title="SMA 9")
plot(smaInput2 ? ema20 : na, color = color.yellow, title="EMA 20")

// Plot VWAP
vwap1 = vwap(hlc3)
plot(vwapInput ? vwap1 : na, color = color.blue, title="VWAP")
vwaplong = vwap1 > ema20
vwapshort = vwap1 < ema20

//Color SMA 180 trend direction if selected
sma180_uptrend = sma(close, 180) > sma(close[2], 180)
colr = sma180_uptrend == true or colored_180 == false ? color.white : colored_180 == true ? color.gray : na
plot(smaInput4 ? sma180 : na, color = colr, title="SMA 180")

//Get value of lower end of candle
buyLow = iff(lowest(open, 1) < lowest(close, 1), lowest(open, 1), lowest(close, 1))
sellLow = lowest(close, 1)

// Find the lower MA for crossover sell condition
sellma = iff((sma9<ema20), sma9, ema20)


//SMA 9 trend direction
sma9_uptrend = sma(close, 9) > sma(close[2], 9)
//EMA 20 trend direction
ema20_uptrend = ema(close, 20) > sma(close[2], 20)

//Buy or sell if conditions are met
// Buy when the candle low is above the SMA9
// Sell when the candle low is below the lower of SMA9 and EMA20
Buy = iff(buy_in_progress == false and buyLow > sma9 == true, true, false)
Sell = iff(buy_in_progress == true and sellLow < sellma == true, true, false)

// Determine stong buy and strong sell conditions.
// If moving averages are all up, then this will qualify a buy as a strong buy.
// If the moving averages are not up (ie. down) then this will qualify a sell as a strong sell
StrongBuy = iff (Buy and sma9_uptrend and sma180_uptrend and ema20_uptrend and (sma9 > ema20) and (ema20 > sma180), true, false)
StrongSell = iff (Sell and not sma9_uptrend and not sma180_uptrend and not ema20_uptrend and (sma9 < ema20) and (ema20 < sma180), true, false)

//Update Trading status if bought or sold
if Buy
    buy_in_progress := true
if Sell
    buy_in_progress := false

// Clear Buy and Sell conditions if StrongBuy or StrongSell conditions exist.
// This disables plotting Buy and Sell conditions
if StrongBuy
    Buy := false
if StrongSell
    Sell := false


//Display BUY/SELL indicators

plotshape(Buy,title="Buy", color=color.green, style=shape.arrowup,location=location.belowbar, text="Buy")
plotshape(StrongBuy,title="Strong Buy", color=color.green, style=shape.arrowup,location=location.belowbar, text="Strong Buy")
plotshape(Sell,title="Sell", color=color.red, style=shape.arrowdown,text="Sell")
plotshape(StrongSell,title="Strong Sell", color=color.red, style=shape.arrowdown,text="Strong Sell")

strategy.entry("GoGo Long", strategy.long, 1, when=vwaplong and vwapInput)
strategy.entry("GoGo Short", strategy.short, 1, when=vwapshort and vwapInput)

strategy.close("GoGo Long", when = vwapshort and vwapInput)
strategy.close("GoGo Short", when = vwaplong and vwapInput)


alertcondition(Buy, title="Buy Signal", message="Buy")
alertcondition(Sell, title="Sell Signal", message="Sell")