Стратегия следования за трендом на основе сглаженного осциллятора
Обзор
Эта стратегия основана на гладких шокирующих показателях, чтобы идентифицировать ценовые тенденции и использовать методы отслеживания тенденций для торгов. Когда цена пробивается через показательную линию, вы делаете плюс, а когда цена падает через показательную линию, вы делаете минус.
Стратегический принцип
Эта стратегия использует настраиваемый индикатор ровных колебаний для определения ценовых тенденций. Индикатор рассчитывает текущую K-линию для обратного рыночного курса, то есть теоретическую цену, которая может вызвать обратный рынок. Затем эта обратная рыночная цена обрабатывается для получения окончательной линии ровных колебаний.
Стратегия использует прорыв линии индикатора в качестве сигнала для создания позиции. Сделайте больше, когда цена прорывает линию индикатора, и сделайте пустоту, когда цена падает ниже линии индикатора. Стоп-линия устанавливается в виде определенного процента от цены входа, чтобы блокировать прибыль и контролировать риск.
Стратегические преимущества
- Лучше отслеживать тенденции с помощью пользовательских показателей
- Использование трендового отслеживания, что в значительной степени соответствует количественной теории трендового трейдинга
- Установка стоп-лосса полезна для контроля риска
Анализ рисков
- Существует определенная степень задержки показателей, что может привести к слабой стратегии.
- Ошибочные сигналы, основанные только на одном показателе
- Стоп-убыток имеет место для оптимизации и может быть превышен
Направление оптимизации
- Подумайте о том, чтобы отфильтровать торговые сигналы в сочетании с другими индикаторами, такими как BRI, RSI и т. Д.
- Тестирование различных параметров параметров
- Тестирование и оптимизация методов сдерживания убытков
- Больше данных по различным видам и периодам тестирования
Подвести итог
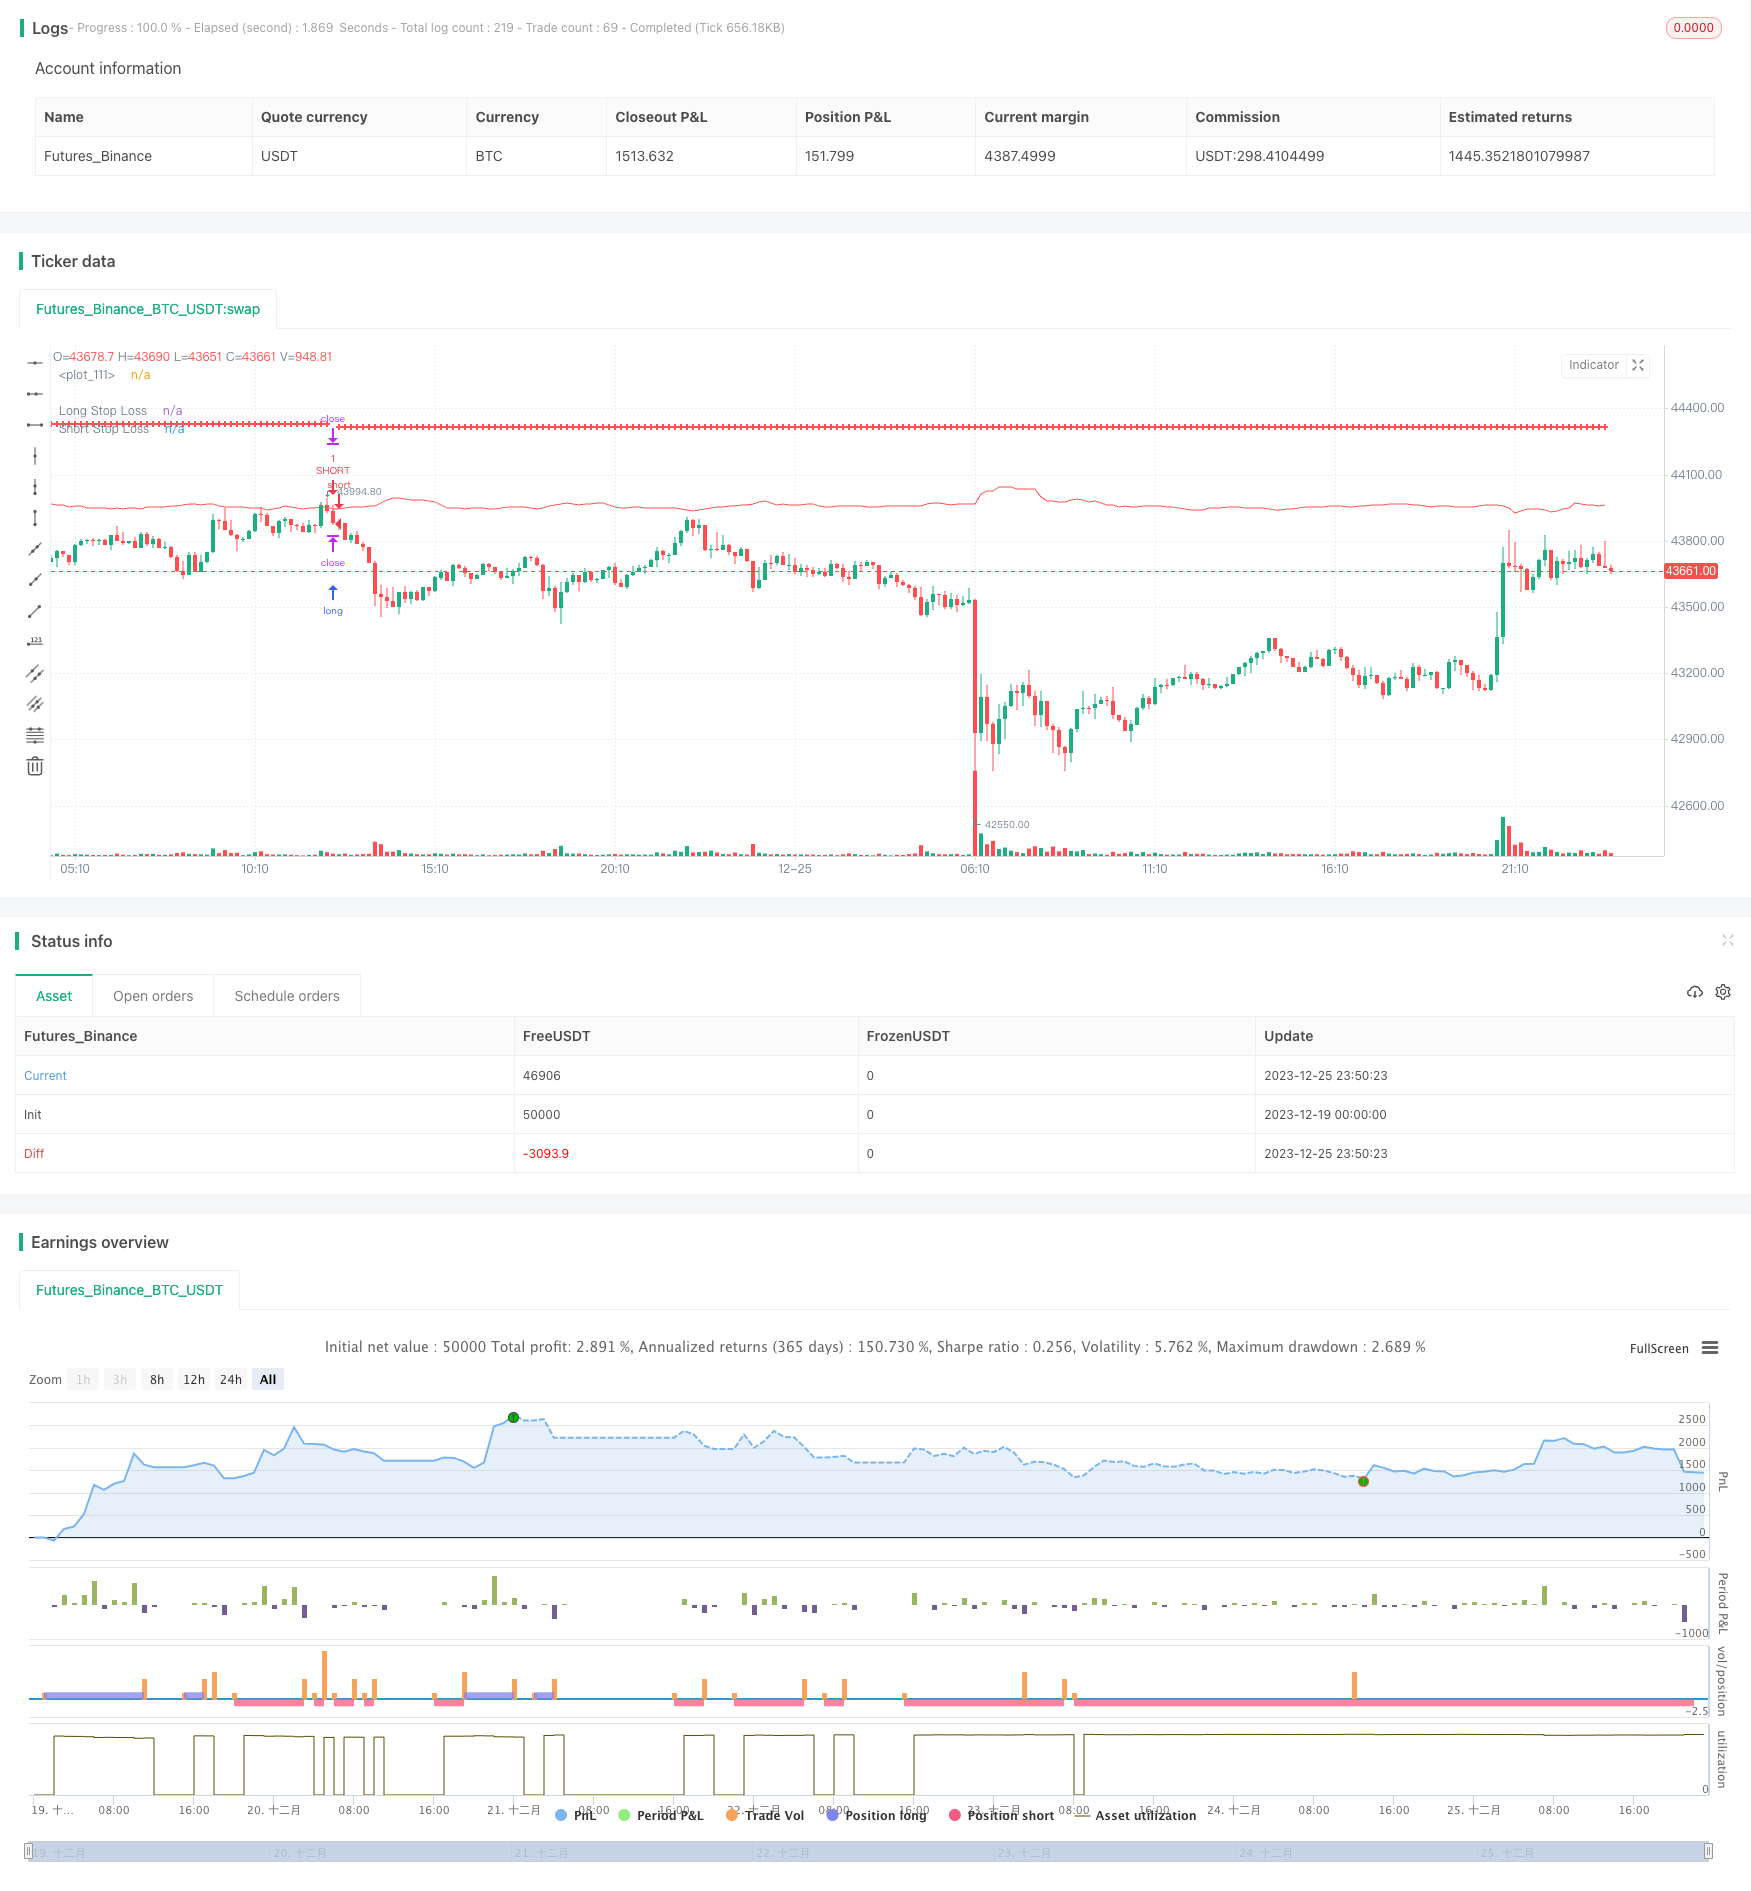
Общая концепция стратегии ясна, она использует пользовательские индикаторы, чтобы идентифицировать тенденции и вести торговлю в соответствии с тенденциями. По результатам отслеживания, стратегия работает хорошо и имеет определенный потенциал для использования в реальном мире. Однако, она зависит только от одного показателя и существует определенная обратная связь, качество сигнала еще предстоит проверить. Кроме того, механизм остановки убытков также нуждается в дальнейшем тестировании и оптимизации.
/*backtest
start: 2023-12-19 00:00:00
end: 2023-12-26 00:00:00
period: 10m
basePeriod: 1m
exchanges: [{"eid":"Futures_Binance","currency":"BTC_USDT"}]
*/

// This source code is subject to the terms of the Mozilla Public License 2.0 at https://mozilla.org/MPL/2.0/

// © TraderHalai
// This is a backtest of the Smoothed Heikin Ashi Trend indicator, which computes the reverse candle close price required to flip a heikin ashi trend from red to green and vice versa. Original indicator can be found on the scripts section of my profile.

// Default testing parameters are 10% of equity position size, with a 1% stop loss on short and long strategy.opentrades.commission

// This particular back test uses this indicator as a Trend trading tool with a tight stop loss. The equity curve as tested seems promising but requires further work to refine. Note in an actual trading setup, you may wish to use this with volatilty filters as most of the losses are in sideways, low volatility markets.


//@version=5
strategy("Smoothed Heikin Ashi Trend on Chart - TraderHalai BACKTEST", " SHA Trend - BACKTEST", overlay=true)
//Inputs

i_useSmooth =       input ( true, "Use smoothing Heikin Ashi")
i_smoothingMethod = input.string("SMA", "Method", options=["SMA", "EMA", "HMA", "VWMA", "RMA"])
i_smoothingPeriod = input ( 10, "Smoothing period")

i_infoBox   =       input ( true, "Show Info Box"        )
i_decimalP  =       input ( 2,    "Prices Decimal Places")
i_boxOffSet =       input ( 5,    "Info Box Offset"      )
i_repaint   =       input (false,  "Repaint -  Keep on for live / Off for backtest")

i_longLossPerc = input.float(title="Long Stop Loss (%)",minval=0.0, step=0.1, defval=1) * 0.01

i_shortLossPerc = input.float(title="Short Stop Loss (%)", minval=0.0, step=0.1, defval=1) * 0.01


timeperiod = timeframe.period

//Security functions to avoid repaint, as per PineCoders
f_secureSecurity(_symbol, _res, _src) => request.security(_symbol, _res, _src[1], lookahead = barmerge.lookahead_on)
f_security(_symbol, _res, _src, _repaint) => request.security(_symbol, _res, _src[_repaint ? 0 : barstate.isrealtime ? 1 : 0])[_repaint ? 0 : barstate.isrealtime ? 0 : 1]
f_secSecurity2(_symbol, _res, _src) => request.security(_symbol, _res, _src[1])


candleClose = f_security(syminfo.tickerid, timeperiod, close, i_repaint)
candleOpen = f_security(syminfo.tickerid, timeperiod, open, i_repaint)
candleLow = f_security(syminfo.tickerid, timeperiod, low, i_repaint)
candleHigh = f_security(syminfo.tickerid, timeperiod, high, i_repaint)

haTicker = ticker.heikinashi(syminfo.tickerid)
haClose = f_security(haTicker, timeperiod, close, i_repaint)
haOpen = f_security(haTicker, timeperiod, open, i_repaint)
haLow = f_security(haTicker, timeperiod, low, i_repaint)
haHigh= f_security(haTicker, timeperiod, high, i_repaint)


reverseClose = (2 * (haOpen[1] + haClose[1])) - candleHigh - candleLow - candleOpen

if(reverseClose < candleLow)
    reverseClose := (candleLow + reverseClose) / 2

if(reverseClose > candleHigh)
    reverseClose := (candleHigh + reverseClose) / 2

//Smoothing

smaSmoothed = ta.sma(reverseClose, i_smoothingPeriod)
emaSmoothed = ta.ema(reverseClose, i_smoothingPeriod)
hmaSmoothed = ta.hma(reverseClose, i_smoothingPeriod)
vwmaSmoothed = ta.vwma(reverseClose, i_smoothingPeriod)
rmaSmoothed = ta.rma(reverseClose, i_smoothingPeriod)

shouldApplySmoothing = i_useSmooth and i_smoothingPeriod > 1

smoothedReverseClose = reverseClose

if(shouldApplySmoothing)
    if(i_smoothingMethod == "SMA")
        smoothedReverseClose := smaSmoothed
    else if(i_smoothingMethod == "EMA")
        smoothedReverseClose := emaSmoothed
    else if(i_smoothingMethod == "HMA")
        smoothedReverseClose := hmaSmoothed
    else if(i_smoothingMethod == "VWMA")
        smoothedReverseClose := vwmaSmoothed
    else if(i_smoothingMethod == "RMA")
        smoothedReverseClose := rmaSmoothed
    else
        smoothedReverseClose := reverseClose // Default to non-smoothed for invalid smoothing type

haBull = candleClose >= smoothedReverseClose
haCol = haBull ? color.green : color.red


//Overall trading strategy
if(ta.crossover(candleClose, smoothedReverseClose))
    strategy.entry("LONG", strategy.long, stop=smoothedReverseClose)
else
    strategy.cancel("LONG")

if(ta.crossunder(candleClose, smoothedReverseClose))
    strategy.entry("SHORT", strategy.short, stop=smoothedReverseClose)
else
    strategy.cancel("SHORT")


longStopPrice  = strategy.position_avg_price * (1 - i_longLossPerc)
shortStopPrice = strategy.position_avg_price * (1 + i_shortLossPerc)


plot(series=(strategy.position_size > 0) ? longStopPrice : na,
     color=color.red, style=plot.style_cross,
     linewidth=2, title="Long Stop Loss")
plot(series=(strategy.position_size < 0) ? shortStopPrice : na,
     color=color.red, style=plot.style_cross,
     linewidth=2, title="Short Stop Loss")

plot(smoothedReverseClose, color=haCol)

if (strategy.position_size > 0)
    strategy.exit(id="XL STP", stop=longStopPrice)

if (strategy.position_size < 0)
    strategy.exit(id="XS STP", stop=shortStopPrice)