Стратегия медленной перекупленности и перепроданности RSI
Обзор
Постепенная RSI стратегия перекупа и перепродажи открывает новые возможности для торговли, уменьшая волатильность кривой RSI, продлевая период обратного отсчета RSI. Эта стратегия также применима к другим техническим показателям, таким как MACD.
Стратегический принцип
Основная идея этой стратегии заключается в том, чтобы продлить длину обратного цикла RSI, принимая 500 циклов по умолчанию, а затем сгладить кривую RSI через SMA, принимая 250 по умолчанию. Это позволяет значительно снизить волатильность кривой RSI, замедлить скорость реакции RSI и, таким образом, создать новые возможности для торговли.
Слишком длинный цикл обратного отсчета ослабляет волатильность кривой RSI, поэтому критерии для определения перекупа и перепродажи также нуждаются в корректировке. Стратегия устанавливает пользовательские линии 52 и 48.
Стратегические преимущества
- Инновационный, открывающий новые торговые пути с помощью продления цикла
- Повышение стабильности при значительном сокращении ложных сигналов
- Настраиваемые на различные рынки
- Заполнение запасов, повышение доходности
Стратегический риск
- Слишком длинные циклы могут упустить короткие возможности
- Необходимо терпеливо ждать, пока появится возможность поступить.
- Неправильная установка порога может привести к увеличению убытков
- Риск арбитража
Решение проблемы:
- Сокращение циклов и увеличение частоты торгов
- Разделение рисков путем строительства складов по партиям
- Оптимизация параметров понижения для адаптации к различным рыночным условиям
- Установка стоп-пойнтов, чтобы избежать больших потерь
Направление оптимизации стратегии
- Оптимизируйте параметры RSI, чтобы найти оптимальную комбинацию циклов
- Тестирование различных параметров гладкого цикла SMA
- Оптимизация параметров перекупа и перепродажи для различных рынков
- Добавление стратегии “стоп-лосс” для борьбы с единичными потерями
Подвести итог
Стратегия медленного RSI сверхпокупки сверхпродажи успешно открывает новую торговую идею путем продления цикла и использования удерживающего колебания средней линии. Эта стратегия, при оптимизации параметров и контроле риска, обещает стабильную и эффективную сверхприбыль. В целом эта стратегия имеет сильную инновационную и практическую ценность.
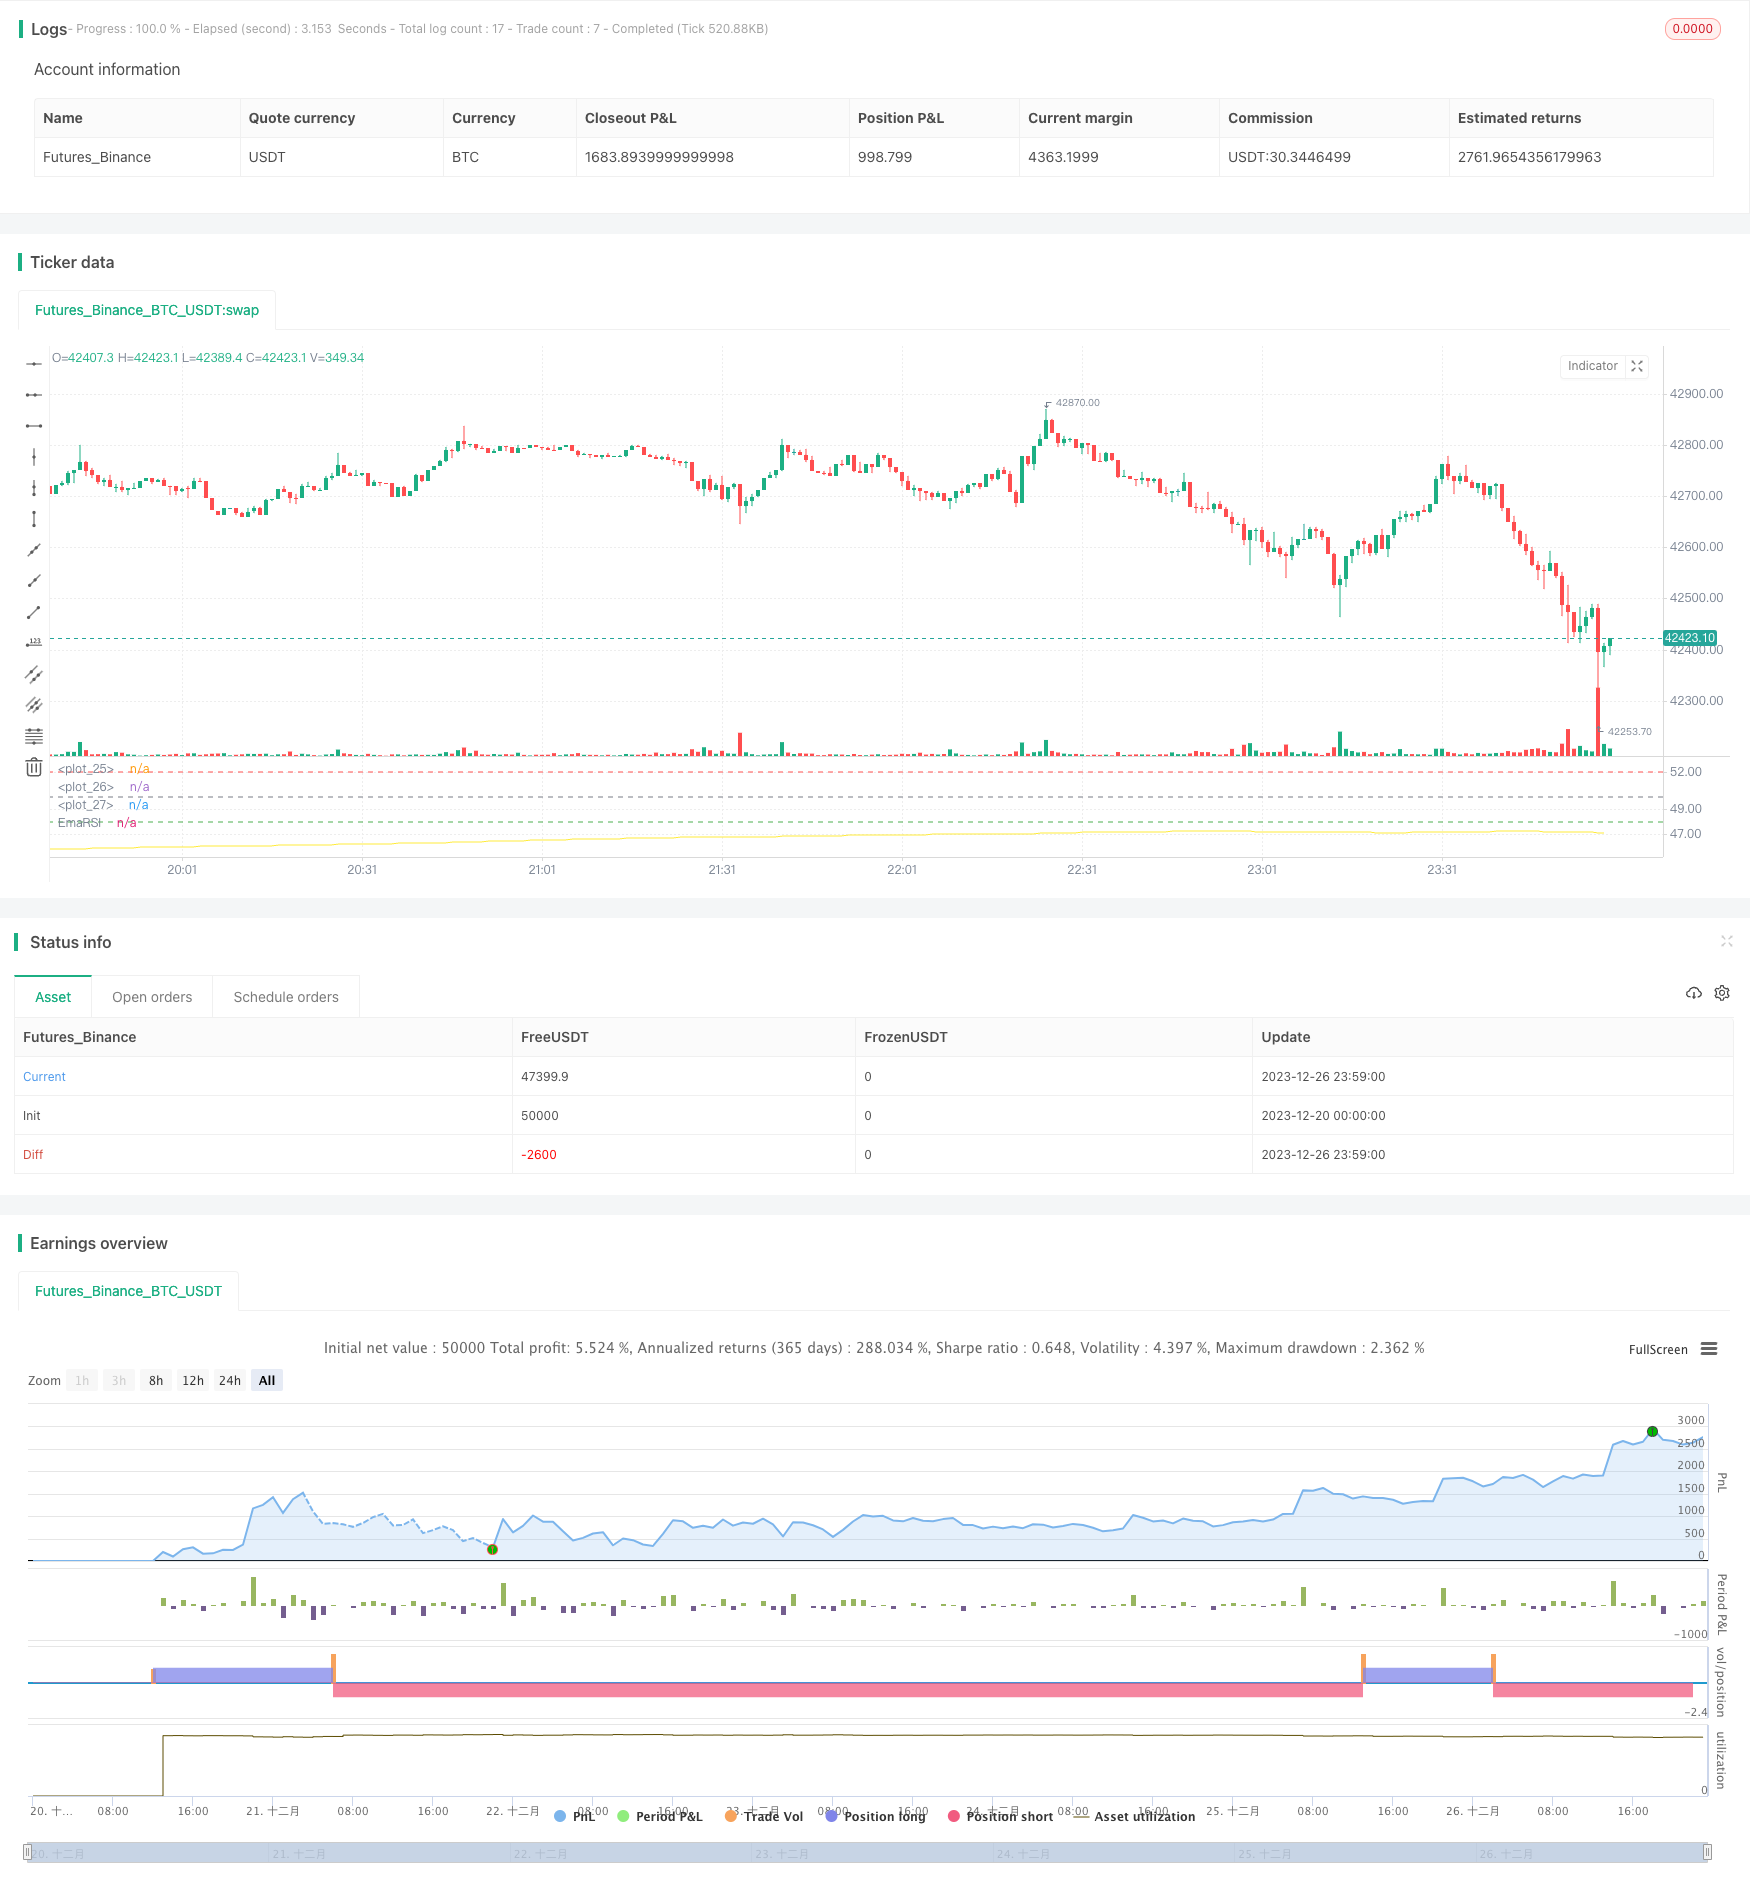
/*backtest
start: 2023-12-20 00:00:00
end: 2023-12-27 00:00:00
period: 1m
basePeriod: 1m
exchanges: [{"eid":"Futures_Binance","currency":"BTC_USDT"}]
*/


// Wilder was a very influential man when it comes to TA. However, I'm one to always try to think outside the box.
// While Wilder recommended that the RSI be used only with a 14 bar lookback period, I on the other hand think there is a lot to learn from RSI if one simply slows down the lookback period
// Same applies for MACD.
// Every market has its dynmaics. So don't narrow your mind by thinking my source code input levels are the only levels that work.
// Since the long lookback period weakens the plot volatility, again, one must think outside the box when trying to guage overbought and oversold levels.

// Good luck and don't bash me if some off-the-wall FA spurned divergence causes you to lose money.
// And NO this doesn't repaint and I won't answer those who ask.
//@version=4

strategy("SLOW RSI OB/OS Strategy", overlay=false)
price = input(ohlc4, title="Price Source")
len = input(500, minval=1, step=5,  title="RSI Length")
smoother = input(250, minval=1, step=5, title="RSI SMA")
up = rma(max(change(price), 0), len)
down = rma(-min(change(price), 0), len)
rsi = down == 0 ? 100 : up == 0 ? 0 : 100 - (100 / (1 + up / down))
EmaRSI = ema(rsi,smoother)
plot(EmaRSI, title="EmaRSI", style=line, linewidth=1, color=yellow)


OB = input(52, step=0.1)
OS = input(48, step=0.1)
hline(OB, linewidth=1, color=red)
hline(OS,linewidth=1, color=green)
hline(50,linewidth=1, color=gray)


long = change(EmaRSI) > 0 and EmaRSI <= 50 and crossover(EmaRSI, OS)
short = change(EmaRSI) < 0 and EmaRSI >= 50 and crossunder(EmaRSI, OB)


strategy.entry("Long", strategy.long, when=long) //_signal or long) //or closeshort_signal)
strategy.entry("Short", strategy.short, when=short) //_signal or short) // or closelong_signal)

// If you want to try to play with exits you can activate these!

//closelong = crossunder(EmaRSI, 0) //or crossunder(EmaRSI, OS)
//closeshort = crossover(EmaRSI, 0) //or crossover(EmaRSI, OB)

//strategy.close("Long", when=closelong)
//strategy.close("Short", when=closeshort)