Количественная торговая стратегия на основе полос Боллинджера и VWAP
Обзор
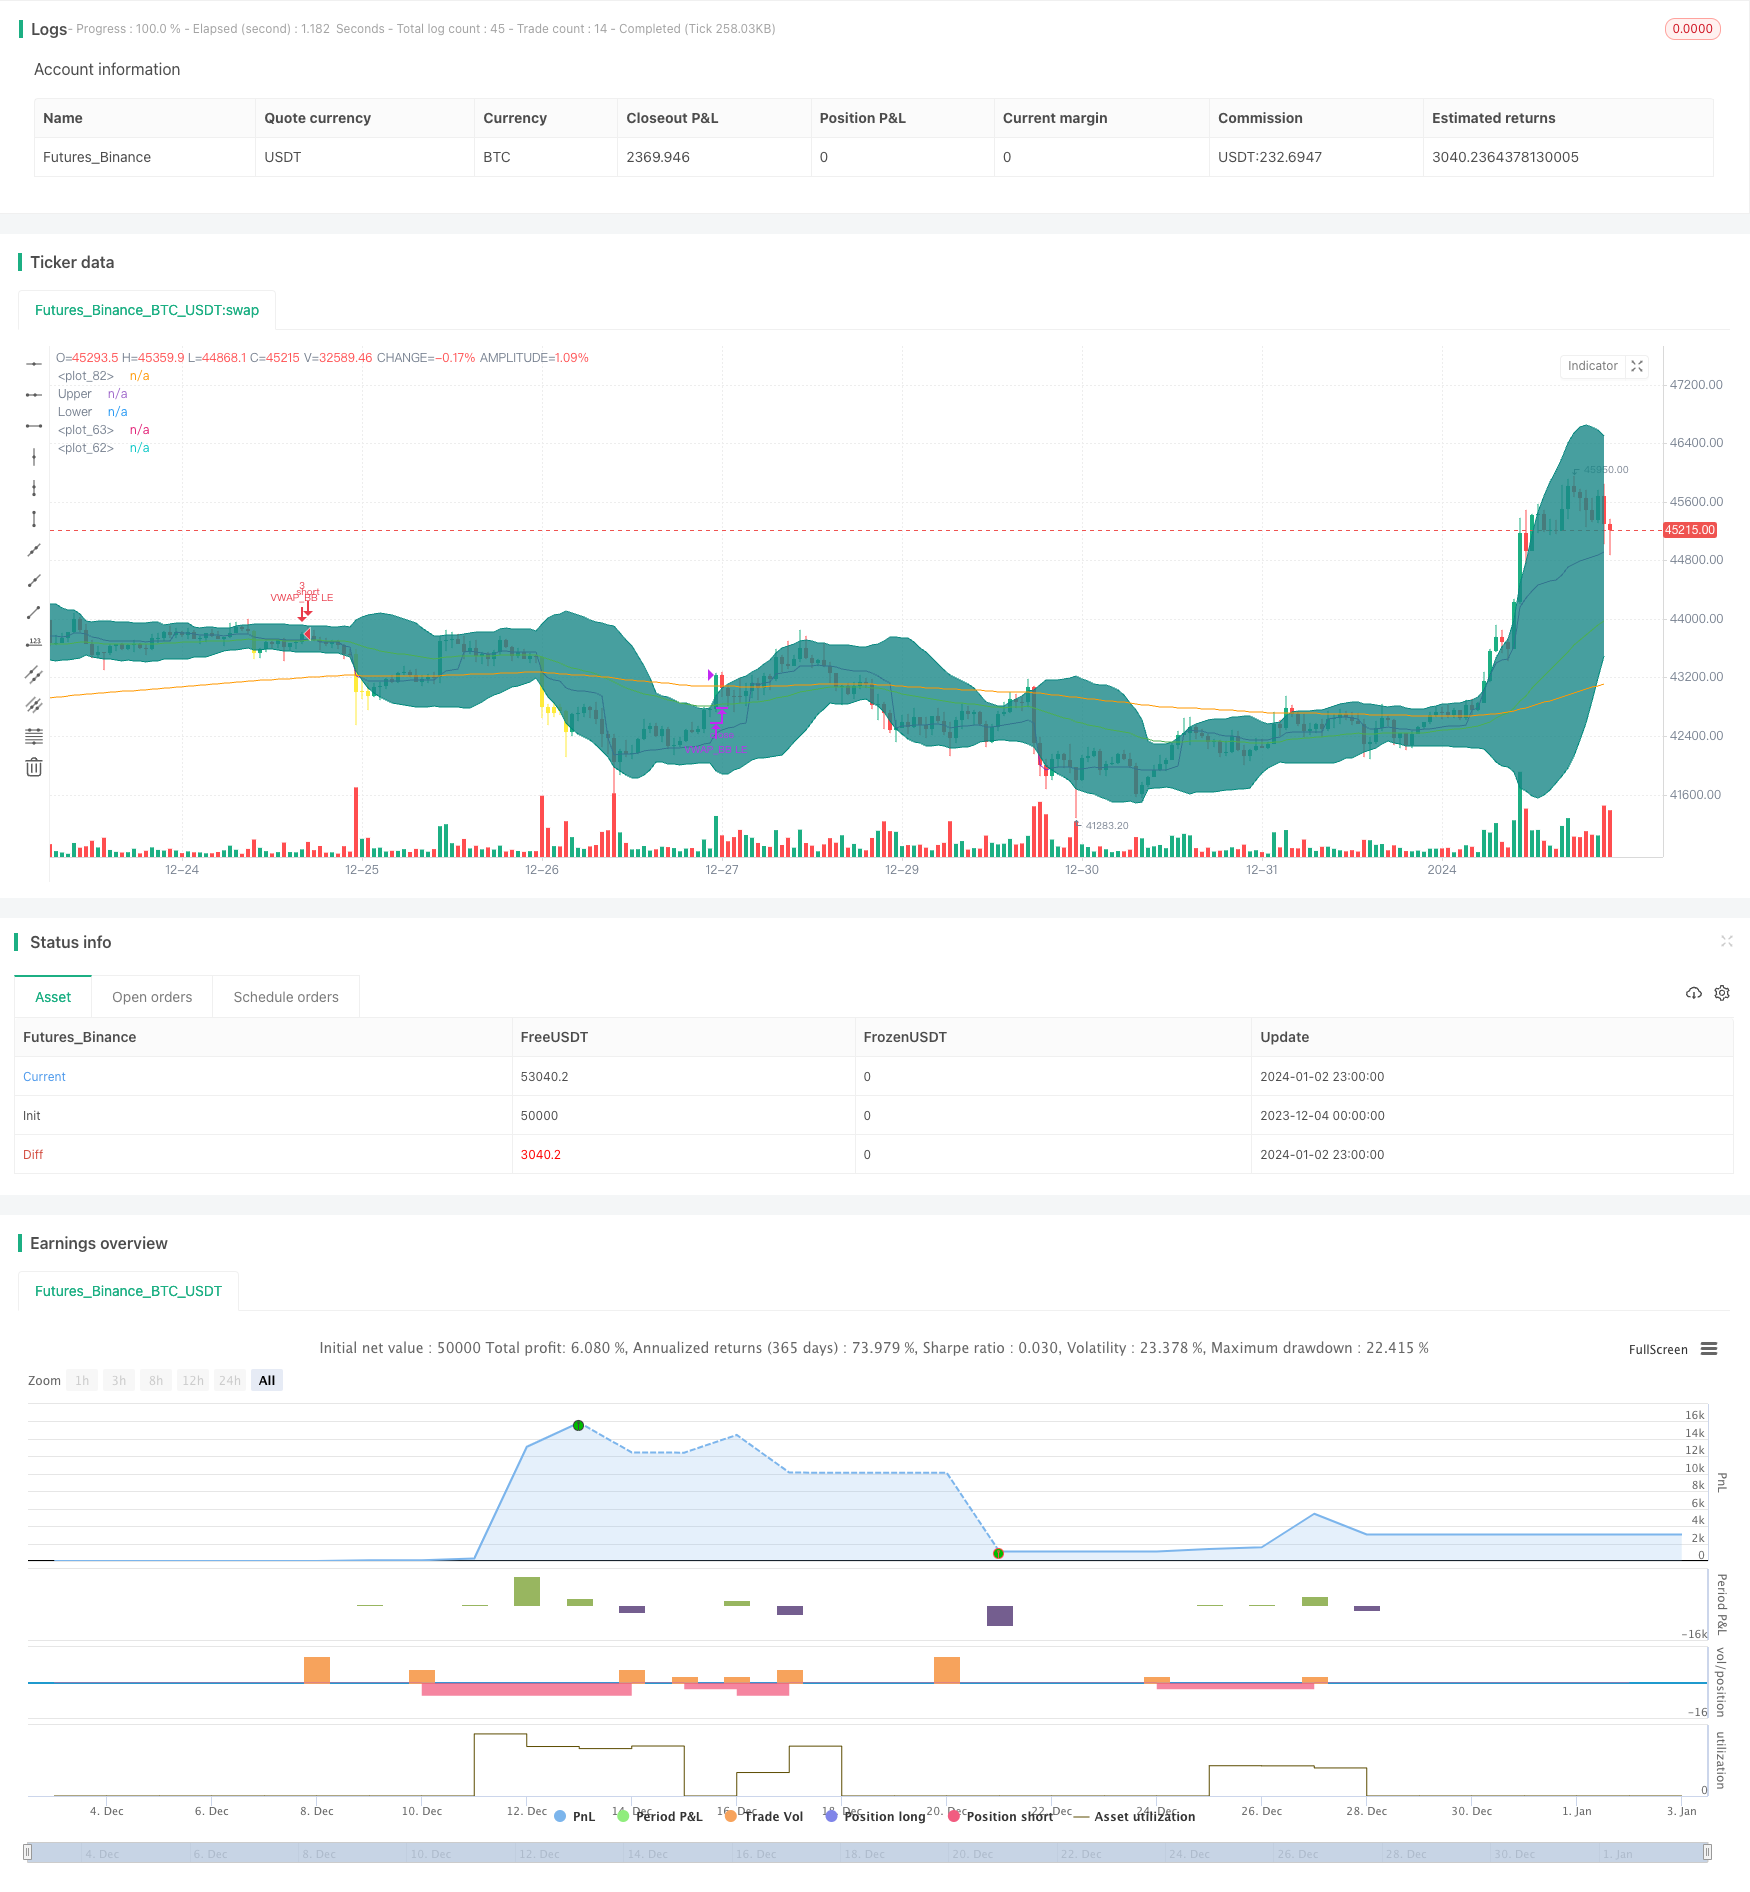
Эта стратегия объединяет два показателя: ленты Брин ((BB) и типичный средний объем цены ((VWAP) для принятия решений о покупке и продаже. Она может обнаружить краткосрочные ценовые аномалии и затем совершить сделку, подходящую для короткой торговли.
Стратегический принцип
Эта стратегия основана на следующих правилах:
Быстрая линия EMA выше, чем медленная линия EMA, как предпосылка для определения тренда
Когда цена закрытия выше VWAP, расценить как рост цены и купить
Если одна из 10 K-линий закрывается ниже нижней линии Брин, это будет расценено как необычная покупка.
Когда цена закрытия была выше, чем цена Brin, она была перевернута и продана.
В частности, стратегия сначала оценивает 50-дневную ЭМА выше, чем 200-дневная ЭМА, используя медленную ЭМА, чтобы определить большую тенденцию. Затем в сочетании с VWAP, чтобы определить, находится ли цена в тенденции к росту в краткосрочной перспективе.
Правило выхода проще, когда цены выше, чем цена на биржевой ленте, и цена уже совершила обратный ход и вышла.
Анализ преимуществ
Эта стратегия объединяет различные индикаторы, которые определяют ценовые отклонения, что повышает эффективность входных сигналов. Использование EMA для определения больших тенденций позволяет избежать обратной операции. В сочетании с VWAP можно захватить краткосрочные возможности роста цен. Использование отклонений цены по Брин-банду позволяет точно находить время для торговли на коротких линиях.
Анализ рисков
- EMA считает, что большие тенденции не должны приводить к регрессивной операции
- Индекс VWAP лучше всего применять для эффекта часовых или суточных данных, если он используется для эффекта суточных данных, то он имеет скидку
- Неправильно настроенные параметры пояса Бринга, слишком широкий или слишком узкий верхний и нижний рельсы могут привести к ошибке сигнала
В связи с этими рисками можно соответствующим образом изменить параметры EMA-циклов или попробовать другие индикаторы оценки тенденций. Параметры VWAP применяются для внутридневных данных или для других коротколинейных индикаторов.
Направление оптимизации
- Попробуйте использовать другие индикаторы, например MACD.
- Оптимизация параметров EMA и Брин-полосы, чтобы найти оптимальную конфигурацию
- Увеличение убыточности
- Фильтрация ложных сигналов в сочетании с другими показателями
- Тестирование различных сортов и циклических данных
Подвести итог
Стратегия объединяет два показателя, Brin Belt и VWAP, для определения краткосрочных ценовых аномалий в качестве времени входа. Используйте EMA, чтобы определить большую тенденцию, чтобы избежать обратной операции. Быстро можно обнаружить возможности короткой ценовой тенденции.
/*backtest
start: 2023-12-04 00:00:00
end: 2024-01-03 00:00:00
period: 1h
basePeriod: 15m
exchanges: [{"eid":"Futures_Binance","currency":"BTC_USDT"}]
*/

// This source code is subject to the terms of the Mozilla Public License 2.0 at https://mozilla.org/MPL/2.0/
// © mohanee

//@version=4
strategy(title="VWAP and BB strategy [EEMANI]", overlay=true,pyramiding=2, default_qty_value=3, default_qty_type=strategy.fixed,    initial_capital=10000, currency=currency.USD)
//This strategy combines VWAP and BB indicators
//BUY RULE
//1. EMA50 > EMA 200
//2. if current close > vwap session  value
//3. check if  price dipped BB lower band for any of last 10 candles
//EXIT RULE
//1. price closes above BB upper band
//STOP LOSS EXIT
//1. As configured --- default is set to 5%

is_price_dipped_bb(pds,source1) =>
    t_bbDipped=false
    for i=1 to pds
        t_bbDipped:=  (t_bbDipped   or  close[i]<source1) ? true : false
        if t_bbDipped==true
            break
        else
            continue

    t_bbDipped

// variables  BEGIN
shortEMA = input(50, title="fast EMA", minval=1)
longEMA = input(200, title="slow EMA", minval=1)

//BB

smaLength = input(20, title="BB SMA Length", minval=1)
bbsrc = input(close, title="BB Source")


//addOnDivergence = input(true,title="Add to existing on Divergence")
//exitOption = input(title="exit on RSI or BB", type=input.string, options=["RSI", "BB"],      defval="BB")

//bbSource = input(title="BB  source", type=input.string, options=["close", "vwap"],      defval="close")

//vwap_res = input(title="VWAP Resolution", type=input.resolution, defval="session")
stopLoss = input(title="Stop Loss%", defval=5, minval=1)

//variables  END


longEMAval= ema(close, longEMA)
shortEMAval= ema(close, shortEMA)


vwapVal=vwap(close)


// Drawings

//plot emas
plot(longEMAval, color = color.orange, linewidth = 1, transp=0)
plot(shortEMAval, color = color.green, linewidth = 1, transp=0)


//bollinger calculation
mult = input(2.0, minval=0.001, maxval=50, title="StdDev")
basis = sma(bbsrc, smaLength)
dev = mult * stdev(bbsrc, smaLength)
upperBand = basis + dev
lowerBand = basis - dev
offset = input(0, "Offset", type = input.integer, minval = -500, maxval = 500)
//bollinger calculation

//plot bb
//plot(basis, "Basis", color=#872323, offset = offset)
p1 = plot(upperBand, "Upper", color=color.teal, offset = offset)
p2 = plot(lowerBand, "Lower", color=color.teal, offset = offset)
fill(p1, p2, title = "Background", color=#198787, transp=95)


plot(vwapVal, color = color.purple, linewidth = 1, transp=0)


// Colour background

barcolor(shortEMAval>longEMAval and close<=lowerBand ? color.yellow: na)


//longCondition=  shortEMAval > longEMAval and  close>open and  close>vwapVal
longCondition= shortEMAval >= longEMAval  and  close>=vwapVal and close>open  //      close>vwapVal   and


//Entry
strategy.entry(id="VWAP_BB LE", comment="VB LE" , long=true,  when= longCondition and  is_price_dipped_bb(10,lowerBand) )  //and strategy.position_size<1

//add to the existing position
//strategy.entry(id="VWAP_RSI LE", comment="VR LE Add" , long=true,  when= addOnDivergence==true and strategy.position_size>=1 and close<strategy.position_avg_price   and (close<lowerBand or  low<lowerBand) and rsiVal>rsi_buy_line)

barcolor(strategy.position_size>=1  ? color.blue: na)


strategy.close(id="VWAP_BB LE", comment="TP Exit VB LE",   when=crossover(close,upperBand) )

//stoploss
stopLossVal =   strategy.position_avg_price * (1-(stopLoss*0.01) )
strategy.close(id="VB LE", comment="SL Exit",   when= close < stopLossVal)