Сочетание количественных торговых стратегий тренда и волатильности
Обзор
Двойная стратегия трендовых колебаний - это количественная торговая стратегия, которая сочетает в себе тренды и колебания. Она использует комбинацию двух индикаторов для определения направления и силы тренда и поиска наилучшего момента входа во время колебаний тренда.
Стратегический принцип
Стратегия основана на использовании двух публичных индикаторов: Trend Surfers и Trend Oscillator Mawreez.
Trend Surfers - это индикатор, который отслеживает тенденции, чтобы остановить убытки. Он определяет движение цены и дает рекомендацию о том, где остановить убытки, рассчитывая максимальные и минимальные цены за определенный период. Например, когда цена превышает наивысшую цену последней линии 168 K, это является позитивным сигналом; когда цена падает ниже самой низкой цены последней линии 168 K, это является сигналом падения.
Mawreez’s Trend Oscillator является двулинейным индикатором колебаний. Он похож на MACD и определяет направление и силу тренда с помощью разрыва в DI. Кривая индикатора является позитивной выше оси 0 и нисходящей ниже.
Правила торговли в этой стратегии следующие:
Многоголовый вход: Trend Surfers пробивают линию максимума и MaWreez’s Trend Oscillator индикатор покупает в позитивный момент Продажа Trend Surfers после падения нижней границы и падения показателя Trend Oscillator Mawreez
Стоп-стоп для трендового стоп-стопа и фиксированного стоп-стопа.
Анализ преимуществ
Эта стратегия, объединяющая трендовые и шоковые индикаторы, позволяет как улавливать тренды, так и искать лучшие цены на вход в шоковых условиях, имея следующие преимущества:
- Двойная фильтрация эффективно предотвращает ложные прорывы
- В сочетании с тенденциями и колебаниями, легче захватить цену в колебательных зонах в низком положении, втягивающей схемы или высокой легкой настройки.
- Использование многократного остановки позволяет хорошо контролировать риск.
Анализ рисков
Однако эта стратегия также несет в себе некоторые риски:
- Двойной портфель показателей
- Тенденционные и шок-индикаторы могут сигнализировать о конфликте
- Фиксированный стоп может быть преждевременным.
Эти риски могут быть предотвращены следующими мерами:
- Ослабление параметров показателя, снижение частоты колебаний
- Добавление правил оценки тенденций, чтобы избежать конфликта показателей
- Динамическая коррекция стоп-позиции
Направление оптимизации
В этой стратегии есть место для дальнейшей оптимизации:
- Испытание различных комбинаций и циклических параметров, чтобы найти оптимальные параметры
- Повышение волатильности, объемов сделок и т. д.
- Показатели и параметры динамической оптимизации с использованием машинного обучения
Подвести итог
Преимущества комбинированного использования трендового отслеживания и шок-индикатора в стратегии двойного тренда заключаются в том, что она позволяет идентифицировать направление тренда, а также использовать возможности шока, оптимизируя параметры и правила, чтобы дополнительно повысить прибыльность стратегии. Стратегия имеет хорошие перспективы развития.
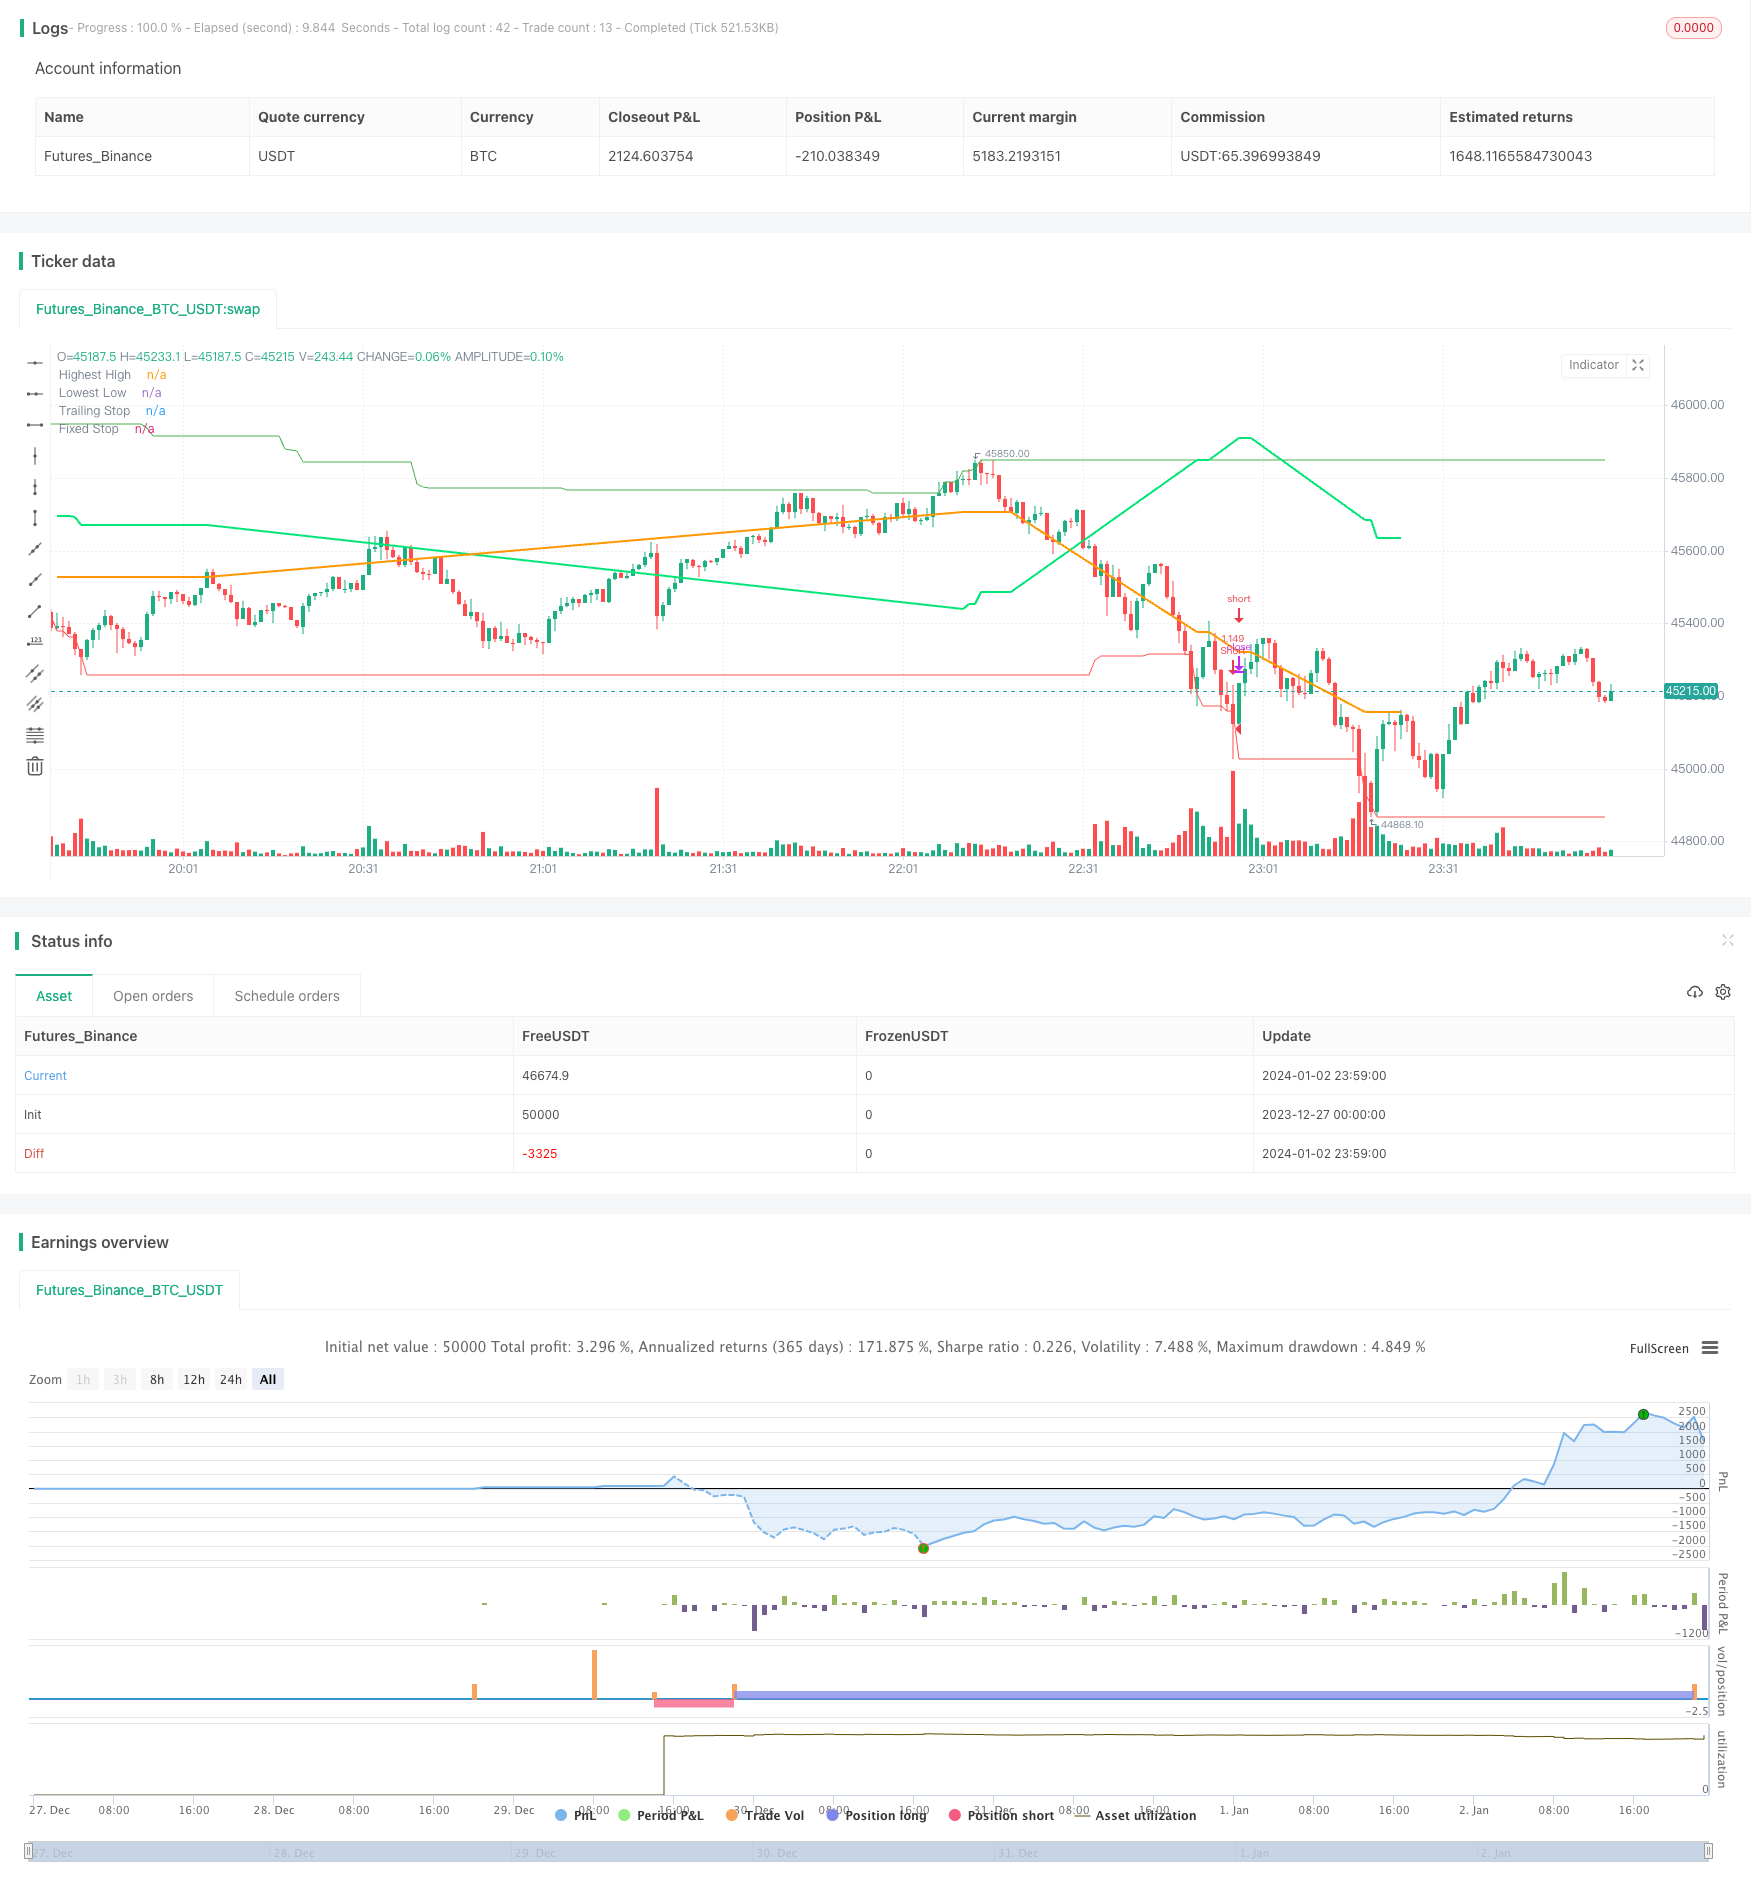
/*backtest
start: 2023-12-27 00:00:00
end: 2024-01-03 00:00:00
period: 1m
basePeriod: 1m
exchanges: [{"eid":"Futures_Binance","currency":"BTC_USDT"}]
*/

// This source code is subject to the terms of the Mozilla Public License 2.0 at https://mozilla.org/MPL/2.0/
// © myn

//@version=5
strategy('Strategy Myth-Busting #8 - TrendSurfers+TrendOsc - [MYN]', max_bars_back=5000, overlay=true, pyramiding=0, initial_capital=20000, currency='USD', default_qty_type=strategy.percent_of_equity, default_qty_value=100.0, commission_value=0.075, use_bar_magnifier = false)

/////////////////////////////////////
//* Put your strategy logic below *//
/////////////////////////////////////
//cAe9It4ynO4


// Strategies
// Trend Surfers - Premium Indicator
// Mawreez' Trend Oscillator Indicator

// Trading Setup / Rules


// Long Condition
// Trend Surfers Trailing stop line goes below (Crosses) lowest low
// Bullish Candle (red)
// Mawreeze Trend Oscilator Indicator is green


// Short Condition

// Trend Surfers Trailing stop line goes above (Crosses) highest high
// Bearish Candle (red)
// Mawreeze Trend Oscilator Indicator is red

// Stop loss middle between high and low Risk 1:2


//@version=5
//strategy(shorttitle='Trend Surfers - Breakout', title='Trend Surfers - Premium Breakout', overlay=true, calc_on_every_tick=false, initial_capital=100000, default_qty_type=strategy.percent_of_equity, default_qty_value=100, commission_type='percent', commission_value=0.04)

// Risk for position and pyramid
maxriskval = input.float(2, 'Max % risk', tooltip='Risk % over total equity / Position', group='Risk Management')
pairnumber = input.int(title='How many pairs', defval=1, tooltip='How many pairs are you trading with the strategy?', group='Risk Management')

// Emtry Exit
highPeriod = input.int(title='Highest High Period', defval=168, tooltip='Highest High of X bars - This will trigger a Long Entry when close is above. (Thin Green Line)', group='Entry Condition')
lowPeriod = input.int(title='Lowest Low Period', defval=168, tooltip='Lowest low of X bars - This will trigger a Short Entry when close is under. (Thin Red Line)', group='Entry Condition')
// Stoploss
trailingAtrPeriod = input.int(title='Trailing ATR Pediod', defval=10, tooltip='Average True Range for the Trailing Stop. (Thick Green Line) ', group='Exit Condition')
trailingAtrMultiplier = input.float(title='Trailing ATR Multiplier', defval=8, group='Exit Condition')
fixAtrPeriod = input.int(title='Fix ATR Pediod', defval=10, tooltip='Average True Range for the Fix Stoloss. (Thick Yellow Line)', group='Exit Condition')
fixAtrMultiplier = input.float(title='Fix ATR Multiplier', defval=2, group='Exit Condition')
// Pair info
pair = syminfo.basecurrency + syminfo.currency

// High Low Variable
highestHigh = ta.highest(high, highPeriod)[1]
lowestLow = ta.lowest(low, lowPeriod)[1]
trailingAtr = ta.atr(trailingAtrPeriod) * trailingAtrMultiplier

// Trade Condition
longConditionTrendSurfers = ta.crossover(close, highestHigh)
shortConditionTrendSurfers = ta.crossunder(close, lowestLow)

// Risk Variable
fixAtr = ta.atr(fixAtrPeriod) * fixAtrMultiplier
stopvaluelong = close[1] - fixAtr[1]
stopvalueshort = close[1] + fixAtr[1]

// Position size Long
maxpossize = strategy.equity / close
positionsizelong = maxriskval / 100 * strategy.equity / (close - stopvaluelong)
stopperclong = (close - stopvaluelong) / close * 100
leveragelong = math.max(1, math.ceil(positionsizelong / maxpossize)) * 2
posperclong = positionsizelong * close / strategy.equity * 100 / leveragelong / pairnumber
realposlong = posperclong / 100 * strategy.equity * leveragelong / close

// Position size Short
positionsizeshort = maxriskval / 100 * strategy.equity / (stopvalueshort - close)
stoppercshort = (close - stopvalueshort) / close * 100
leverageshort = math.max(1, math.ceil(positionsizeshort / maxpossize)) * 2
pospercshort = positionsizeshort * close / strategy.equity * 100 / leverageshort / pairnumber
realposshort = pospercshort / 100 * strategy.equity * leverageshort / close

// Alert Message
entry_long_message = '\nGo Long for ' + pair + 'NOW!' + '\nPosition Size % =' + str.tostring(posperclong) + '\nLeverage' + str.tostring(leveragelong) + '\nStoploss Price =' + str.tostring(stopvaluelong) + '\nClose any Short position that are open for ' + pair + '!' + '\n\nVisit TrendSurfersSignals.com' + '\nFor automated premium signals (FREE)'

entry_short_message = '\nGo Short for ' + pair + 'NOW!' + '\nPosition Size % =' + str.tostring(pospercshort) + '\nLeverage' + str.tostring(leverageshort) + '\nStoploss Price =' + str.tostring(stopvalueshort) + '\nClose any Long position that are open for ' + pair + '!' + '\n\nVisit TrendSurfersSignals.com' + '\nFor automated premium signals (FREE)'

exit_short_message = '\nExit Short for ' + pair + 'NOW!' + '\n\nVisit TrendSurfersSignals.com' + '\nFor automated premium signals (FREE)'

exit_long_message = '\nExit Long for ' + pair + 'NOW!' + '\n\nVisit TrendSurfersSignals.com' + '\nFor automated premium signals (FREE)'
// Order
// if longCondition
//     strategy.entry('Long', strategy.long, stop=highestHigh, comment='Long', qty=realposlong, alert_message=entry_long_message)
// if shortCondition
//     strategy.entry('Short', strategy.short, stop=lowestLow, comment='Short', qty=realposshort, alert_message=entry_short_message)

// Stoploss Trailing
longTrailing = close - trailingAtr
shortTrailing = close + trailingAtr

var longTrailingStop = 0.0
var shortTrailingStop = 999999.9

trailingStopLine = 0.0
trailingStopLine := na
fixedStopLine = 0.0
fixedStopLine := na
var inTrade = 0
if longConditionTrendSurfers or shortConditionTrendSurfers
    if 0 == inTrade
        if longConditionTrendSurfers
            inTrade := 1
            inTrade
        else
            inTrade := -1
            inTrade
if 1 == inTrade and (shortConditionTrendSurfers or low <= math.max(fixedStopLine[1], longTrailingStop))
    inTrade := 0
    inTrade
if -1 == inTrade and (longConditionTrendSurfers or high >= math.min(fixedStopLine[1], shortTrailingStop))
    inTrade := 0
    inTrade

longTrailingStop := if 1 == inTrade
    stopValue = longTrailing
    math.max(stopValue, longTrailingStop[1])
else
    0

shortTrailingStop := if -1 == inTrade
    stopValue = shortTrailing
    math.min(stopValue, shortTrailingStop[1])
else
    999999

// Fix Stoploss
firstPrice = 0.0
firstFixAtr = 0.0
firstPrice := na
firstFixAtr := na
if 0 != inTrade
    firstPrice := ta.valuewhen(inTrade != inTrade[1] and 0 != inTrade, close, 0)
    firstFixAtr := ta.valuewhen(inTrade != inTrade[1] and 0 != inTrade, fixAtr, 0)
    if 1 == inTrade
        fixedStopLine := firstPrice - firstFixAtr
        trailingStopLine := longTrailingStop
        trailingStopLine
    else
        fixedStopLine := firstPrice + firstFixAtr
        trailingStopLine := shortTrailingStop
        trailingStopLine

// if strategy.position_size > 0
//     strategy.exit(id='L Stop', stop=math.max(fixedStopLine, longTrailingStop), alert_message=exit_long_message)

// if strategy.position_size < 0
//     strategy.exit(id='S Stop', stop=math.min(fixedStopLine, shortTrailingStop), alert_message=exit_short_message)


// Plot
plot(highestHigh, color=color.new(color.green, 0), linewidth=1, title='Highest High')
plot(lowestLow, color=color.new(color.red, 0), linewidth=1, title='Lowest Low')
plot(trailingStopLine, color=color.new(color.lime, 0), linewidth=2, offset=1, title='Trailing Stop')
plot(fixedStopLine, color=color.new(color.orange, 0), linewidth=2, offset=1, title='Fixed Stop')

// Trend Surfers Trailing stop line goes above (Crossesover) highest high
// Bearish Candle (red)
// Mawreeze Trend Oscilator Indicator is red

trendSurfersShortEntry = trailingStopLine > highestHigh and close < close[1]
trendSurfersLongEntry = trailingStopLine < lowestLow and close > close[1]


//@version=5

// Taken from the TradingView house rules regarding scripts:

// "All open source scripts that do not mention a specific open source license
// in their comments are licensed under the Mozilla Public License 2.0.
// Following the Mozilla License, any script reusing open source code originally
// published by someone else must also be open source, unless specific
// permission is granted by the original author."

//indicator('Mawreez\' Trend Oscillator', precision=3)

len = input.int(title='DI Length', minval=1, defval=14)
sens = input.float(title='Sensitivity', defval=25)

// Lag-free smoothing of a given series
smooth(series, len) =>
    f28 = ta.ema(series, len)
    f30 = ta.ema(f28, len)
    vC = f28 * 1.5 - f30 * 0.5
    f38 = ta.ema(vC, len)
    f40 = ta.ema(f38, len)
    v10 = f38 * 1.5 - f40 * 0.5
    f48 = ta.ema(v10, len)
    f50 = ta.ema(f48, len)
    f48 * 1.5 - f50 * 0.5

// Constructing the +DI and -DI
up = ta.change(high)
down = -ta.change(low)
plus_dm = up > 0 and up > down ? up : 0
minus_dm = down > 0 and down > up ? down : 0
range_1 = ta.rma(ta.tr, len)
plus_di = smooth(ta.rma(plus_dm, len) / range_1, 3)
minus_di = smooth(ta.rma(minus_dm, len) / range_1, 3)

// Constructing and plotting the modified ADX
adj_adx = 100 * math.abs(plus_di - minus_di) / (plus_di + minus_di) - sens
adj_adx := (minus_di > plus_di ? -1 : 1) * (adj_adx < 0 ? 0 : adj_adx)
//plot(smooth(adj_adx, 3), color=plus_di > minus_di ? color.green : color.red, style=plot.style_columns)

trendOscShortEntry = plus_di < minus_di
trendOscLongEntry = plus_di > minus_di


//////////////////////////////////////
//* Put your strategy rules below *//
/////////////////////////////////////

longCondition = trendSurfersLongEntry and trendOscLongEntry
shortCondition = trendSurfersShortEntry and trendOscShortEntry

//define as 0 if do not want to use
closeLongCondition = 0
closeShortCondition = 0


// ADX
//░░░░░░░░░░░░░░░░░░░░░░░░░░░░░░░░░░░░░░░░░░░░░░░░░░░░░░░░░░░░░░░░░░░░░░░░░░░░░░░░░░░░░░░░░░░░░░░░░░░░░░░░░░░░░░░░░░░░░░░░░░░░░░░░░░░░░░░░░░░░░░░░░░

adxEnabled = input.bool(defval = false , title = "Average Directional Index (ADX)", tooltip = "", group ="ADX" )
adxlen = input(14, title="ADX Smoothing", group="ADX")
adxdilen = input(14, title="DI Length", group="ADX")
adxabove = input(25, title="ADX Threshold", group="ADX")

adxdirmov(len) =>
	adxup = ta.change(high)
	adxdown = -ta.change(low)
	adxplusDM = na(adxup) ? na : (adxup > adxdown and adxup > 0 ? adxup : 0)
	adxminusDM = na(adxdown) ? na : (adxdown > adxup and adxdown > 0 ? adxdown : 0)
	adxtruerange = ta.rma(ta.tr, len)
	adxplus = fixnan(100 * ta.rma(adxplusDM, len) / adxtruerange)
	adxminus = fixnan(100 * ta.rma(adxminusDM, len) / adxtruerange)
	[adxplus, adxminus]
adx(adxdilen, adxlen) =>
	[adxplus, adxminus] = adxdirmov(adxdilen)
	adxsum = adxplus + adxminus
	adx = 100 * ta.rma(math.abs(adxplus - adxminus) / (adxsum == 0 ? 1 : adxsum), adxlen)

adxsig = adxEnabled ? adx(adxdilen, adxlen) : na
isADXEnabledAndAboveThreshold = adxEnabled ? (adxsig > adxabove) : true

//Backtesting Time Period (Input.time not working as expected as of 03/30/2021.  Giving odd start/end dates
//░░░░░░░░░░░░░░░░░░░░░░░░░░░░░░░░░░░░░░░░░░░░░░░░░░░░░░░░░░░░░░░░░░░░░░░░░░░░░░░░░░░░░░░░░░░░░░░░░░░░░░░░░░░░░░░░░░░░░░░░░░░░░░░░░░░░░░░░░░░░░░░░░░
useStartPeriodTime = input.bool(true, 'Start', group='Date Range', inline='Start Period')
startPeriodTime = input(timestamp('1 Jan 2019'), '', group='Date Range', inline='Start Period')
useEndPeriodTime = input.bool(true, 'End', group='Date Range', inline='End Period')
endPeriodTime = input(timestamp('31 Dec 2030'), '', group='Date Range', inline='End Period')

start = useStartPeriodTime ? startPeriodTime >= time : false
end = useEndPeriodTime ? endPeriodTime <= time : false
calcPeriod = true

// Trade Direction
// ░░░░░░░░░░░░░░░░░░░░░░░░░░░░░░░░░░░░░░░░░░░░░░░░░░░░░░░░░░░░░░░░░░░░░░░░░░░░░░░░░░░░░░░░░░░░░░░░░░░░░░░░░░░░░░░░░░░░░░░░░░░░░░░░░░░░░░░░░░░░░░░░░░
tradeDirection = input.string('Long and Short', title='Trade Direction', options=['Long and Short', 'Long Only', 'Short Only'], group='Trade Direction')

// Percent as Points
// ░░░░░░░░░░░░░░░░░░░░░░░░░░░░░░░░░░░░░░░░░░░░░░░░░░░░░░░░░░░░░░░░░░░░░░░░░░░░░░░░░░░░░░░░░░░░░░░░░░░░░░░░░░░░░░░░░░░░░░░░░░░░░░░░░░░░░░░░░░░░░░░░░░
per(pcnt) =>
    strategy.position_size != 0 ? math.round(pcnt / 100 * strategy.position_avg_price / syminfo.mintick) : float(na)

// Take profit 1
// ░░░░░░░░░░░░░░░░░░░░░░░░░░░░░░░░░░░░░░░░░░░░░░░░░░░░░░░░░░░░░░░░░░░░░░░░░░░░░░░░░░░░░░░░░░░░░░░░░░░░░░░░░░░░░░░░░░░░░░░░░░░░░░░░░░░░░░░░░░░░░░░░░░
tp1 = input.float(title='Take Profit 1 - Target %', defval=100, minval=0.0, step=0.5, group='Take Profit', inline='Take Profit 1')
q1 = input.int(title='% Of Position', defval=100, minval=0, group='Take Profit', inline='Take Profit 1')

// Take profit 2
// ░░░░░░░░░░░░░░░░░░░░░░░░░░░░░░░░░░░░░░░░░░░░░░░░░░░░░░░░░░░░░░░░░░░░░░░░░░░░░░░░░░░░░░░░░░░░░░░░░░░░░░░░░░░░░░░░░░░░░░░░░░░░░░░░░░░░░░░░░░░░░░░░░░
tp2 = input.float(title='Take Profit 2 - Target %', defval=100, minval=0.0, step=0.5, group='Take Profit', inline='Take Profit 2')
q2 = input.int(title='% Of Position', defval=100, minval=0, group='Take Profit', inline='Take Profit 2')

// Take profit 3
// ░░░░░░░░░░░░░░░░░░░░░░░░░░░░░░░░░░░░░░░░░░░░░░░░░░░░░░░░░░░░░░░░░░░░░░░░░░░░░░░░░░░░░░░░░░░░░░░░░░░░░░░░░░░░░░░░░░░░░░░░░░░░░░░░░░░░░░░░░░░░░░░░░░
tp3 = input.float(title='Take Profit 3 - Target %', defval=100, minval=0.0, step=0.5, group='Take Profit', inline='Take Profit 3')
q3 = input.int(title='% Of Position', defval=100, minval=0, group='Take Profit', inline='Take Profit 3')

// Take profit 4
// ░░░░░░░░░░░░░░░░░░░░░░░░░░░░░░░░░░░░░░░░░░░░░░░░░░░░░░░░░░░░░░░░░░░░░░░░░░░░░░░░░░░░░░░░░░░░░░░░░░░░░░░░░░░░░░░░░░░░░░░░░░░░░░░░░░░░░░░░░░░░░░░░░░
tp4 = input.float(title='Take Profit 4 - Target %', defval=100, minval=0.0, step=0.5, group='Take Profit')

/// Stop Loss
// ░░░░░░░░░░░░░░░░░░░░░░░░░░░░░░░░░░░░░░░░░░░░░░░░░░░░░░░░░░░░░░░░░░░░░░░░░░░░░░░░░░░░░░░░░░░░░░░░░░░░░░░░░░░░░░░░░░░░░░░░░░░░░░░░░░░░░░░░░░░░░░░░░░
stoplossPercent = input.float(title='Stop Loss (%)', defval=999, minval=0.01, group='Stop Loss') * 0.01
slLongClose = close < strategy.position_avg_price * (1 - stoplossPercent)
slShortClose = close > strategy.position_avg_price * (1 + stoplossPercent)

/// Leverage
// ░░░░░░░░░░░░░░░░░░░░░░░░░░░░░░░░░░░░░░░░░░░░░░░░░░░░░░░░░░░░░░░░░░░░░░░░░░░░░░░░░░░░░░░░░░░░░░░░░░░░░░░░░░░░░░░░░░░░░░░░░░░░░░░░░░░░░░░░░░░░░░░░░░
leverage = input.float(1, 'Leverage', step=.5, group='Leverage')
contracts = math.min(math.max(.000001, strategy.equity / close * leverage), 1000000000)


/// Trade State Management
// ░░░░░░░░░░░░░░░░░░░░░░░░░░░░░░░░░░░░░░░░░░░░░░░░░░░░░░░░░░░░░░░░░░░░░░░░░░░░░░░░░░░░░░░░░░░░░░░░░░░░░░░░░░░░░░░░░░░░░░░░░░░░░░░░░░░░░░░░░░░░░░░░░░

isInLongPosition = strategy.position_size > 0
isInShortPosition = strategy.position_size < 0

/// ProfitView Alert Syntax String Generation
// ░░░░░░░░░░░░░░░░░░░░░░░░░░░░░░░░░░░░░░░░░░░░░░░░░░░░░░░░░░░░░░░░░░░░░░░░░░░░░░░░░░░░░░░░░░░░░░░░░░░░░░░░░░░░░░░░░░░░░░░░░░░░░░░░░░░░░░░░░░░░░░░░░░

alertSyntaxPrefix = input.string(defval='CRYPTANEX_99FTX_Strategy-Name-Here', title='Alert Syntax Prefix', group='ProfitView Alert Syntax')
alertSyntaxBase = alertSyntaxPrefix + '\n#' + str.tostring(open) + ',' + str.tostring(high) + ',' + str.tostring(low) + ',' + str.tostring(close) + ',' + str.tostring(volume) + ','


/// Trade Execution
// ░░░░░░░░░░░░░░░░░░░░░░░░░░░░░░░░░░░░░░░░░░░░░░░░░░░░░░░░░░░░░░░░░░░░░░░░░░░░░░░░░░░░░░░░░░░░░░░░░░░░░░░░░░░░░░░░░░░░░░░░░░░░░░░░░░░░░░░░░░░░░░░░░░

longConditionCalc = (longCondition and isADXEnabledAndAboveThreshold)
shortConditionCalc = (shortCondition and isADXEnabledAndAboveThreshold)

if calcPeriod
    if longConditionCalc and tradeDirection != 'Short Only' and isInLongPosition == false
        strategy.entry('Long', strategy.long, qty=contracts)

        alert(message=alertSyntaxBase + 'side:long', freq=alert.freq_once_per_bar_close)

    if shortConditionCalc and tradeDirection != 'Long Only' and isInShortPosition == false
        strategy.entry('Short', strategy.short, qty=contracts)

        alert(message=alertSyntaxBase + 'side:short', freq=alert.freq_once_per_bar_close)

    //Inspired from Multiple %% profit exits example by adolgo https://www.tradingview.com/script/kHhCik9f-Multiple-profit-exits-example/
    strategy.exit('TP1', qty_percent=q1, profit=per(tp1))
    strategy.exit('TP2', qty_percent=q2, profit=per(tp2))
    strategy.exit('TP3', qty_percent=q3, profit=per(tp3))
    strategy.exit('TP4', profit=per(tp4))

    strategy.close('Long', qty_percent=100, comment='SL Long', when=slLongClose)
    strategy.close('Short', qty_percent=100, comment='SL Short', when=slShortClose)

    strategy.close_all(when=closeLongCondition or closeShortCondition, comment='Close Postion')

/// Dashboard
// ░░░░░░░░░░░░░░░░░░░░░░░░░░░░░░░░░░░░░░░░░░░░░░░░░░░░░░░░░░░░░░░░░░░░░░░░░░░░░░░░░░░░░░░░░░░░░░░░░░░░░░░░░░░░░░░░░░░░░░░░░░░░░░░░░░░░░░░░░░░░░░░░░░
// Inspired by https://www.tradingview.com/script/uWqKX6A2/ - Thanks VertMT

showDashboard = input.bool(group="Dashboard", title="Show Dashboard", defval=false)

f_fillCell(_table, _column, _row, _title, _value, _bgcolor, _txtcolor) =>
    _cellText = _title + "\n" + _value
    table.cell(_table, _column, _row, _cellText, bgcolor=_bgcolor, text_color=_txtcolor, text_size=size.auto)

// Draw dashboard table
if showDashboard
    var bgcolor = color.new(color.black,0)

    // Keep track of Wins/Losses streaks
    newWin  = (strategy.wintrades  > strategy.wintrades[1]) and (strategy.losstrades == strategy.losstrades[1]) and (strategy.eventrades == strategy.eventrades[1])
    newLoss = (strategy.wintrades == strategy.wintrades[1]) and (strategy.losstrades  > strategy.losstrades[1]) and (strategy.eventrades == strategy.eventrades[1])

    varip int winRow     = 0
    varip int lossRow    = 0
    varip int maxWinRow  = 0
    varip int maxLossRow = 0

    if newWin
        lossRow := 0
        winRow := winRow + 1
    if winRow > maxWinRow
        maxWinRow := winRow

    if newLoss
        winRow := 0
        lossRow := lossRow + 1
    if lossRow > maxLossRow
        maxLossRow := lossRow


    // Prepare stats table
    var table dashTable = table.new(position.bottom_right, 1, 15, border_width=1)


    if barstate.islastconfirmedhistory
        // Update table
        dollarReturn = strategy.netprofit
        f_fillCell(dashTable, 0, 0, "Start:", str.format("{0,date,long}", strategy.closedtrades.entry_time(0)) , bgcolor, color.white) // + str.format(" {0,time,HH:mm}", strategy.closedtrades.entry_time(0))
        f_fillCell(dashTable, 0, 1, "End:", str.format("{0,date,long}", strategy.opentrades.entry_time(0)) , bgcolor, color.white) // + str.format(" {0,time,HH:mm}", strategy.opentrades.entry_time(0))
        _profit = (strategy.netprofit / strategy.initial_capital) * 100
        f_fillCell(dashTable, 0, 2, "Net Profit:", str.tostring(_profit, '##.##') + "%", _profit > 0 ? color.green : color.red, color.white)
        _numOfDaysInStrategy = (strategy.opentrades.entry_time(0) - strategy.closedtrades.entry_time(0)) / (1000 * 3600 * 24)
        f_fillCell(dashTable, 0, 3, "Percent Per Day", str.tostring(_profit / _numOfDaysInStrategy, '#########################.#####')+"%", _profit > 0 ? color.green : color.red, color.white)
        _winRate = ( strategy.wintrades / strategy.closedtrades ) * 100
        f_fillCell(dashTable, 0, 4, "Percent Profitable:", str.tostring(_winRate, '##.##') + "%", _winRate < 50 ? color.red : _winRate < 75 ? #999900 : color.green, color.white)
        f_fillCell(dashTable, 0, 5, "Profit Factor:", str.tostring(strategy.grossprofit / strategy.grossloss,  '##.###'), strategy.grossprofit > strategy.grossloss ? color.green : color.red, color.white)
        f_fillCell(dashTable, 0, 6, "Total Trades:", str.tostring(strategy.closedtrades), bgcolor, color.white)
        f_fillCell(dashTable, 0, 8, "Max Wins In A Row:", str.tostring(maxWinRow, '######') , bgcolor, color.white)
        f_fillCell(dashTable, 0, 9, "Max Losses In A Row:", str.tostring(maxLossRow, '######') , bgcolor, color.white)