Стратегия динамического трейлинг-стоп-лосса
Обзор
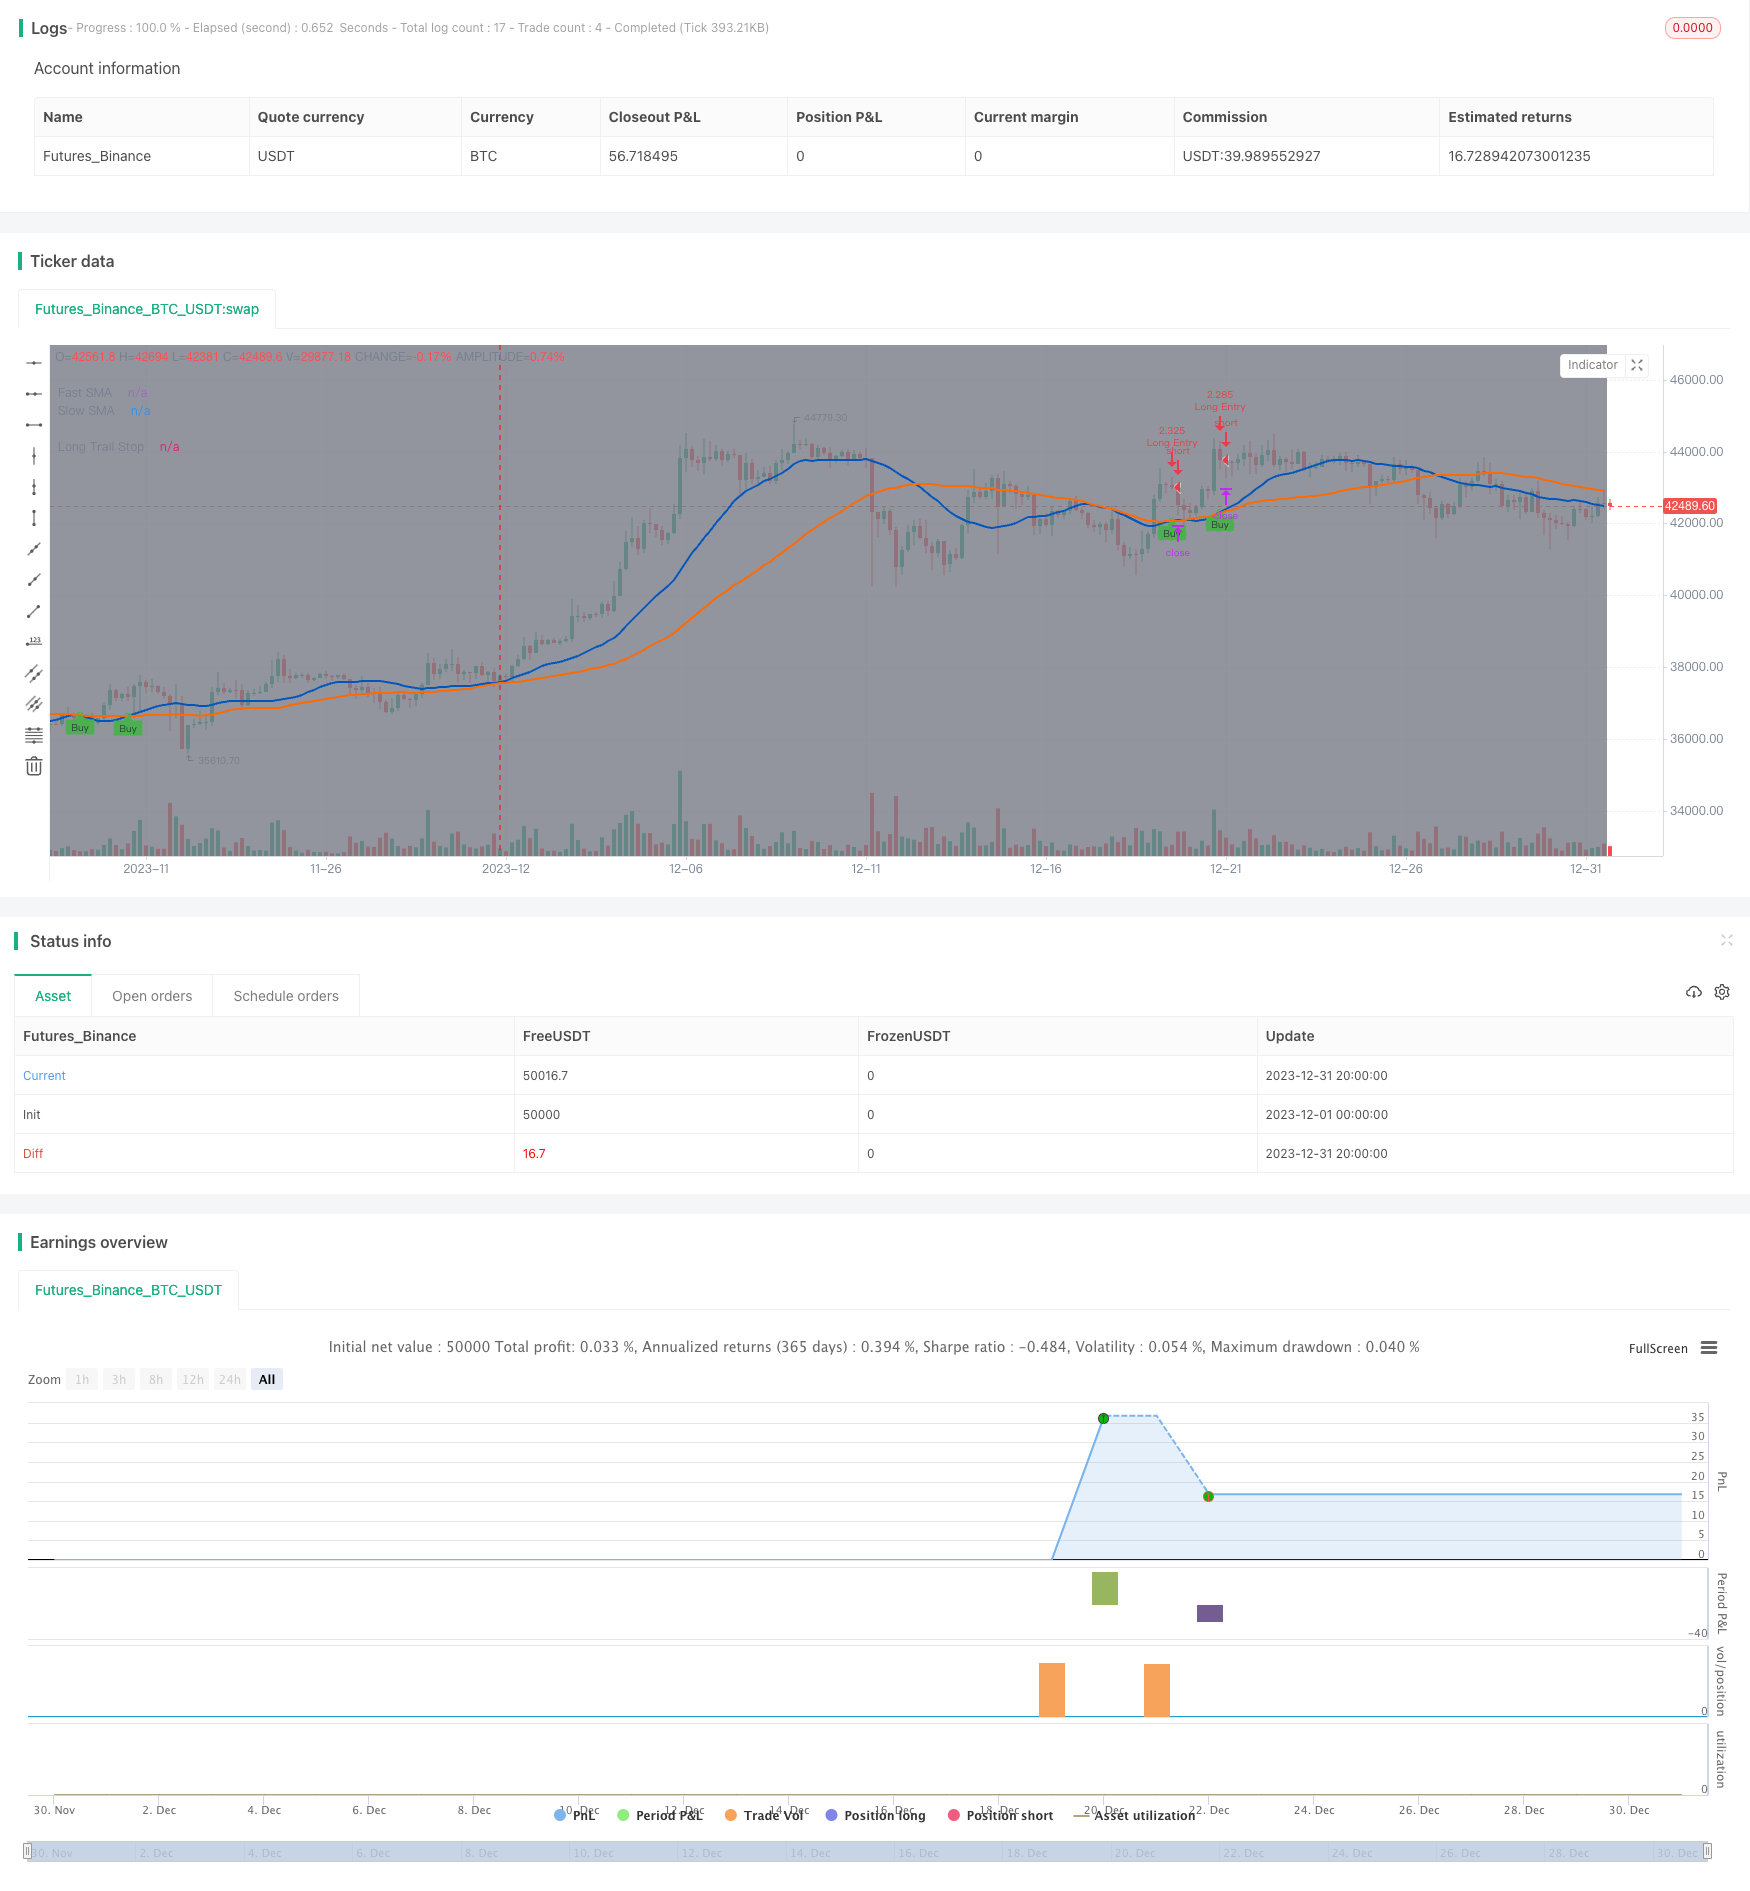
Эта стратегия определяет тренды, рассчитывая перекрестные скоростные и медленные скользящие средние, делает больше при пересечении медленных скользящих средних по скоростным скользящим средним, и устанавливает динамически отслеживаемую линию остановки для блокирования прибыли, с остановкой и выходом при определенном пропорциональном изменении цены.
Стратегический принцип
Эта стратегия использует быстрое и медленное движение среднего среднего, чтобы определить начало многообещающего тренда. В частности, это простое движение среднего значения, рассчитанного на цене закрытия в течение определенного периода, сравнивая значение быстрого среднего и медленного среднего значения, когда быстрое движение среднего пересекает медленное движение среднего, чтобы определить начало многообещающего тренда, и тогда открыть позицию.
После открытия позиции, чтобы сделать больше, стратегия не устанавливает фиксированный стоп-лосс, а использует динамически отслеживаемую стоп-линию для блокировки прибыли. Метод установки этой стоп-линии:*(1-установленный процент стоп-лора) │ таким образом можно позволить стоп-линии расти по мере роста цены, а при падении определенной пропорции стоп-лора выйти │
Преимущества этого метода заключаются в том, что прибыль может быть получена без ограничений и может быть заблокирована с помощью стоп-лосса после достижения определенного уровня прибыли.
Анализ преимуществ
Основными преимуществами стоп-стратегии динамического отслеживания потерь являются:
Можно бесконечно отслеживать, не упуская больших событий. При использовании фиксированного стоп-ущерба легко быть остановленным после начала больших событий.
Можно блокировать прибыль, установив процент стоп-лосса. Если только отслеживать не стоп-лосса, то весь рынок может быть потерян в конце. Установка стоп-лосса может блокировать прибыль.
Более гибкий, чем фиксированный стоп. Фиксированный стоп может устанавливать только одну цену, а здесь стоп изменяется в зависимости от максимальной цены.
Риск отмены меньше. При использовании фиксированного стоп-ущерба цена стоп-ущерба находится на большом расстоянии от максимальной цены, и в нормальном отзыве она может быть остановлена.
Анализ рисков
Однако эта стратегия также несет в себе некоторые риски:
Показатели входного сигнала могут быть неустойчивыми, что может привести к ошибочному сигналу.
Единственный способ остановки убытков, без учета других факторов. Рынок может внезапно измениться, что приведет к неэффективности стратегии.
Нет ограничений на остановку, зависит от остановки убытков. Если остановка не сработает, это может привести к большим убыткам.
Оптимизация данных. Параметры, такие как циклы скользящих средних, должны быть настроены на оптимальные.
Направление оптимизации
Эта стратегия также может быть оптимизирована в следующих аспектах:
Добавить дополнительные показатели для подтверждения поступления, чтобы избежать ошибочных сигналов, например, добавление количества сделок.
Увеличение параметров остановки. Остановка при достижении определенной доли дохода.
Повышение безопасности приостановки убытков. Значительная корректировка расстояния приостановки убытков при возникновении аномалий на рынке.
Оптимизируются параметры для различных типов и периодов торгов.
Добавление машинного обучения для динамической корректировки параметров. Пусть модель автоматически оптимизирует показатели суждения и степень остановки.
Подвести итог
Общая концепция стратегии ясна и обоснована. Использование быстрого и медленного среднелинейного суждения о тенденции является более классическим методом, а использование метода динамического отслеживания остановки может эффективно блокировать прибыль и снижать риск. Однако эти показатели и параметры должны постоянно тестироваться и оптимизироваться, чтобы стратегия была стабильно прибыльной.
/*backtest
start: 2023-12-01 00:00:00
end: 2023-12-31 23:59:59
period: 4h
basePeriod: 15m
exchanges: [{"eid":"Futures_Binance","currency":"BTC_USDT"}]
*/

//@version=4
//
// ▒▒▒▒▒▒▒▒▒▒▒▒▒▒▒▒▒▒▒▒▒▒▒▒▒▒▒▒▒▒▒▒▒▒▒▒▒▒▒▒▒▒▒▒▒▒▒▒▒▒▒▒▒▒▒▒▒▒▒▒▒▒▒▒▒▒▒▒▒▒▒▒▒▒▒▒▒▒▒▒▒▒▒▒▒▒▒▒▒▒▒▒▒▒▒▒▒▒▒▒▒▒▒▒▒▒▒▒▒▒▒▒▒▒
//  -----------------------------------------------------------------------------
//  Copyright 2021 Iason Nikolas | jason5480
//  Trainiling Take Profit Trailing Stop Loss script may be freely distributed under the MIT license.
//
//  Permission is hereby granted, free of charge,
//  to any person obtaining a copy of this software and associated documentation files (the "Software"),
//  to deal in the Software without restriction, including without limitation the rights to use, copy, modify, merge,
//  publish, distribute, sublicense, and/or sell copies of the Software, and to permit persons to whom the Software is furnished to do so,
//  subject to the following conditions:
//
//  The above copyright notice and this permission notice shall be included in all copies or substantial portions of the Software.
//
//  THE SOFTWARE IS PROVIDED "AS IS", WITHOUT WARRANTY OF ANY KIND,
//  EXPRESS OR IMPLIED, INCLUDING BUT NOT LIMITED TO THE WARRANTIES OF MERCHANTABILITY,
//  FITNESS FOR A PARTICULAR PURPOSE AND NONINFRINGEMENT. IN NO EVENT SHALL THE AUTHORS OR COPYRIGHT HOLDERS BE LIABLE FOR ANY CLAIM,
//  DAMAGES OR OTHER LIABILITY, WHETHER IN AN ACTION OF CONTRACT, TORT OR OTHERWISE, ARISING FROM,
//  OUT OF OR IN CONNECTION WITH THE SOFTWARE OR THE USE OR OTHER DEALINGS IN THE SOFTWARE.
//
//  -----------------------------------------------------------------------------
//
//  Authors:  @jason5480
//  Revision: v1.0.0
//  Date:     05-May-2021
//
//  Description
//  =============================================================================
//  This strategy will go long if fast MA crosses over slow MA.
//  The strategy will exit from long position when the price increases by a fixed percentage.
//  If the trailing take profit is checked then the strategy instead of setting a limit order in a predefined price (based on the percentage)
//  it will follow the price with small steps (percentagewise)
//  If the price drops by this percentage then the exit order will be executed
//
//  The strategy has the following parameters:
//
//  Fast SMA Length - How many candles back to calculte the fast SMA.
//  Slow SMA Length - How many candles back to calculte the slow SMA.
//  Enable Trailing - Enable or disable the trailing.
//  Stop Loss % - The percentage of the price decrease to set the stop loss price target for long positions.
//
//  -----------------------------------------------------------------------------
//  Disclaimer:
//    1. I am not licensed financial advisors or broker dealer. I do not tell you
//       when or what to buy or sell. I developed this software which enables you
//       execute manual or automated trades using TradingView. The
//       software allows you to set the criteria you want for entering and exiting
//       trades.
//    2. Do not trade with money you cannot afford to lose.
//    3. I do not guarantee consistent profits or that anyone can make money with no
//       effort. And I am not selling the holy grail.
//    4. Every system can have winning and losing streaks.
//    5. Money management plays a large role in the results of your trading. For
//       example: lot size, account size, broker leverage, and broker margin call
//       rules all have an effect on results. Also, your Take Profit and Stop Loss
//       settings for individual pair trades and for overall account equity have a
//       major impact on results. If you are new to trading and do not understand
//       these items, then I recommend you seek education materials to further your
//       knowledge.
//
//    YOU NEED TO FIND AND USE THE TRADING SYSTEM THAT WORKS BEST FOR YOU AND YOUR
//    TRADING TOLERANCE.
//
//    I HAVE PROVIDED NOTHING MORE THAN A TOOL WITH OPTIONS FOR YOU TO TRADE WITH THIS PROGRAM ON TRADINGVIEW.
//
//    I accept suggestions to improve the script.
//    If you encounter any problems I will be happy to share with me.
//  -----------------------------------------------------------------------------
//
// ▒▒▒▒▒▒▒▒▒▒▒▒▒▒▒▒▒▒▒▒▒▒▒▒▒▒▒▒▒▒▒▒▒▒▒▒▒▒▒▒▒▒▒▒▒▒▒▒▒▒▒▒▒▒▒▒▒▒▒▒▒▒▒▒▒▒▒▒▒▒▒▒▒▒▒▒▒▒▒▒▒▒▒▒▒▒▒▒▒▒▒▒▒▒▒▒▒▒▒▒▒▒▒▒▒▒▒▒▒▒▒▒▒▒
// SETUP ============================================================================================================
strategy(title = "Trailing Stop Loss",
         shorttitle = "TSL",
         overlay = true,
         pyramiding = 0,
         calc_on_every_tick = true,
         default_qty_type = strategy.cash,
         default_qty_value = 100000,
         initial_capital = 100000)

//
// ▒▒▒▒▒▒▒▒▒▒▒▒▒▒▒▒▒▒▒▒▒▒▒▒▒▒▒▒▒▒▒▒▒▒▒▒▒▒▒▒▒▒▒▒▒▒▒▒▒▒▒▒▒▒▒▒▒▒▒▒▒▒▒▒▒▒▒▒▒▒▒▒▒▒▒▒▒▒▒▒▒▒▒▒▒▒▒▒▒▒▒▒▒▒▒▒▒▒▒▒▒▒▒▒▒▒▒▒▒▒▒▒▒▒
// INPUTS ===========================================================================================================

// STRATEGY INPUT ===================================================================================================
fastMALen = input(defval = 21, title = "Fast SMA Length", type = input.integer, group = "Strategy", tooltip = "How many candles back to calculte the fast SMA.")
slowMALen = input(defval = 49, title = "Slow SMA Length", type = input.integer, group = "Strategy", tooltip = "How many candles back to calculte the slow SMA.")

enableStopLossTrailing = input(defval = true, title = "Enable Trailing", type = input.bool, group = "Strategy", tooltip = "Enable or disable the trailing for stop loss.")
longTrailingStopLossPerc = input(defval = 7.5, title = 'Long Stop Loss %', type = input.float, minval = 0.1, maxval = 100, step = 0.1, inline = "Trailing Stop Loss Perc", group = "Strategy") / 100

// BACKTEST PERIOD INPUT ============================================================================================
fromDate = input(defval = timestamp("01 Jan 2021 00:00 UTC"), title = "From Date", type = input.time, minval = timestamp("01 Jan 1970 00:00 UTC"), group = "Backtest Period") // backtest start date
toDate   = input(defval = timestamp("31 Dec 2121 23:59 UTC"), title = "To Date",   type = input.time, minval = timestamp("01 Jan 1970 00:00 UTC"), group = "Backtest Period") // backtest finish date

isWithinBacktestPeriod() => true

// SHOW PLOT INPUT ==================================================================================================
showDate = input(defval = true, title = "Show Backtest Range", type = input.bool, group = "Plot", tooltip = "Gray out the backround of the backtest period.")

//
// ▒▒▒▒▒▒▒▒▒▒▒▒▒▒▒▒▒▒▒▒▒▒▒▒▒▒▒▒▒▒▒▒▒▒▒▒▒▒▒▒▒▒▒▒▒▒▒▒▒▒▒▒▒▒▒▒▒▒▒▒▒▒▒▒▒▒▒▒▒▒▒▒▒▒▒▒▒▒▒▒▒▒▒▒▒▒▒▒▒▒▒▒▒▒▒▒▒▒▒▒▒▒▒▒▒▒▒▒▒▒▒▒▒▒
// STRATEGY LOGIC ===================================================================================================

fastMA = sma(close, fastMALen)
slowMA = sma(close, slowMALen)

bool startLongDeal = crossover(fastMA, slowMA)

bool longIsActive = startLongDeal or strategy.position_size > 0

// determine trailing stop loss price
float longTrailingStopLossPrice = na
longTrailingStopLossPrice := if (longIsActive)
    stopValue = high * (1 - longTrailingStopLossPerc)
    max(stopValue, nz(longTrailingStopLossPrice[1]))
else
    na

//
// ▒▒▒▒▒▒▒▒▒▒▒▒▒▒▒▒▒▒▒▒▒▒▒▒▒▒▒▒▒▒▒▒▒▒▒▒▒▒▒▒▒▒▒▒▒▒▒▒▒▒▒▒▒▒▒▒▒▒▒▒▒▒▒▒▒▒▒▒▒▒▒▒▒▒▒▒▒▒▒▒▒▒▒▒▒▒▒▒▒▒▒▒▒▒▒▒▒▒▒▒▒▒▒▒▒▒▒▒▒▒▒▒▒▒
// STRATEGY EXECUTION ===============================================================================================

if (isWithinBacktestPeriod())
    // getting into LONG position
    strategy.entry(id = "Long Entry", long = strategy.long, when = startLongDeal, alert_message = "Long(" + syminfo.ticker + "): Started")
    // submit exit orders for trailing stop loss price
    strategy.exit(id = "Long Stop Loss", from_entry = "Long Entry", stop = longTrailingStopLossPrice, when = longIsActive, alert_message = "Long(" + syminfo.ticker + "): Stop Loss activated")


//
// ▒▒▒▒▒▒▒▒▒▒▒▒▒▒▒▒▒▒▒▒▒▒▒▒▒▒▒▒▒▒▒▒▒▒▒▒▒▒▒▒▒▒▒▒▒▒▒▒▒▒▒▒▒▒▒▒▒▒▒▒▒▒▒▒▒▒▒▒▒▒▒▒▒▒▒▒▒▒▒▒▒▒▒▒▒▒▒▒▒▒▒▒▒▒▒▒▒▒▒▒▒▒▒▒▒▒▒▒▒▒▒▒▒▒
// PLOT DATE POSITION MA AND TRAILING TAKE PROFIT STOP LOSS =========================================================

bgcolor(color = showDate and isWithinBacktestPeriod() ? color.gray : na, transp = 90)

plot(series = fastMA, title = "Fast SMA", color = #0056BD, linewidth = 2, style = plot.style_line)
plot(series = slowMA, title = "Slow SMA", color = #FF6A00, linewidth = 2, style = plot.style_line)
plotshape(series = isWithinBacktestPeriod() and startLongDeal and strategy.position_size <= 0 ? fastMA : na, title = "UpTrend Begins", style = shape.circle, location = location.absolute, color = color.green, transp = 0, size = size.tiny)
plotshape(series = isWithinBacktestPeriod() and startLongDeal and strategy.position_size <= 0 ? fastMA : na, title = "Buy", text = "Buy", style = shape.labelup, location = location.absolute, color = color.green, textcolor = color.black, transp = 0, size = size.tiny)

plot(series = strategy.position_avg_price, title = "Position", color = color.blue, linewidth = 2, style = plot.style_linebr, offset = 1)
plot(series = longTrailingStopLossPrice, title = "Long Trail Stop", color = color.fuchsia, linewidth = 2, style = plot.style_linebr, offset = 1)

// ==================================================================================================================