Динамическая стратегия поддержки и сопротивления CCI
Обзор
Эта стратегия использует точки CCI для вычисления динамических уровней поддержки и сопротивления в сочетании с оценкой тенденции для поиска сигналов покупки и продажи. Эта стратегия объединяет обратные характеристики CCI и способность отслеживать тенденции, чтобы получить прибыль от перемен в среднесрочной тенденции.
Стратегический принцип
Индекс CCI позволяет определить, является ли рынок слишком слабым или слишком сильным. Эти два предельных значения, 80 и 80, могут быть использованы для определения того, переходит ли рынок в состояние перекупки или перепродажи.
Сигнал покупки генерируется, когда цена закрытия выше цены открытия и ниже верхней линии поддержки; сигнал продажи генерируется, когда цена закрытия ниже цены открытия и выше нижней линии сопротивления. Чтобы отфильтровать торговые сигналы в направлении неглавных тенденций, стратегия также использует EMA и индикатор наклонности для определения направления текущей основной тенденции.
Стоп-лост и стоп-стоп основаны на динамических расчетах ATR, что делает контроль риска этой стратегии более разумным.
Анализ преимуществ
- Используйте обратную характеристику индекса CCI, чтобы купить и продать вблизи обратной точки, чтобы увеличить вероятность получения прибыли.
- В сочетании с оценкой тенденций, избегайте противоположных операций и уменьшите потери.
- Динамическая установка Stop Loss Stopper позволяет более рационально контролировать риск.
- Настраиваемые параметры, такие как цикл CCI, размер буферной зоны и т. Д., Приспосабливаются к более широким рыночным условиям.
Анализ рисков
- Индекс CCI может создавать ложные сигналы, поэтому его необходимо отфильтровывать.
- Не всегда удачно, но есть вероятность потерь.
- Неправильная настройка параметров может привести к слишком частым сделкам или пропущенным торговым возможностям.
Снижение риска может быть достигнуто путем оптимизации параметров, корректировки стоп-лосс. Кроме того, эта стратегия может быть использована в качестве вспомогательного инструмента для других индикаторов, без необходимости полностью полагаться на их торговые сигналы.
Направление оптимизации
- Оптимизация размера буферных зон для рынков с различными волатильностями.
- Оптимизация параметров цикла ATR для более точного динамического остановки убытков.
- Попробуйте различные параметры CCI.
- Тестирование эффективности других типов трендовых индикаторов.
Подвести итог
Эта стратегия объединяет многопространственную способность отбора показателей CCI с подтверждением фильтрации для определения тенденции, что имеет некоторую практическую ценность. Динамическая стоп-стоп также делает стратегию управляемой риском в реальном применении.
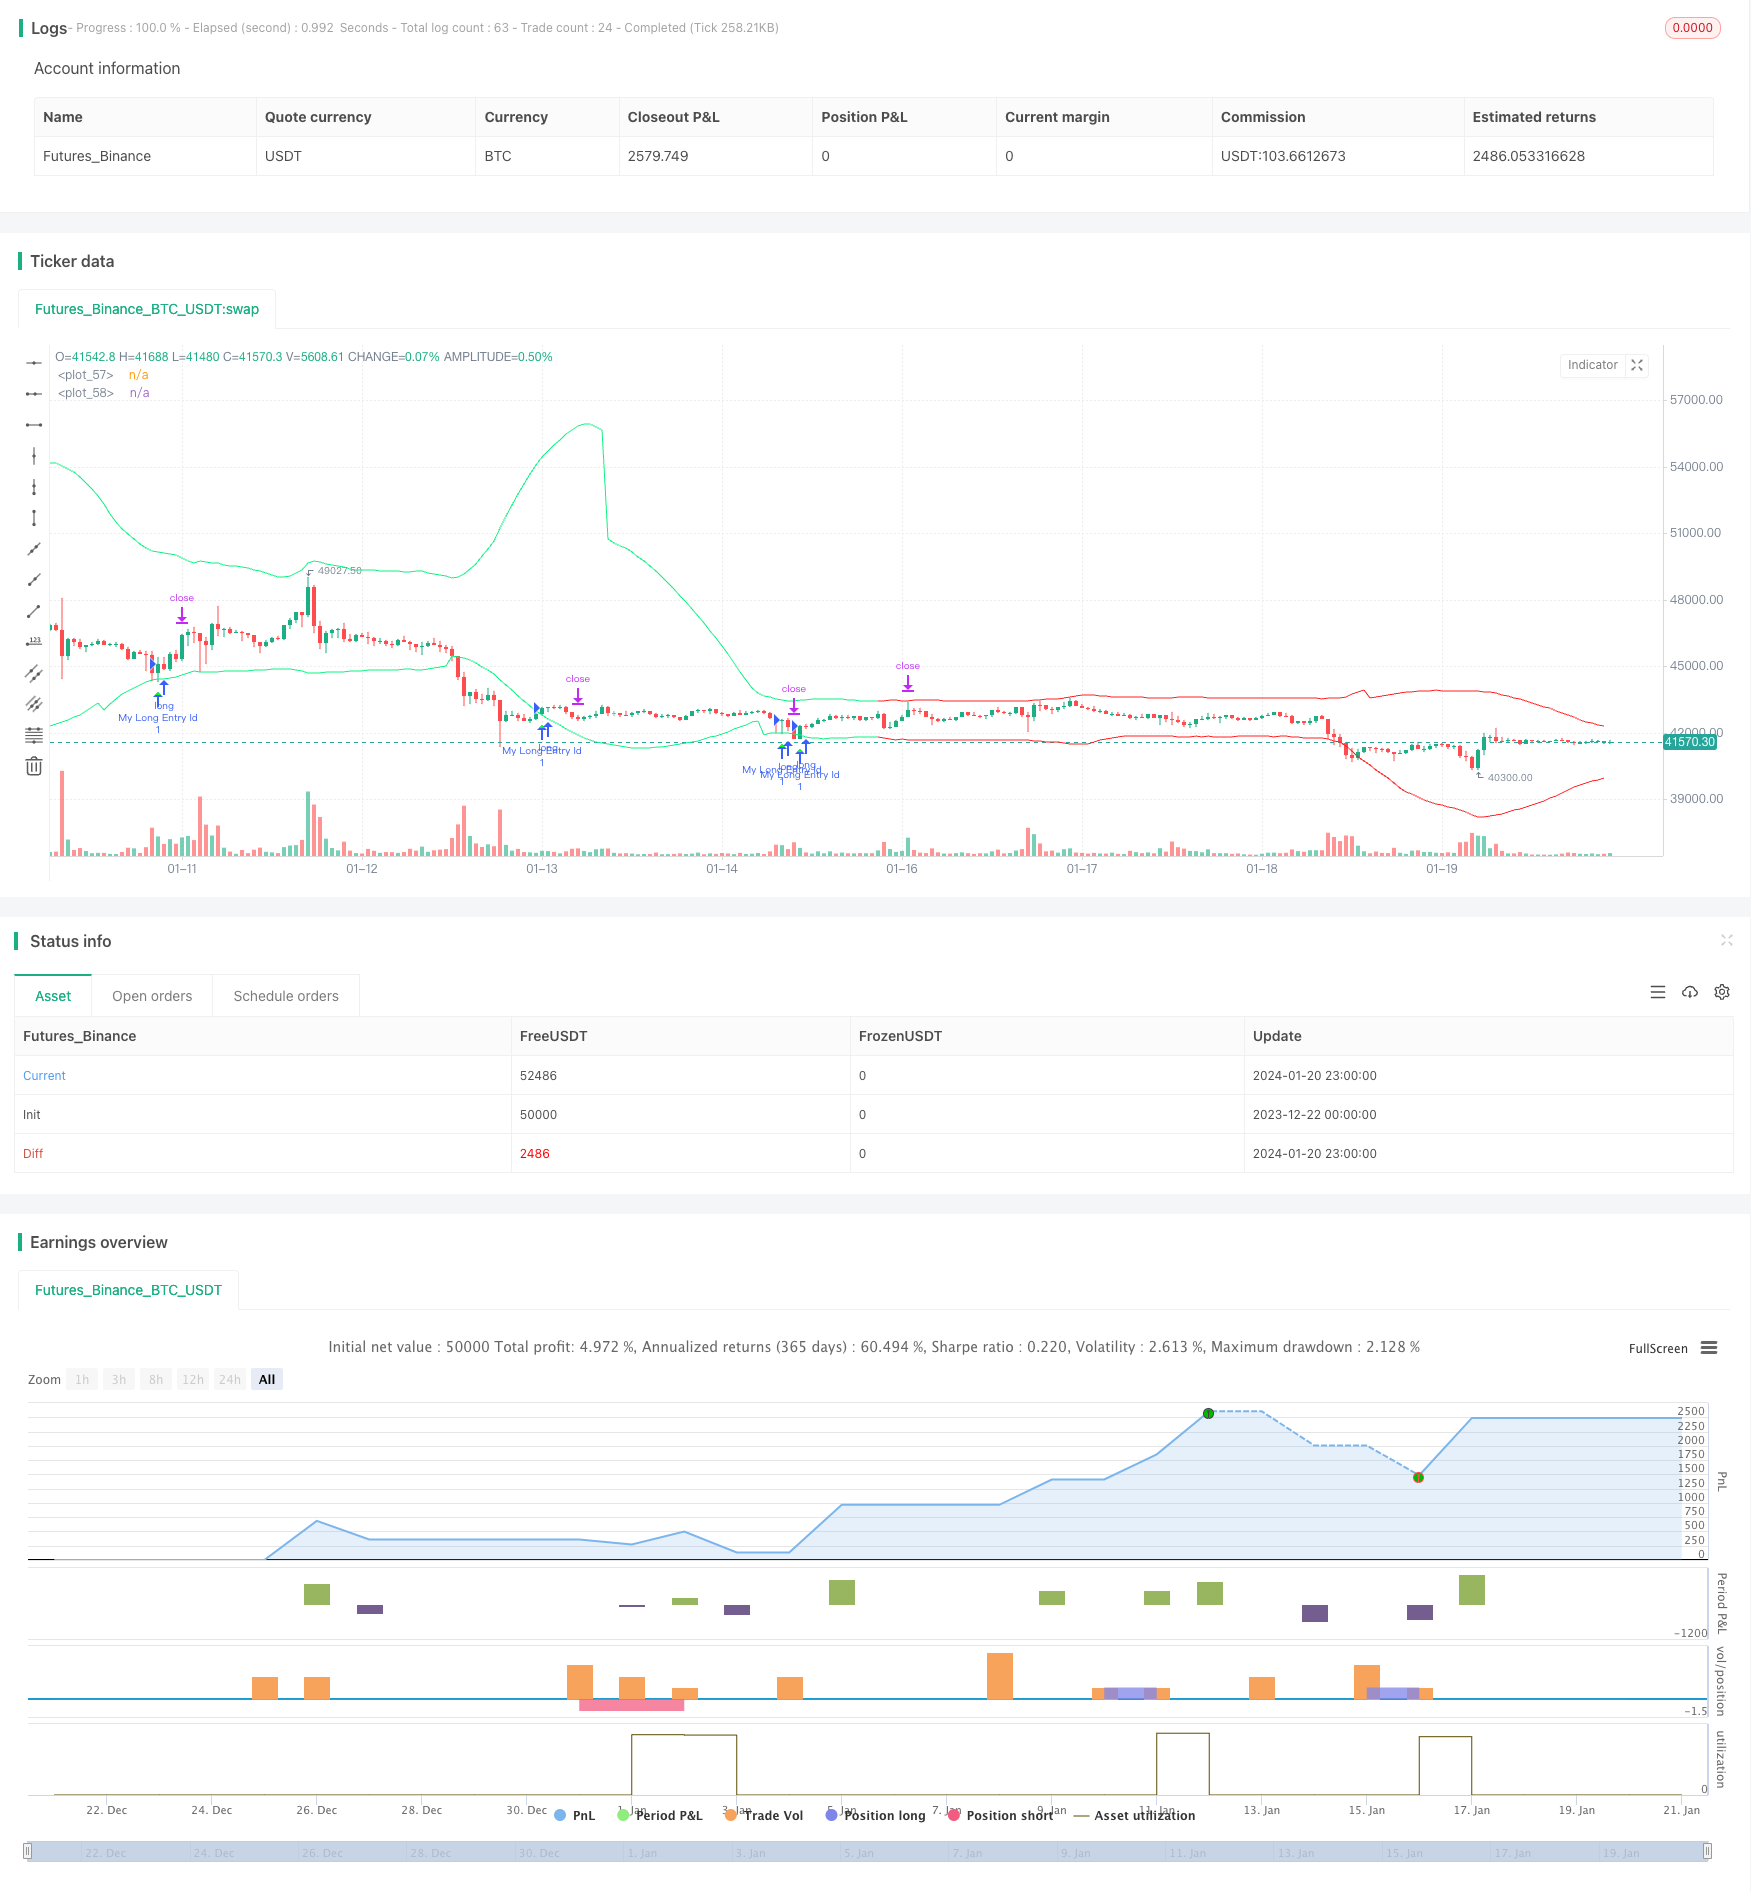
/*backtest
start: 2023-12-22 00:00:00
end: 2024-01-21 00:00:00
period: 1h
basePeriod: 15m
exchanges: [{"eid":"Futures_Binance","currency":"BTC_USDT"}]
*/

// This Pine Script™ code is subject to the terms of the Mozilla Public License 2.0 at https://mozilla.org/MPL/2.0/
// © AliSignals


//@version=5
strategy("CCI based support and resistance strategy", overlay=true  )


cci_length = input.int(50, "cci length")
right_pivot = input.int(50, "right pivot")
left_pivot = input.int(50, "left pivot")
buffer = input.float(10.0, "buffer")
trend_matter = input.bool(true, "trend matter?")
showmid = input.bool ( false , "show mid?")
trend_type = input.string("cross","trend type" ,options = ["cross","slope"])
slowma_l = input.int(100, "slow ma length")
fastma_l = input.int(50, "fast ma length")
slope_l = input.int(5,  "slope's length for trend detection")
ksl = input.float(1.1)
ktp = input.float(2.2)
restf = input.timeframe(title="Time Frame of Last Period for Calculating max" , defval="D")


// Calculating Upper and Lower CCI
cci = ta.cci(hlc3,cci_length)

uppercci = 0.0
lowercci = 0.0

uppercci := fixnan(ta.pivothigh(cci, left_pivot, right_pivot)) - buffer
lowercci := fixnan(ta.pivotlow (cci, left_pivot, right_pivot)) + buffer
midccci  = math.avg(uppercci,lowercci)


// Support and Resistance based on CCI
res = uppercci*(0.015*ta.dev(hlc3,cci_length))+ ta.sma(hlc3,cci_length)
sup = lowercci*(0.015*ta.dev(hlc3,cci_length))+ ta.sma(hlc3,cci_length)
mid =  midccci*(0.015*ta.dev(hlc3,cci_length))+ ta.sma(hlc3,cci_length)


// Calculating trend
t_cross  = 0
t_cross := ta.ema(close,fastma_l) > ta.ema(close,slowma_l) ? 1 : ta.ema(close,fastma_l) < ta.ema(close,slowma_l) ? -1 : t_cross[1]

t_slope  = 0
t_slope := ta.ema(close,slowma_l) > ta.ema(close,slowma_l)[slope_l] ? 1 : ta.ema(close,slowma_l) < ta.ema(close,slowma_l)[slope_l]  ? -1 : t_slope[1]

t  = 0
t := trend_type == "cross" ? t_cross : trend_type == "slope" ? t_slope : na

colort =  trend_matter == false ? color.rgb(201, 251, 0) : t == 1 ? color.rgb(14, 243, 132) :  t == -1 ? color.rgb(255, 34, 34) : na
bull_t = trend_matter == false or t ==  1
bear_t = trend_matter == false or t == -1

plot(res, color = colort)
plot(sup, color = colort)
plot(showmid == true ? mid : na)


// Long and Short enter condition
buy  = bull_t == 1 and ta.lowest (2) < sup and close > open and close > sup
sell = bear_t == 1 and ta.highest(2) > res and close < open and close < res

plotshape( buy , color=color.rgb(6, 255, 23) , location = location.belowbar, style = shape.triangleup  , size = size.normal)
plotshape( sell, color=color.rgb(234, 4, 4) ,  location = location.abovebar, style = shape.triangledown, size = size.normal)


atr = ta.atr(100)


CLOSE=request.security(syminfo.tickerid, restf, close)
max = 0.0
max := CLOSE == CLOSE[1] ? math.max(max[1], atr) : atr
act_atr = 0.0
act_atr := CLOSE == CLOSE[1] ? act_atr[1] : max[1]

atr1 =  math.max(act_atr, atr)

dis_sl = atr1 * ksl
dis_tp = atr1 * ktp


var float longsl  = open[1] - dis_sl
var float shortsl = open[1] + dis_sl
var float longtp =   open[1] + dis_tp
var float shorttp =  open[1] - dis_tp


longCondition = buy
if (longCondition)
    strategy.entry("My Long Entry Id", strategy.long)

shortCondition = sell
if (shortCondition)
    strategy.entry("My Short Entry Id", strategy.short)


longsl  := strategy.position_size > 0  ? longsl[1]  : close - dis_sl
shortsl := strategy.position_size < 0 ? shortsl[1] : close + dis_sl
longtp  := strategy.position_size > 0  ? longtp[1]  : close + dis_tp
shorttp := strategy.position_size < 0 ? shorttp[1] : close - dis_tp


if strategy.position_size > 0
    strategy.exit(id="My Long close Id", from_entry ="My Long Entry Id" , stop=longsl, limit=longtp)
if strategy.position_size < 0
    strategy.exit(id="My Short close Id", from_entry ="My Short Entry Id" , stop=shortsl, limit=shorttp)