Стратегия прорыва импульса, основанная на скользящей средней и оценке цикла
Обзор
Эта стратегия позволяет определить, на каком этапе цикла находится рынок, путем вычисления средней линии EMA для разных циклов, а затем в сочетании с ATR производить взломные суждения, чтобы достичь высокой вероятности отслеживания трендов.
Стратегический принцип
- Вычислить среднюю линию 5 дн., 20 дн., 40 дн.
- Сравнение величин трех средних линий позволяет определить, что рынок находится в одной из шести различных периодов.
- 5-я линия>20-я линия>40-я линия - первый цикл
- 20-я линия>5-я линия>40-я линия - второй цикл. ……
- После определения цикла рассчитывается показатель ATR и устанавливается кратность ATR в качестве критерия прорыва
- Сигнал покупки возникает, когда цена превышает ATR trailing stop на предыдущем BAR
- Сигнал продажи возникает, когда цена опускается ниже ATR trailing stop на BAR
- С помощью таких комбинаций можно достичь высокой вероятности отслеживания трендов.
Стратегические преимущества
- Периодические суждения повышают надежность сигнала
Судя по отношению величин различных средних линий EMA, можно эффективно определить, в какой циклической стадии находится рынок, чтобы избежать ошибочного сигнала в неподходящих циклах.
- ATR взломал фильтрующие сигналы
Показатель ATR может эффективно выражать волатильность рынка, устанавливая ATR определенного множества в качестве стандарта прорыва, который может отфильтровывать много ложных сигналов прорыва.
- Портфельные суждения создают высоковероятные торговые возможности
Органическое сочетание циклических суждений и суждений о прорыве ATR значительно повышает вероятность получения сигнала, что также повышает вероятность получения прибыли от сделки.
Стратегический риск
- Оптимизация параметров более сложная
Поскольку политика включает в себя несколько параметров, оптимизация затруднительна, и неправильная настройка параметров может повлиять на эффективность политики.
- Некоторые отставания
При быстрых изменениях рынка, средняя линия EMA и индикатор ATR имеют некоторое отставание, что может привести к ошибочным сигналам или упущенным возможностям.
- Требуется строгое ограничение
Любые технические показатели не позволяют полностью избежать возникновения ошибочных сигналов, поэтому необходимо установить строгие стоп-лосы для контроля риска.
Направление оптимизации стратегии
- Дальнейшая оптимизация параметров
Оптимизация параметров с использованием более богатых исторических данных, чтобы найти оптимальную комбинацию параметров.
- Повышение самостоятельности
Можно рассмотреть возможность автоматической корректировки ATR-параметров в зависимости от волатильности рынка для повышения адаптивности стратегии.
- В сочетании с другими показателями
Можно попробовать комбинировать с другими показателями, такими как частота колебаний, объем перевозок, чтобы помочь в определении, улучшить качество сигнала.
Подвести итог
Эта стратегия использует EMA средний цикл суждения и показатель ATR, чтобы установить динамику, чтобы достичь высокой вероятности, чтобы отслеживать тренд. У нее есть преимущества, такие как период суждения, фильтрация ложных сигналов, улучшение качества сигнала. Но также существует риск, что параметры могут быть сложными для оптимизации, существует риск задержки, необходимость дальнейшей оптимизации параметров, повышение адаптивности и т. Д.
/*backtest
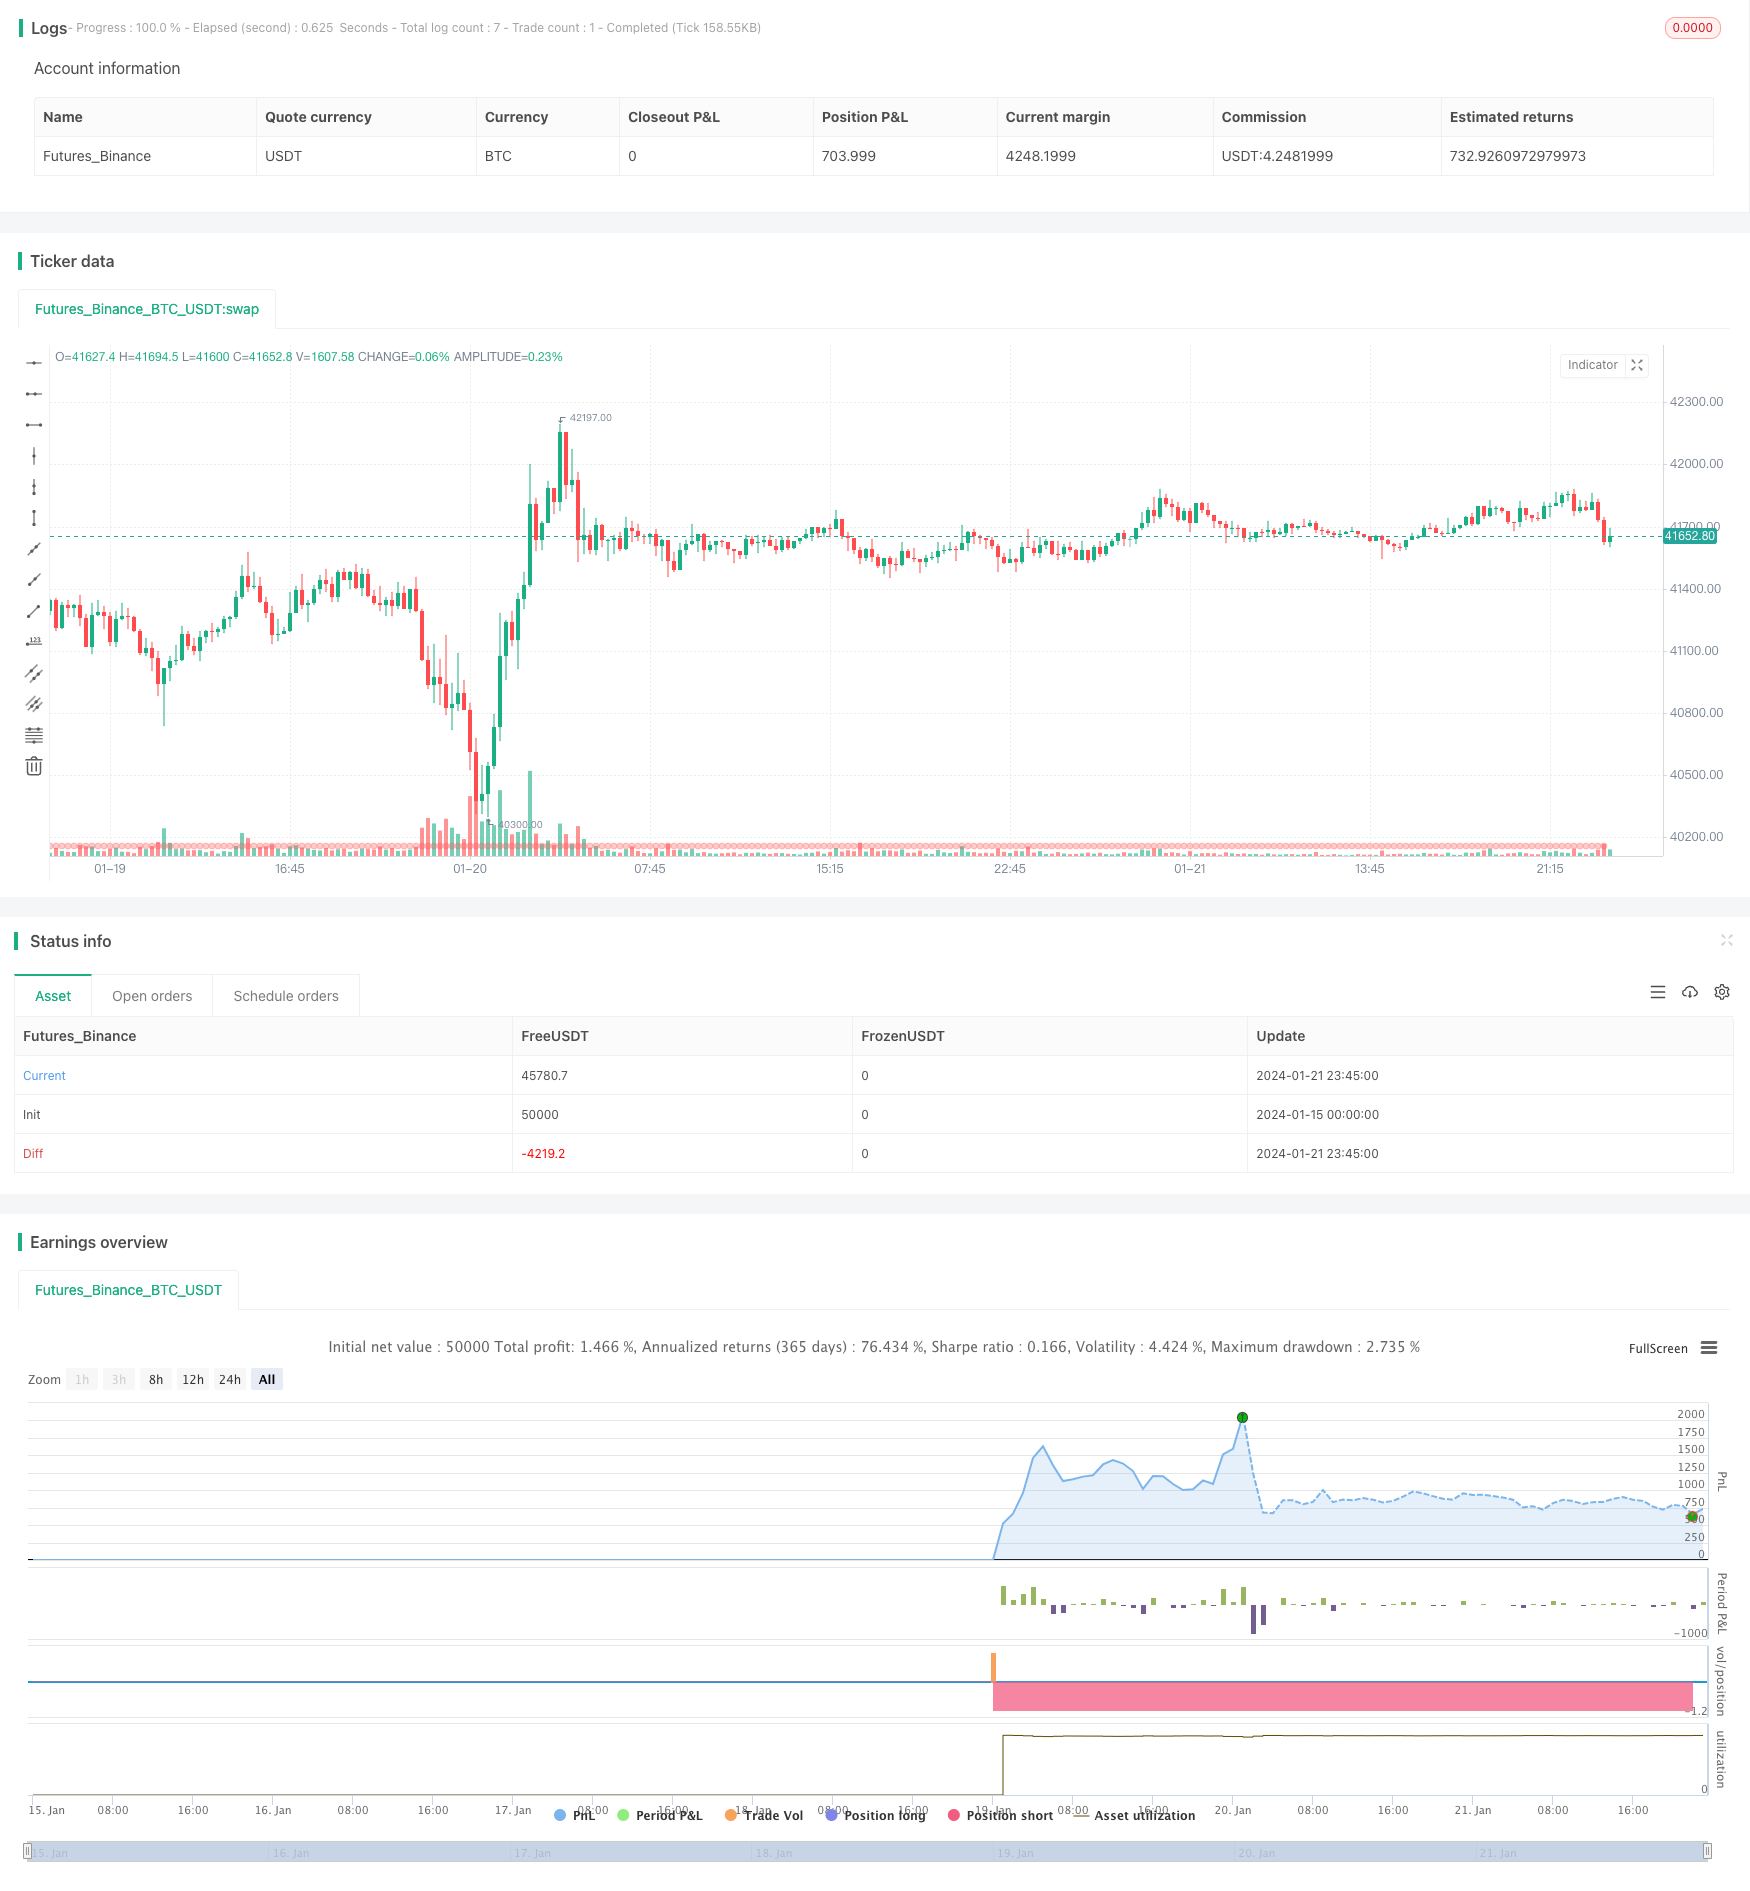
start: 2024-01-15 00:00:00
end: 2024-01-22 00:00:00
period: 15m
basePeriod: 5m
exchanges: [{"eid":"Futures_Binance","currency":"BTC_USDT"}]
*/
// This source code is subject to the terms of the Mozilla Public License 2.0 at https://mozilla.org/MPL/2.0/
// © kgynofomo
//@version=5
strategy(title="[Salavi] | Andy Advance Pro Strategy",overlay = true)
ema_short = ta.ema(close,5)
ema_middle = ta.ema(close,20)
ema_long = ta.ema(close,40)
cycle_1 = ema_short>ema_middle and ema_middle>ema_long
cycle_2 = ema_middle>ema_short and ema_short>ema_long
cycle_3 = ema_middle>ema_long and ema_long>ema_short
cycle_4 = ema_long>ema_middle and ema_middle>ema_short
cycle_5 = ema_long>ema_short and ema_short>ema_middle
cycle_6 = ema_short>ema_long and ema_long>ema_middle
bull_cycle = cycle_1 or cycle_2 or cycle_3
bear_cycle = cycle_4 or cycle_5 or cycle_6
// label.new("cycle_1")
// bgcolor(color=cycle_1?color.rgb(82, 255, 148, 60):na)
// bgcolor(color=cycle_2?color.rgb(82, 255, 148, 70):na)
// bgcolor(color=cycle_3?color.rgb(82, 255, 148, 80):na)
// bgcolor(color=cycle_4?color.rgb(255, 82, 82, 80):na)
// bgcolor(color=cycle_5?color.rgb(255, 82, 82, 70):na)
// bgcolor(color=cycle_6?color.rgb(255, 82, 82, 60):na)
// Inputs
a = input(2, title='Key Vaule. \'This changes the sensitivity\'')
c = input(7, title='ATR Period')
h = false
xATR = ta.atr(c)
nLoss = a * xATR
src = h ? request.security(ticker.heikinashi(syminfo.tickerid), timeframe.period, close, lookahead=barmerge.lookahead_off) : close
xATRTrailingStop = 0.0
iff_1 = src > nz(xATRTrailingStop[1], 0) ? src - nLoss : src + nLoss
iff_2 = src < nz(xATRTrailingStop[1], 0) and src[1] < nz(xATRTrailingStop[1], 0) ? math.min(nz(xATRTrailingStop[1]), src + nLoss) : iff_1
xATRTrailingStop := src > nz(xATRTrailingStop[1], 0) and src[1] > nz(xATRTrailingStop[1], 0) ? math.max(nz(xATRTrailingStop[1]), src - nLoss) : iff_2
pos = 0
iff_3 = src[1] > nz(xATRTrailingStop[1], 0) and src < nz(xATRTrailingStop[1], 0) ? -1 : nz(pos[1], 0)
pos := src[1] < nz(xATRTrailingStop[1], 0) and src > nz(xATRTrailingStop[1], 0) ? 1 : iff_3
xcolor = pos == -1 ? color.red : pos == 1 ? color.green : color.blue
ema = ta.ema(src, 1)
above = ta.crossover(ema, xATRTrailingStop)
below = ta.crossover(xATRTrailingStop, ema)
buy = src > xATRTrailingStop and above
sell = src < xATRTrailingStop and below
barbuy = src > xATRTrailingStop
barsell = src < xATRTrailingStop
atr = ta.atr(14)
atr_length = input.int(25)
atr_rsi = ta.rsi(atr,atr_length)
atr_valid = atr_rsi>50
long_condition = buy and bull_cycle and atr_valid
short_condition = sell and bear_cycle and atr_valid
Exit_long_condition = short_condition
Exit_short_condition = long_condition
if long_condition
strategy.entry("Andy Buy",strategy.long, limit=close,comment="Andy Buy Here")
if Exit_long_condition
strategy.close("Andy Buy",comment="Andy Buy Out")
// strategy.entry("Andy fandan Short",strategy.short, limit=close,comment="Andy 翻單 short Here")
// strategy.close("Andy fandan Buy",comment="Andy short Out")
if short_condition
strategy.entry("Andy Short",strategy.short, limit=close,comment="Andy short Here")
// strategy.exit("STR","Long",stop=longstoploss)
if Exit_short_condition
strategy.close("Andy Short",comment="Andy short Out")
// strategy.entry("Andy fandan Buy",strategy.long, limit=close,comment="Andy 翻單 Buy Here")
// strategy.close("Andy fandan Short",comment="Andy Buy Out")
inLongTrade = strategy.position_size > 0
inLongTradecolor = #58D68D
notInTrade = strategy.position_size == 0
inShortTrade = strategy.position_size < 0
// bgcolor(color = inLongTrade?color.rgb(76, 175, 79, 70):inShortTrade?color.rgb(255, 82, 82, 70):na)
plotshape(close!=0,location = location.bottom,color = inLongTrade?color.rgb(76, 175, 79, 70):inShortTrade?color.rgb(255, 82, 82, 70):na)
plotshape(long_condition, title='Buy', text='Andy Buy', style=shape.labelup, location=location.belowbar, color=color.new(color.green, 0), textcolor=color.new(color.white, 0), size=size.tiny)
plotshape(short_condition, title='Sell', text='Andy Sell', style=shape.labeldown, location=location.abovebar, color=color.new(color.red, 0), textcolor=color.new(color.white, 0), size=size.tiny)
//atr > close *0.01* parameter