Стратегия следования за трендом на основе DMI и RSI
Обзор
Эта стратегия в сочетании с DMI, определяющим направление тренда, и RSI, определяющим перекуп и перепродажу, обеспечивает более полную стратегию торговли, следующую за трендом. Когда DMI определяет тенденцию, и RSI показывает перекуп или перепродажу, следует сделать оперирование или дисконтирование.
Принципы стратегии
- Использование показателя DMI для определения направления тренда
- DMI состоит из трёх кривых: +DI означает тенденцию к росту, -DI означает тенденцию к снижению, ADX определяет силу тенденции
- Когда +DI>-DI - это восходящий тренд, делайте больше; когда -DI>+DI - это нисходящий тренд, делайте дефолт
- Показатели RSI для определения перекупа и перепродажи
- RSI определяет, перекуплен или перепродан, сравнивая средние увеличения и уменьшения на закрытии за период времени
- RSI ниже 30 - это перепродажа, а выше 70 - это перекуп
- В сочетании с определением направления тренда по DMI и определением RSI, можно лучше понять ритм рынка
- DMI считает, что есть тенденция к повышению, и когда RSI продает, это лучшая возможность сделать больше
- DMI считает, что есть тенденция к снижению, и когда RSI перекупает, это лучшее время для дефолта
- Настройка движущегося стоп-лока для блокировки прибыли
Анализ преимуществ
Это более зрелая, стабильная стратегия слежения за трендом, которая имеет следующие преимущества:
- Необходимо использовать тенденционный анализ и оценку сверхпокупа и сверхпродажи, чтобы избежать частых сделок на волатильных рынках.
- Использование популярных индикаторов DMI и RSI, легкость выбора параметров, практическая проверка
- Настройка мобильного стоп-листа для блокировки прибыли позволяет в определенной степени избежать стоп-листа
- Правила ясны и понятны, процедуры просты и практичны.
Анализ рисков
В этой стратегии также есть некоторые риски, о которых следует помнить:
- Как DMI, так и RSI подвержены ложным сигналам, которые могут привести к ненужным потерям.
- Неправильная настройка мобильного стоп-сигнала может привести к преждевременному или слишком большому стоп-сигнала
- Неэффективные фильтры, которые могут быть использованы для фильтрации шока.
- Следуя трендовой стратегии, не удается своевременно остановить убытки при обратном тренде
Оптимизация направления
Эта стратегия также может быть оптимизирована в следующих аспектах:
- Фильтрация колебаний в сочетании с показателем колебаний
- В сочетании с формулой свечи, избегайте ложных прорывов
- Установка надлежащего ограничения убытков вблизи ключевых позиций сопротивления поддержки
- Добавление модели машинного обучения для определения тенденций ython
- Динамическая оптимизация параметров DMI и RSI
Резюме
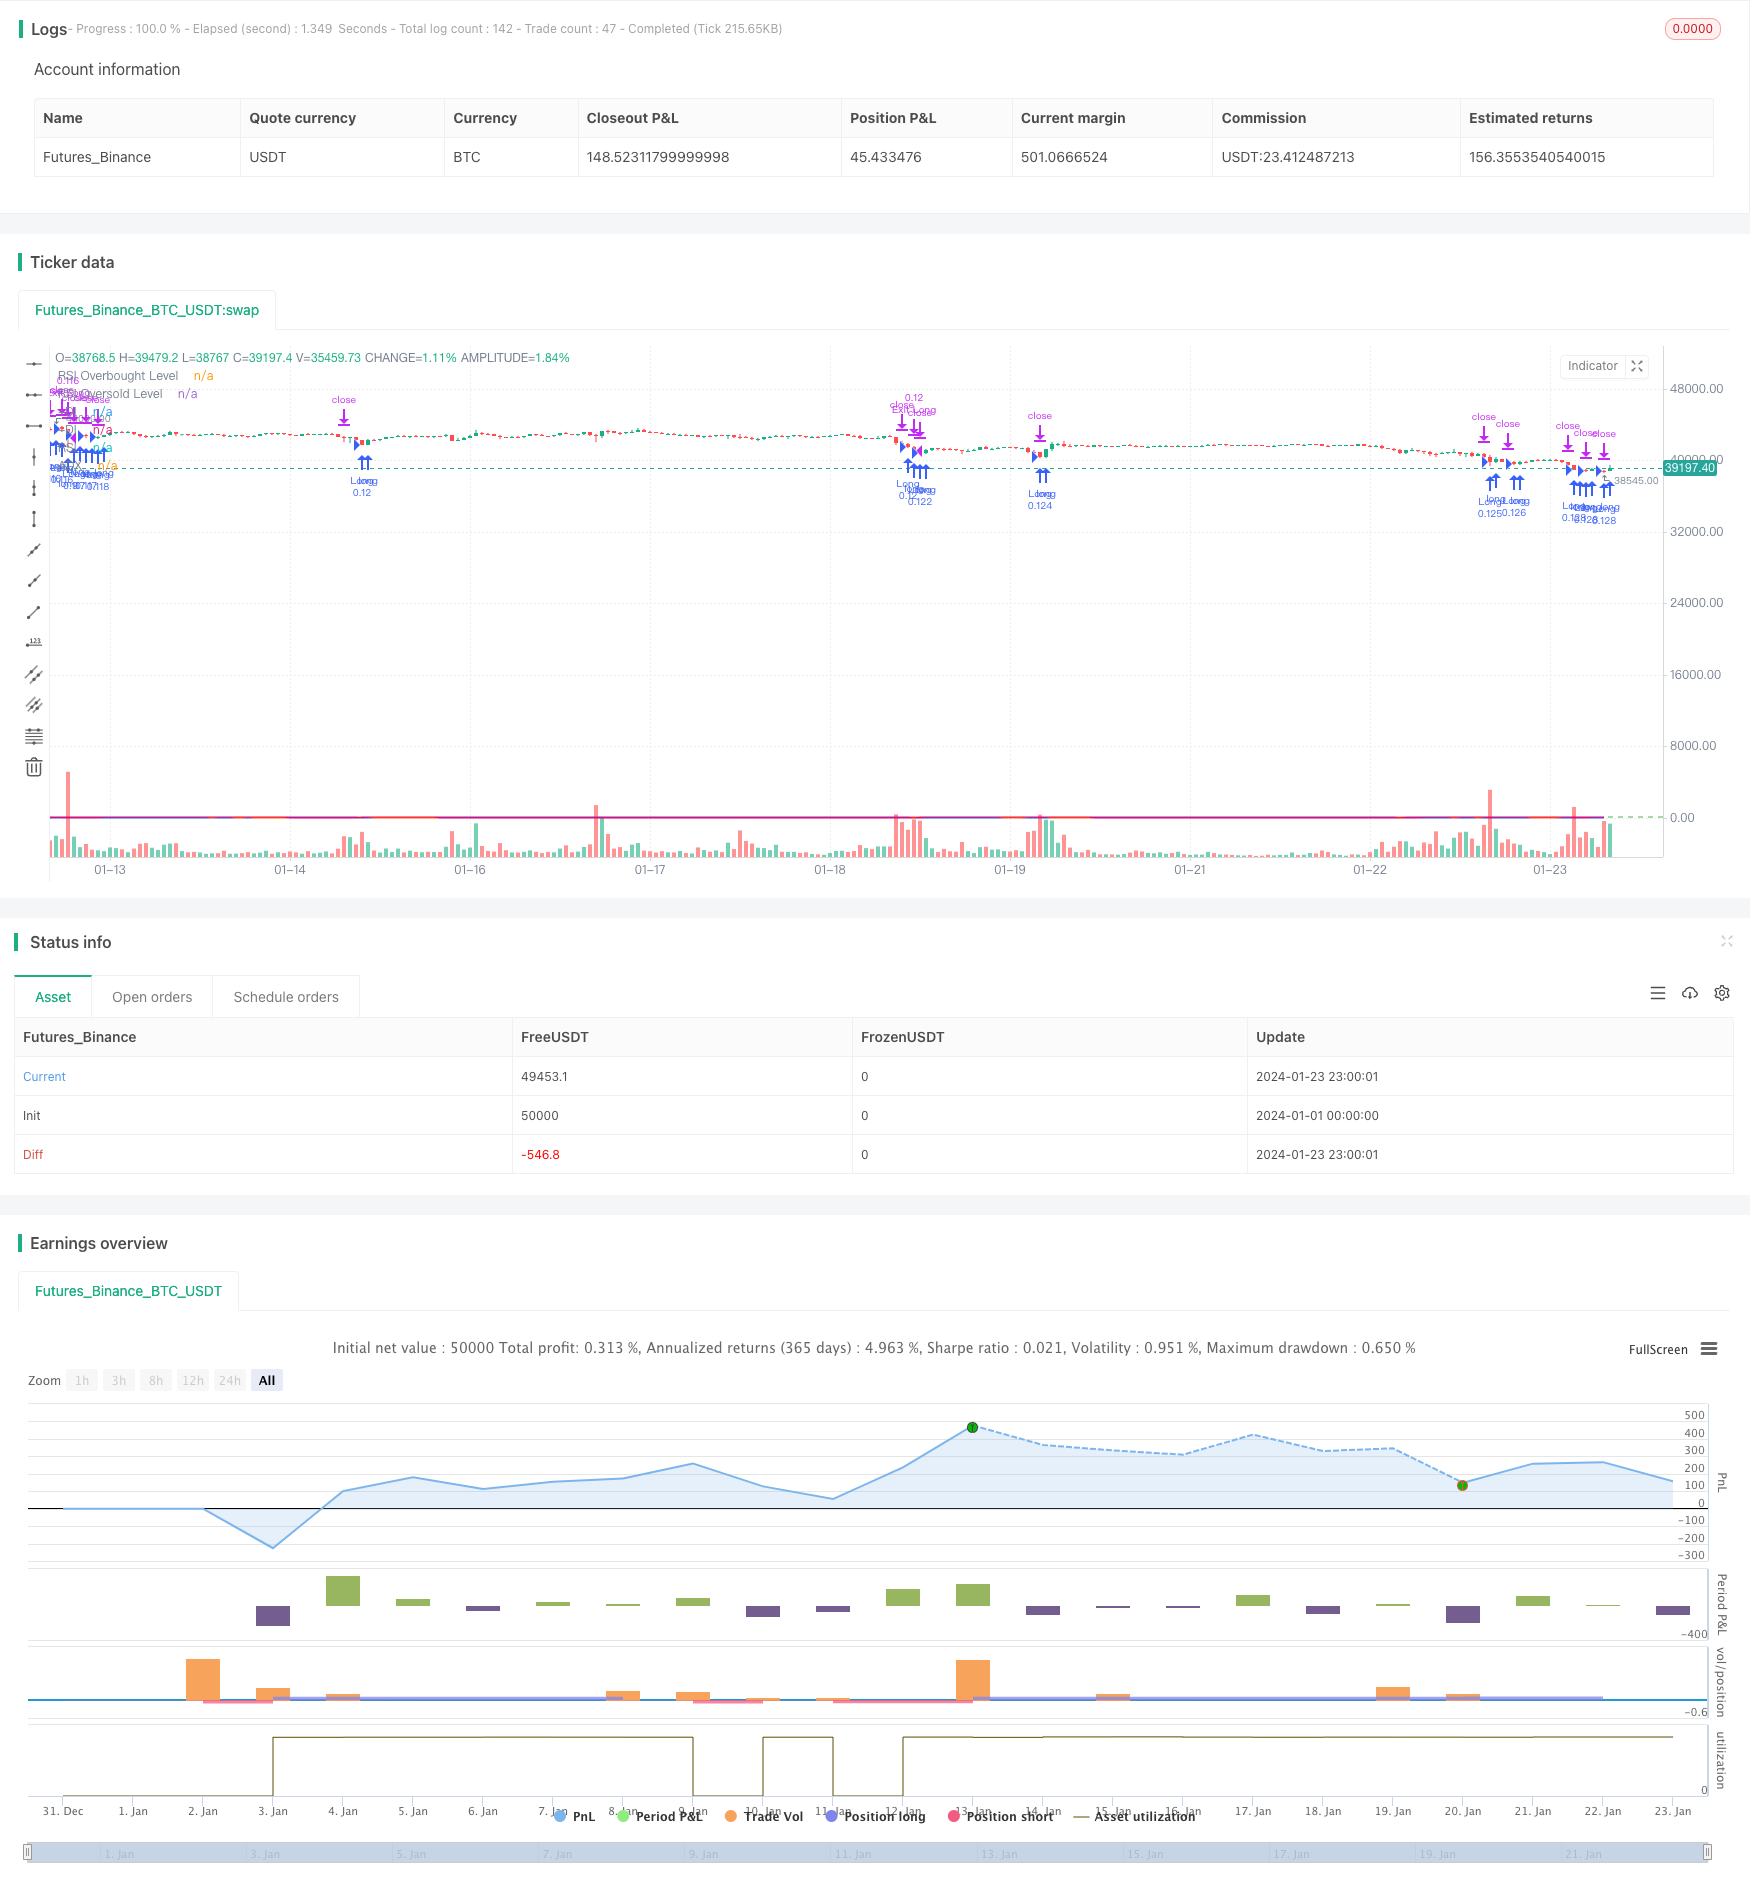
Эта стратегия в целом является более стабильной и практичной стратегией следования тренду, которая определяет направление тренда с помощью DMI, RSI определяет перекуп и перепродажу, таким образом, захватывая торговые возможности в средней длинной линии. При этом устанавливается движущийся стоп-локс для блокирования прибыли. Параметры стратегии просты в выборе, правила торговли ясны и просты в практике.
/*backtest
start: 2024-01-01 00:00:00
end: 2024-01-24 00:00:00
period: 1h
basePeriod: 15m
exchanges: [{"eid":"Futures_Binance","currency":"BTC_USDT"}]
*/

// This Pine Script™ code is subject to the terms of the Mozilla Public License 2.0 at https://mozilla.org/MPL/2.0/
// © YingYangJPN

//@version=5
strategy("DMI and RSI Strategy", overlay=true, initial_capital=10000, default_qty_type=strategy.percent_of_equity, default_qty_value=10)

// DMI indikatörünü tanımlayalım
lensig = input.int(14, title="ADX Smoothing", minval=1, maxval=50)
len = input.int(14, minval=1, title="DI Length")
up = ta.change(high)
down = -ta.change(low)
plusDM = na(up) ? na : (up > down and up > 0 ? up : 0)
minusDM = na(down) ? na : (down > up and down > 0 ? down : 0)
trur = ta.rma(ta.tr, len)
plus = fixnan(100 * ta.rma(plusDM, len) / trur)
minus = fixnan(100 * ta.rma(minusDM, len) / trur)
sum = plus + minus
adx = 100 * ta.rma(math.abs(plus - minus) / (sum == 0 ? 1 : sum), lensig)
trailing_stop_loss_factor = input.float(0.50, "Trailing Stop Loss Factor", step = 0.01)

// RSI indikatörünü tanımlayalım
rsiLength = input.int(14, minval=1, title="RSI Length")
rsiSource = input(close, title="RSI Source")
rsiOverbought = input.int(70, title="RSI Overbought Level")
rsiOversold = input.int(30, title="RSI Oversold Level")
rsiValue = ta.rsi(rsiSource, rsiLength)

// Uzun pozisyon açma koşullarını tanımlayalım
longCondition1 = rsiValue < rsiOversold // RSI oversold seviyesinin altındaysa
longCondition2 = adx > 20 // ADX 20'den büyükse
longCondition3 = minus > plus

// Kısa pozisyon açma koşullarını tanımlayalım
shortCondition1 = rsiValue > rsiOverbought // RSI overbought seviyesinin üstündeyse
shortCondition2 = adx > 20 // ADX 20'den büyükse
shortCondition3 = plus > minus

// Uzun pozisyon açalım
if longCondition1 and longCondition2 and longCondition3
    strategy.entry("Long", strategy.long)


// Kısa pozisyon açalım
if shortCondition1 and shortCondition2 and shortCondition3
    strategy.entry("Short", strategy.short)

// Trailing Stop Loss
longTrailingStopLoss = strategy.position_avg_price * (1 - trailing_stop_loss_factor / 100)
shortTrailingStopLoss = strategy.position_avg_price * (1 + trailing_stop_loss_factor / 100)
if strategy.position_size > 0
    strategy.exit("Exit Long", "Long", stop  = longTrailingStopLoss)
if strategy.position_size < 0
    strategy.exit("Exit Short", "Short", stop = shortTrailingStopLoss)

// DMI ve RSI indikatörlerini grafiğe çizelim
plot(adx, color=#F50057, title="ADX")
plot(plus, color=#2962FF, title="+DI")
plot(minus, color=#FF6D00, title="-DI")
plot(rsiValue, color=#9C27B0, title="RSI")
hline(rsiOverbought, title="RSI Overbought Level", color=#E91E63, linestyle=hline.style_dashed)
hline(rsiOversold, title="RSI Oversold Level", color=#4CAF50, linestyle=hline.style_dashed)