Стратегия теории двойной скользящей средней
Обзор
Двойная линейная стратегия мнения - это стратегия отслеживания тенденций. Она строит группу быстрых и медленных линий, рассчитывая две группы движущихся средних, и определяет направление тенденции в сочетании с отношением цены к средней линии.
При переходе через медленную линию на быстрой линии используется многозначный сигнал. При переходе через медленную линию под быстрой линией используется просматривающий сигнал. Эта стратегия объединяет направление быстрой и медленной средней линии, количество свечей, с которыми цена пробивается, и другие условия для определения конкретного времени входа и выхода.
Стратегический принцип
Двухлинейная стратегия общественного мнения определяет критерии для определения краткосрочных и долгосрочных тенденций путем вычисления двух групп движущихся средних. В частности, стратегия определяет:
- группа быстрых средних линий, включающая быстрые средние линии вниз и быстрые средние линии вверх, представляющая краткосрочные тенденции;
- Медленно-средняя группа, включающая медленно-вниз и медленно-наверх среднюю линию, представляет собой долгосрочную тенденцию.
Стратегия оценивает обоснованность краткосрочных и долгосрочных тенденций, а также конкретные моменты входа и выхода из рынка с помощью ценовых отношений между быстрыми и медленными среднелинейными группами.
Условия приемаВот как:
- Быстрый вверх по рельсу вверх прорыв медленного вверх по рельсу 2 K-линии или более является многоголовым входом.
- При прорыве скоростной нисходящей линии вниз медленной нисходящей линии на 2 или более K-линий вступает в игру как безвоздушный.
Условия игрыВот как:
- Во время многоголового позиционирования, быстрое совпадение происходит при прохождении медленного совпадения.
- Во время позиционирования на пустую голову, играть на пустую голову при прохождении медленной средней линии на скоростной средней линии.
Кроме того, в стратегии также установлены такие функции, как остановка, остановка убытков и отслеживание убытков, чтобы контролировать риск.
Анализ преимуществ
Основными преимуществами стратегии с двумя линиями общественного мнения являются:
- С помощью двойной равномерности можно эффективно отфильтровывать рыночный шум и определять направление тренда.
- В сочетании со скоростной средней линией и ценовой зависимостью, можно судить о высокой надежности сигнала.
- Правила стратегии простые, понятные, легко понятные и подходят для количественных сделок.
- Встроенные средства контроля риска, такие как остановка, остановка убытков и отслеживание убытков, позволяют эффективно контролировать риск торговли.
Анализ рисков
Также существуют риски, связанные с двулинейной стратегией, которые проявляются в следующем:
- В условиях потрясений может быть создано ложное сигнализирующее устройство, что может привести к ненужным сделкам.
- Среднелинейная система медленно реагирует на неожиданные события (например, значительная прибыль/выгодные новости), что может привести к большим потерям.
- Следующие стоп-лозы могут быть пробиты в определенных ситуациях, увеличивая убытки.
Для управления вышеуказанными рисками можно улучшить такие методы, как оптимизация параметров скользящей средней линии или фильтрация в сочетании с другими показателями.
Направление оптимизации
Стратегия двустороннего равномерного мнения может быть оптимизирована в следующих аспектах:
- Оптимизация параметров скользящих средних, адаптация среднелинейных циклов к различным циклическим условиям.
- Добавление других показателей Filter, формирование стратегии комбинирования нескольких показателей, повышение точности сигнала.
- Оптимизируйте параметры стоп-лосса, установка сброса, установка отмены и контроль максимальных потерь.
- Внедрение моделей машинного обучения для прогнозирования тенденций, которые помогут определить время поступления.
Подвести итог
Двухлинейная стратегия общественного мнения в целом является очень практической стратегией отслеживания тенденций. Правила ее суждения просты, логика ясна, риск контролируется с помощью двухлинейной системы, теоретическая основа прочна. Следующий шаг может быть улучшен с помощью оптимизации параметров, контроля риска и других аспектов, что позволит дальнейшему повышению прибыльности и стабильности стратегии.
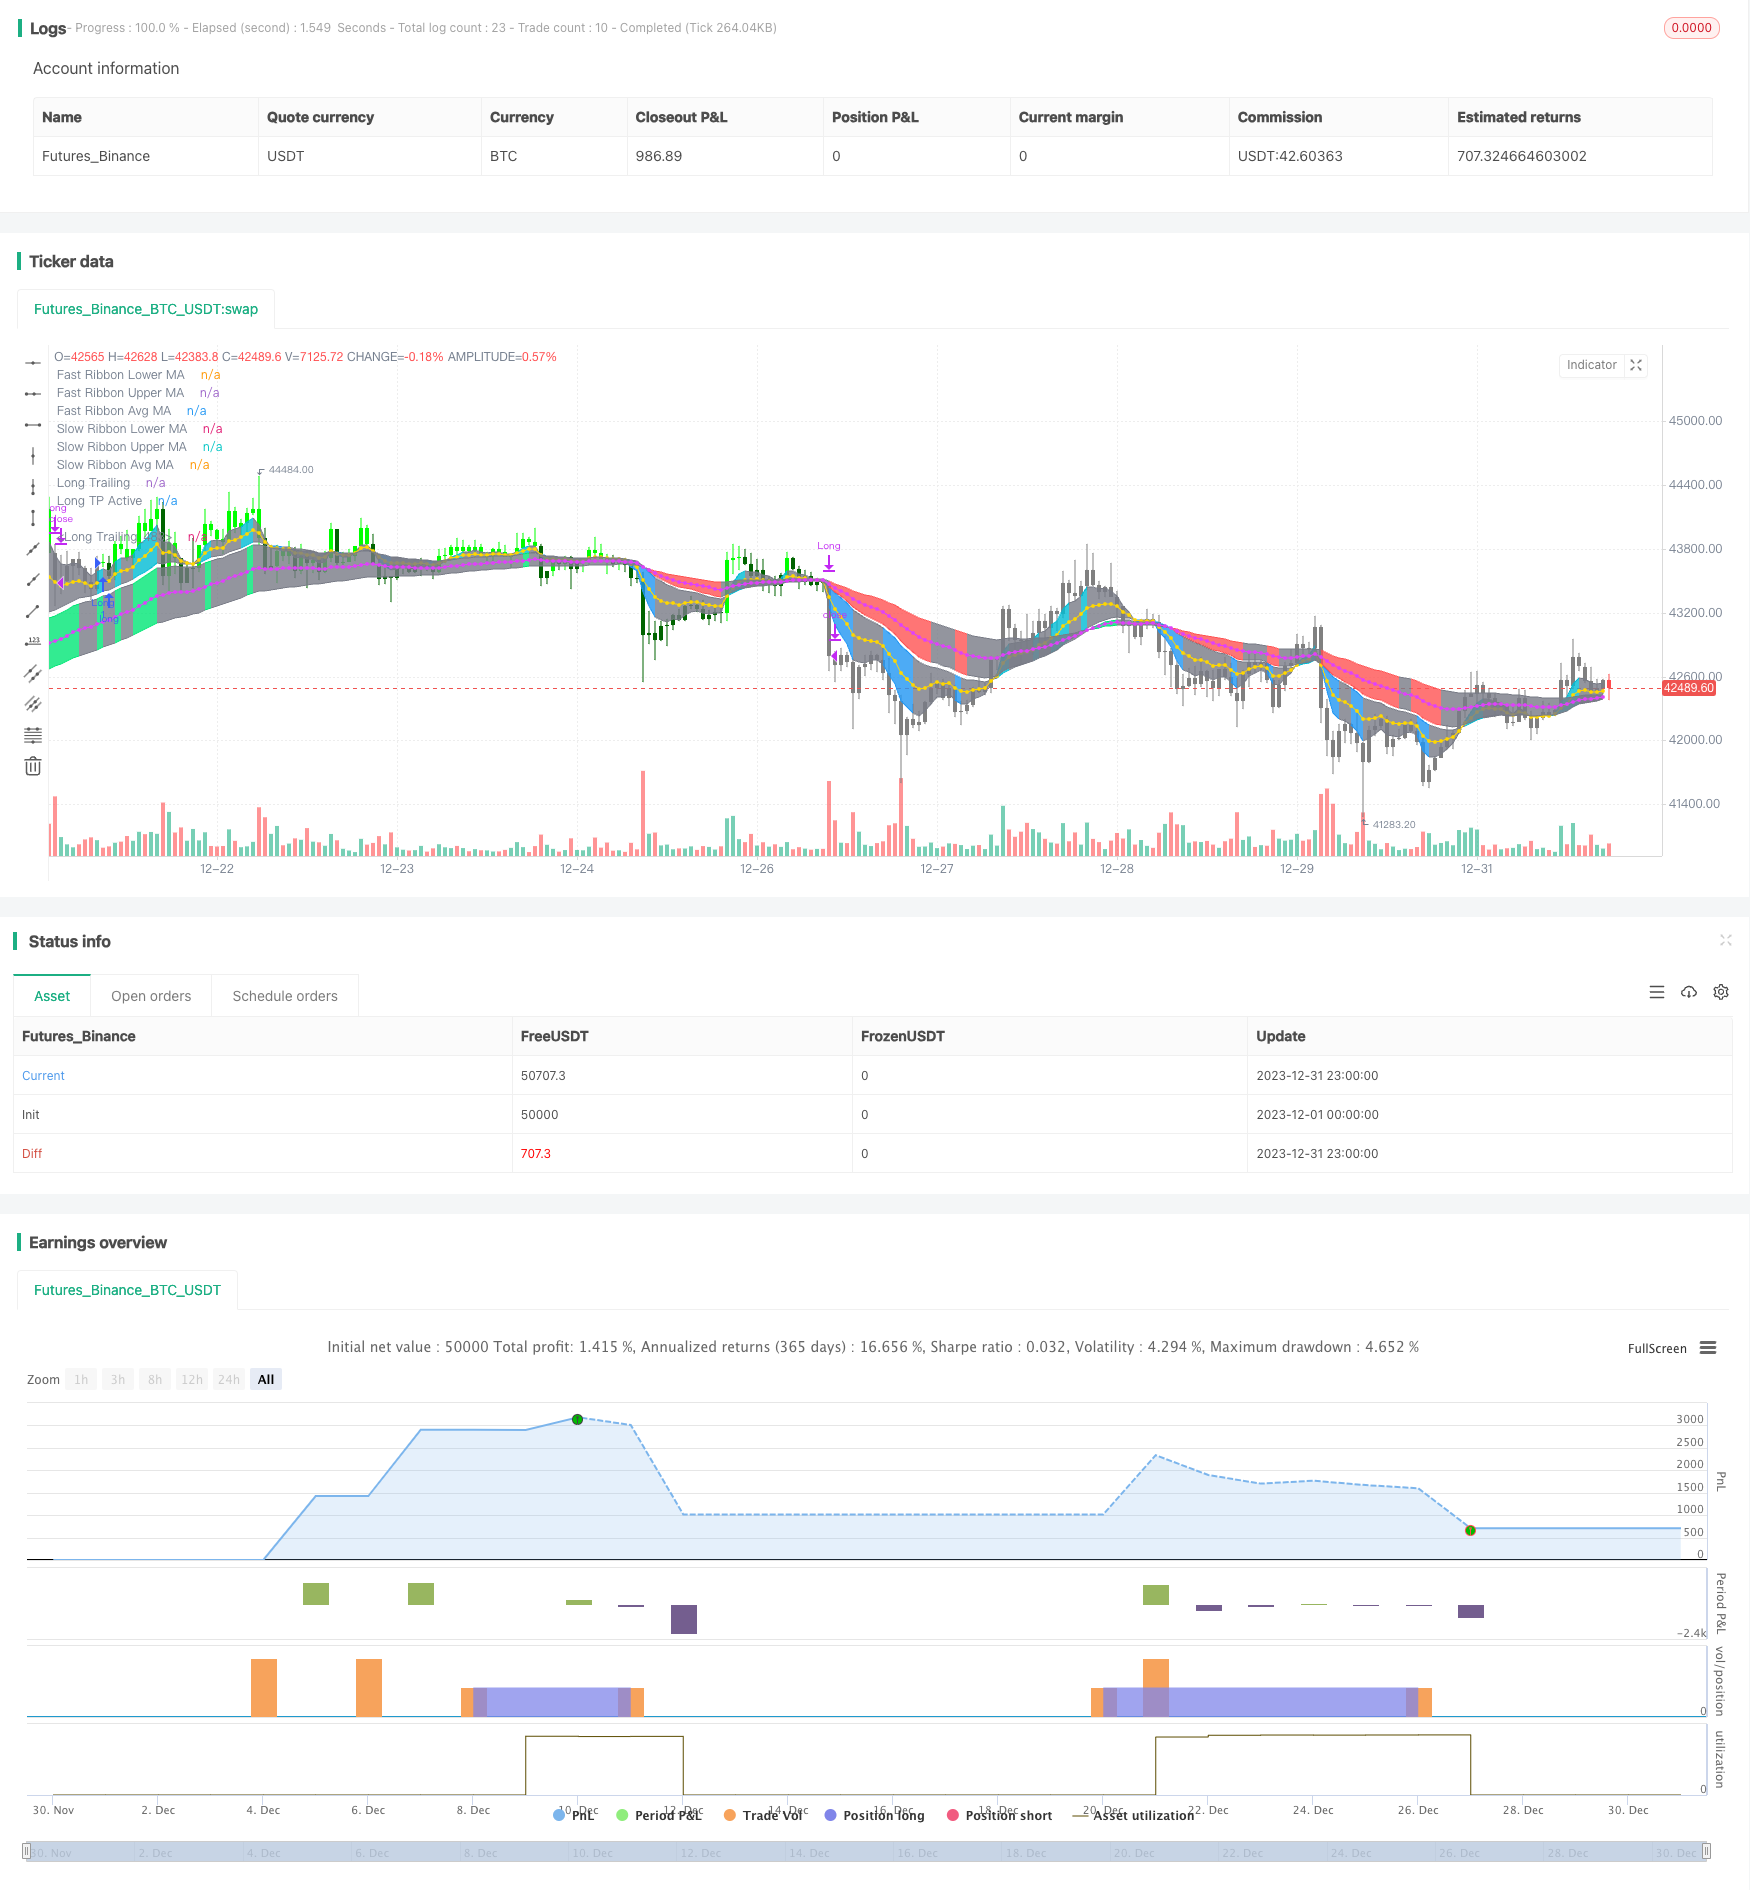
/*backtest
start: 2023-12-01 00:00:00
end: 2023-12-31 23:59:59
period: 1h
basePeriod: 15m
exchanges: [{"eid":"Futures_Binance","currency":"BTC_USDT"}]
*/

//@version=3

strategy(title="[Autoview][BackTest]Dual MA Ribbons R0.12 by JustUncleL", shorttitle="[BT]DualRibbons R0.12", overlay=true )

//study(title="[Autoview][Alerts]Dual MA Ribbons R0.12 by JustUncleL", shorttitle="[AL]DualRibbons R0.12", overlay=true)

//
//  Author:   JustUncleL
//  Revision: R0.12 Beta
//  Date:     30-Apr-2018
//
//  Description:
//  ============
//  This is an implementaion of a strategy based on two MA Ribbonn, a Fast Ribbon
//  and a Slow Ribbon.
//  The strategy revolves around a pair of scripts: One to generate alerts signals for
//  Autoview and one for Backtesting, to tune your settings.
//  The risk management options are performed within the script to set SL(StopLoss),
//  TP(TargetProfit), TSL(Trailing Stop Loss) and TTP (Trailing Target Profit).
//  The only requirement for Autoview is to Buy and Sell as directed by this script,
//  no complicated syntax is required.
//
//  The Dual Ribbons are designed to capture the inferred behaviour of traders and
//  investors by using two groups of averages:
//  > Traders MA Ribbon:
//    Lower MA and Upper MA  (Aqua=Uptrend, Blue=downtrend, Gray=Neutral), with
//    centre line Avg MA (Orange dotted line).
//  > Investors MAs Ribbon:
//    Lower MA and Upper MA  (Green=Uptrend, Red=downtrend, Gray=Neutral), with
//    centre line Avg MA (Fuchsia dotted line).
//  > Anchor time frame (0=current). This is the time frame that the MAs are
//    calculated for. This way 60m MA Ribbons can be viewed on a 15 min chart to establish
//    tighter Stop Loss conditions.
//
//   Trade Management options:
//   -------------------------
//   - Option to specify Backtest start and end time.
//   - Trailing Stop, with Activate Level (as % of price) and Trailing Stop (as % of price)
//   - Target Profit Level, (as % of price)
//   - Stop Loss Level, (as % of price)
//   - BUY green triandles and SELL dark red triangles
//   - Trade Order closed colour coded Label:
//       > Dark Red = Stop Loss Hit
//       > Green  = Target Profit Hit
//       > Purple = Trailing Stop Hit
//       > Orange = Opposite (Sell) Order Close
//
//   Trade Management Indication:
//   ----------------------------
//   - Trailing Stop Activate Price = Blue dotted line
//   - Trailing Stop Price =  Fuschia solid stepping line
//   - Target Profit Price = Lime '+' line
//   - Stop Loss Price = Red '+' line
//
//   Dealing With Renko Charts:
//   --------------------------
//   - If you choose to use Renko charts, make sure you have enabled the "IS This a RENKO Chart"
//     option, (I have not so far found a way to Detect the type of chart that is running).
//   - If you want non-repainting Renko charts you MUST use TRADITIONAL Renko Bricks. This
//     type of brick is fixed and will not change size.
//   - Also use Renko bricks with WICKS DISABLED. Wicks are not part of Renko, the whole
//     idea of using Renko bricks is not to see the wick noise.
//   - Set you chart Time Frame to the lowest possible one that will build enough bricks
//     to give a reasonable history, start at 1min TimeFrame. Renko bricks are not dependent
//     on time, they represent a movement in price. But the chart candlestick data is used
//     to create the bricks, so lower TF gives more accurate Brick creation.
//   - You want to size your bricks to 2/1000 of the pair price, so for ETHBTC the price is say 0.0805
//     then your Renko Brick size should be about 2*0.0805/1000 = 0.0002 (round up).
//   - You may find there is some slippage in value, but this can be accounted for in the Backtes
//     by setting your commission a bit higher, for Binance for example I use 0.2
//
//  References:
//  ===========
//  - MA Ribbon R#.# by JustUncleL
//  - "How to automate this strategy for free using a chrome extension" by CryptoRox
//
//  Revisions:
//  ==========
//  R0.12   - Beta 2 Version
//
//
//
// -----------------------------------------------------------------------------
// Copyright 2018 JustUncleL
//
// This program is free software: you can redistribute it and/or modify
// it under the terms of the GNU General Public License as published by
// the Free Software Foundation, either version 3 of the License, or
// any later version.
//
// This program is distributed in the hope that it will be useful,
// but WITHOUT ANY WARRANTY; without even the implied warranty of
// MERCHANTABILITY or FITNESS FOR A PARTICULAR PURPOSE.  See the
// GNU General Public License for more details.
//
// The GNU General Public License can be found here
// <http://www.gnu.org/licenses/>.
//
// -----------------------------------------------------------------------------
//


//
// Use Alternate Anchor TF for MAs
uRenko    = input(true, title="IS This a RENKO Chart")
//
anchor     = input(0,minval=0,maxval=1440,title="Alternate TimeFrame Multiplier (0=none)")
//
src          = close //input(close, title="EMA Source")
showRibbons  = input(true,title="Show Coloured MA Ribbons")
showAvgs     = input(true,title="Show Ribbon Median MA Lines")

//
// Fast Ribbon MAs
// Lower MA - type, length
typeF1    = input(defval="EMA", title="FAST MA Ribbon Type: ", options=["SMA", "EMA", "WMA", "VWMA", "SMMA", "DEMA", "TEMA", "LAGMA", "HullMA", "ZEMA", "TMA", "SSMA"])
lenF1     = input(defval=5, title="FAST Ribbon Lower MA Length", minval=1)
gammaF1   = 0.33 //input(defval=0.33,title="Fast MA - Gamma for LAGMA")

// Upper MA - type, length
typeF11   = typeF1 //input(defval="WMA", title="FAST Ribbon Upper MA Type: ", options=["SMA", "EMA", "WMA", "VWMA", "SMMA", "DEMA", "TEMA", "LAGMA", "HullMA", "ZEMA", "TMA", "SSMA"])
lenF11    = input(defval=25, title="FAST Ribbon Upper Length", minval=2)
gammaF11  = 0.77 //input(defval=0.77,title="Slow MA - Gamma for LAGMA")

// Slow Ribbon MAs
// Lower MA - type, length
typeS1   = input(defval="EMA", title="SLOW MA Ribbon Type: ", options=["SMA", "EMA", "WMA", "VWMA", "SMMA", "DEMA", "TEMA", "LAGMA", "HullMA", "ZEMA", "TMA", "SSMA"])
lenS1    = input(defval=28, title="SLOW Ribbon Lower MA Length", minval=1)
gammaS1  = 0.33 //input(defval=0.33,title="Fast MA - Gamma for LAGMA")

// Upper MA - type, length
typeS16   = typeS1 //input(defval="WMA", title="SLOW Ribbon Upper MA Type: ", options=["SMA", "EMA", "WMA", "VWMA", "SMMA", "DEMA", "TEMA", "LAGMA", "HullMA", "ZEMA", "TMA", "SSMA"])
lenS16    = input(defval=72, title="SLOW Ribbon Upper Length", minval=2)
gammaS16  = 0.77 //input(defval=0.77,title="Slow MA - Gamma for LAGMA")

// - Constants
gold = #FFD700

// - FUNCTIONS

// - variant(type, src, len, gamma)
// Returns MA input selection variant, default to SMA if blank or typo.

// SuperSmoother filter
// © 2013  John F. Ehlers
variant_supersmoother(src,len) =>
    a1 = exp(-1.414*3.14159 / len)
    b1 = 2*a1*cos(1.414*3.14159 / len)
    c2 = b1
    c3 = (-a1)*a1
    c1 = 1 - c2 - c3
    v9 = 0.0
    v9 := c1*(src + nz(src[1])) / 2 + c2*nz(v9[1]) + c3*nz(v9[2])
    v9

variant_smoothed(src,len) =>
    v5 = 0.0
    v5 := na(v5[1]) ? sma(src, len) : (v5[1] * (len - 1) + src) / len
    v5

variant_zerolagema(src,len) =>
    ema1 = ema(src, len)
    ema2 = ema(ema1, len)
    v10 = ema1+(ema1-ema2)
    v10

variant_doubleema(src,len) =>
    v2 = ema(src, len)
    v6 = 2 * v2 - ema(v2, len)
    v6

variant_tripleema(src,len) =>
    v2 = ema(src, len)
    v7 = 3 * (v2 - ema(v2, len)) + ema(ema(v2, len), len)               // Triple Exponential
    v7

//calc Laguerre
variant_lag(p,g) =>
    L0 = 0.0
    L1 = 0.0
    L2 = 0.0
    L3 = 0.0
    L0 := (1 - g)*p+g*nz(L0[1])
    L1 := -g*L0+nz(L0[1])+g*nz(L1[1])
    L2 := -g*L1+nz(L1[1])+g*nz(L2[1])
    L3 := -g*L2+nz(L2[1])+g*nz(L3[1])
    f = (L0 + 2*L1 + 2*L2 + L3)/6
    f

// return variant, defaults to SMA
variant(type, src, len, g) =>
    type=="EMA"     ? ema(src,len) :
      type=="WMA"   ? wma(src,len):
      type=="VWMA"  ? vwma(src,len) :
      type=="SMMA"  ? variant_smoothed(src,len) :
      type=="DEMA"  ? variant_doubleema(src,len):
      type=="TEMA"  ? variant_tripleema(src,len):
      type=="LAGMA" ? variant_lag(src,g) :
      type=="HullMA"? wma(2 * wma(src, len / 2) - wma(src, len), round(sqrt(len))) :
      type=="SSMA"  ? variant_supersmoother(src,len) :
      type=="ZEMA"  ? variant_zerolagema(src,len) :
      type=="TMA"   ? sma(sma(src,len),len) :
                      sma(src,len)

// - /variant

// If have anchor specified, calculate the base multiplier.
//mult  = isintraday ? anchor==0 or interval<=0 or interval>=anchor or anchor>1440? 1 : round(anchor/interval) : 1
//mult := isdwm?  1 : mult  // Only available Daily or less
mult = anchor>0 ? anchor : 1

//
high_  = uRenko? max(close,open) : high
low_   = uRenko? min(close,open) : low


//adjust MA lengths with Anchor Multiplier

//Fast MA Ribbon
emaF1 = variant(typeF1, src, lenF1*mult, gammaF1)
emaF11 = variant(typeF11, src, lenF11*mult,gammaF11)
emafast = (emaF1+emaF11)/2 // Average of Upper and Lower MAs
//
//Slow MA Ribbon
emaS1 = variant(typeS1,src, lenS1*mult,gammaS1)
emaS16 = variant(typeS16, src, lenS16*mult, gammaS16)
emaslow = (emaS1+emaS16)/2 // Average of Upper and Lower MAs
//
// Count crossover candles
xup = 0
xdn = 0
fup = 0
fdn = 0
sup = 0
sdn = 0
//
xup := (emafast-emaslow)>0 and (emafast-emaslow)>(emafast[1]-emaslow[1]) ? nz(xup[1])+1 : 0
xdn := (emafast-emaslow)<0 and (emafast-emaslow)<(emafast[1]-emaslow[1]) ? nz(xdn[1])+1 : 0
fup := (emaF1-emaF11)>0 and (emaF1-emaF11)>(emaF1[1]-emaF11[1]) ? nz(fup[1])+1 : 0
fdn := (emaF1-emaF11)<0 and (emaF1-emaF11)<(emaF1[1]-emaF11[1]) ? nz(fdn[1])+1 : 0
sup := (emaS1-emaS16)>0 and (emaS1-emaS16)>(emaS1[1]-emaS16[1]) ? nz(sup[1])+1 : 0
sdn := (emaS1-emaS16)<0 and (emaS1-emaS16)<(emaS1[1]-emaS16[1]) ? nz(sdn[1])+1 : 0

//Fast EMA Final Color Rules
colFinal = fup>=2 ? aqua : fdn>=2 ? blue : gray
//Slow EMA Final Color Rules
colFinal2 = sup>=2 ? lime : sdn>=2 ? red : gray

//Fast EMA Plots
p1=plot(showRibbons?emaF1:na, title="Fast Ribbon Lower MA", style=line, linewidth=1, color=colFinal,transp=10)
p2=plot(showRibbons?emaF11:na, title="Fast Ribbon Upper MA", style=line, linewidth=1, color=colFinal,transp=10)
plot(showAvgs?emafast:na, title="Fast Ribbon Avg MA", style=circles,join=true, linewidth=1, color=gold,transp=10)

//
fill(p1,p2,color=colFinal, transp=90)

//Slow EMA Plots
p3=plot(showRibbons?emaS1:na, title="Slow Ribbon Lower MA", style=line, linewidth=1, color=colFinal2,transp=10)
p4=plot(showRibbons?emaS16:na, title="Slow Ribbon Upper MA", style=line, linewidth=1, color=colFinal2,transp=10)
plot(showAvgs?emaslow:na, title="Slow Ribbon Avg MA", style=circles,join=true, linewidth=1, color=fuchsia,transp=10)
//
fill(p3,p4, color=colFinal2, transp=90)

// Generate Buy Sell signals,
buy = 0
sell=0
//
buy  := xup>=2 and sup>=2 and fup>=2 ? nz(buy[1])>0?buy[1]+1:1 : 0
sell := xdn>=2 and sdn>=2 and fdn>=2 ? nz(sell[1])>0?sell[1]+1 :1 : 0
//

//////////////////////////////////////////////////
//* Put Entry and special Exit conditions here *//
//////////////////////////////////////////////////
//////////////////////////////////////////////////////////////////////////////////////////
//*** This Trade Management Section of code is a modified version of that found in   ***//
//*** "How to automate this strategy for free using a chrome extension" by CryptoRox ***//
//*** Modifications made by JustUncleL.                                              ***//
//////////////////////////////////////////////////////////////////////////////////////////
//


///////////////////////////////////////////////
//* Backtesting Period Selector | Component *//
///////////////////////////////////////////////

//* https://www.tradingview.com/script/eCC1cvxQ-Backtesting-Period-Selector-Component *//
//* https://www.tradingview.com/u/pbergden/ *//
//* Modifications made by JustUncleL*//

testStartYear = input(2018, "Backtest Start Year",minval=1980)
testStartMonth = input(1, "Backtest Start Month",minval=1,maxval=12)
testStartDay = input(1, "Backtest Start Day",minval=1,maxval=31)
testPeriodStart = timestamp(testStartYear,testStartMonth,testStartDay,0,0)

testStopYear = 9999 //input(9999, "Backtest Stop Year",minval=1980)
testStopMonth = 12 // input(12, "Backtest Stop Month",minval=1,maxval=12)
testStopDay = 31 //input(31, "Backtest Stop Day",minval=1,maxval=31)
testPeriodStop = timestamp(testStopYear,testStopMonth,testStopDay,0,0)

testPeriod() => true

///////////////////////////////////////////////
//* Place Entry and Special Exit Logic here *//
///////////////////////////////////////////////

AQUA = #00FFFFFF
BLUE = #0000FFFF
RED  = #FF0000FF
LIME = #00FF00FF
GRAY = #808080FF
DARKRED   = #8B0000FF
DARKGREEN = #006400FF

// Keep current state until opposite signal detected.
bsState = 0, bsState := nz(bsState[1])
bsState := buy==1 and bsState<=0? 1 :
           sell==1 and bsState>=0? -1 :
           bsState

//Entry Conditions, when state changes direction.
longLogic  = change(bsState) and bsState==1  and (barstate.isconfirmed or barstate.ishistory)
shortLogic = change(bsState) and bsState==-1  and (barstate.isconfirmed or barstate.ishistory)

// Exit on Sell signal
longExitC = 0
shortExitC = 0
longExitC   := (emafast<emaslow and close<emaslow)
                  and (barstate.isconfirmed or barstate.ishistory) ? nz(longExitC[1])+1 : 0
shortExitC  := (emafast>emaslow and close>emaslow)
                  and (barstate.isconfirmed or barstate.ishistory) ? nz(shortExitC[1])+1 : 0

// Exit condition for no SL.
longExit = change(longExitC) and longExitC==1
shortExit = change(shortExitC) and shortExitC==1


//////////////////////////
//* Strategy Component *//
//////////////////////////

fastExit  = input(false,title="Use Opposite Trade as a Close Signal")
clrBars   = input(true,title="Colour Candles to Trade Order state")

orderType = input("LongsOnly",title="What type of Orders", options=["Longs+Shorts","LongsOnly","ShortsOnly","Flip"])

//
isLong   = (orderType != "ShortsOnly")
isShort  = (orderType != "LongsOnly")
//
long = longLogic
short = shortLogic

if orderType=="Flip"
    long := shortLogic
    short := longLogic


////////////////////////////////
//======[ Signal Count ]======//
////////////////////////////////

sectionLongs = 0
sectionLongs := nz(sectionLongs[1])
sectionShorts = 0
sectionShorts := nz(sectionShorts[1])

if long and isLong
    sectionLongs := sectionLongs + 1
    sectionShorts := 0

if short and isShort
    sectionLongs := 0
    sectionShorts := sectionShorts + 1

longCondition  = (long and isLong)
shortCondition = (short and isShort)

////////////////////////////////
//======[ Entry Prices ]======//
////////////////////////////////

last_open_longCondition = na
last_open_shortCondition = na
last_open_longCondition := longCondition ? close : nz(last_open_longCondition[1])
last_open_shortCondition := shortCondition ? close : nz(last_open_shortCondition[1])

///////////////////////////////////////////////
//======[ Position Check (long/short) ]======//
///////////////////////////////////////////////

last_longCondition = na
last_shortCondition = na
last_longCondition  := longCondition ? time : nz(last_longCondition[1])
last_shortCondition := shortCondition ? time : nz(last_shortCondition[1])

in_longCondition  = last_longCondition > last_shortCondition
in_shortCondition = last_shortCondition > last_longCondition

/////////////////////////////////
//======[ Trailing Stop ]======//
/////////////////////////////////

isTS = input(true, "Trailing Stop")
ts = input(3.0, "Trailing Stop (%)", minval=0,step=0.1, type=float) /100

last_high = na
last_low = na
last_high_short = na
last_low_long = na
last_high := not in_longCondition ? na : in_longCondition and (na(last_high[1]) or high_ > nz(last_high[1])) ? high_ : nz(last_high[1])
last_high_short := not in_shortCondition ? na : in_shortCondition and (na(last_high[1]) or high_ > nz(last_high[1])) ? high_ : nz(last_high[1])
last_low := not in_shortCondition ? na : in_shortCondition and (na(last_low[1]) or low_ < nz(last_low[1])) ? low_ : nz(last_low[1])
last_low_long := not in_longCondition ? na : in_longCondition and (na(last_low[1]) or low_ < nz(last_low[1])) ? low_ : nz(last_low[1])

long_ts = isTS and not na(last_high) and (low_ <= last_high - last_high * ts) //and (last_high >= last_open_longCondition + last_open_longCondition * tsi)
short_ts = isTS and not na(last_low) and (high_ >= last_low + last_low * ts) //and (last_low <= last_open_shortCondition - last_open_shortCondition * tsi)


///////////////////////////////
//======[ Take Profit ]======//
///////////////////////////////

isTP = input(true, "Take Profit")
tp = input(3.0, "Take Profit (%)",minval=0,step=0.1,type=float) / 100
ttp = input(1.0, "Trailing Profit (%)",minval=0,step=0.1,type=float) / 100
ttp := ttp>tp ? tp : ttp

long_tp = isTP and (last_high >= last_open_longCondition + last_open_longCondition * tp)   and (low_ <= last_high - last_high * ttp)
short_tp = isTP and (last_low <= last_open_shortCondition - last_open_shortCondition * tp) and (high_ >= last_low + last_low * ttp)

/////////////////////////////
//======[ Stop Loss ]======//
/////////////////////////////

isSL = input(false, "Stop Loss")
sl = input(3.0, "Stop Loss (%)", minval=0,step=0.1, type=float) / 100
long_sl = isSL and (low_ <= last_open_longCondition - last_open_longCondition * sl)
short_sl = isSL and (high_ >= last_open_shortCondition + last_open_shortCondition * sl)

////////////////////////////////////
//======[ Stop on Opposite ]======//
////////////////////////////////////

//NOTE Short exit signal is non-repainting, no need to force it, if Pyramiding keep going
long_sos = (fastExit or (not isTS and not isSL)) and longExit
short_sos = (fastExit or (not isTS and not isSL)) and shortExit

/////////////////////////////////
//======[ Close Signals ]======//
/////////////////////////////////

// Create a single close for all the different closing conditions, all conditions here are non-repainting
longClose = isLong and (long_tp or long_sl or long_ts or long_sos) and not longCondition
shortClose = isShort and (short_tp or short_sl or short_ts or short_sos) and not shortCondition

in_closeLong = longClose
in_closeLong := not isLong? false : longClose ? true : longCondition? false : in_closeLong[1]
in_closeShort = shortClose
in_closeShort := not isShort? false : shortClose ? true : shortCondition? false : in_closeShort[1]

///////////////////////////////
//======[ Plot Colors ]======//
///////////////////////////////

longCloseCol = na
shortCloseCol = na
longCloseCol := long_tp ? green : long_sl ? maroon : long_ts ? purple : long_sos ? orange :longCloseCol[1]
shortCloseCol := short_tp ? green : short_sl ? maroon : short_ts ? purple : short_sos ? orange : shortCloseCol[1]
//
tpColor = isTP and in_longCondition ? lime : isTP and in_shortCondition ? lime : na
slColor = isSL and in_longCondition ? red : isSL and in_shortCondition ? red : na


//////////////////////////////////
//======[ Strategy Plots ]======//
//////////////////////////////////

plot(isTS and in_longCondition and isLong and not in_closeLong?
     last_high - last_high * ts : na, "Long Trailing", fuchsia, style=2, linewidth=2,offset=1)
plot(isTP and in_longCondition and isLong and not in_closeLong and last_high < last_open_longCondition + last_open_longCondition * tp ?
     last_open_longCondition + last_open_longCondition * tp : na, "Long TP Active", tpColor, style=3,join=false, linewidth=2,offset=1)
plot(isTP and in_longCondition and isLong and not in_closeLong and last_high >= last_open_longCondition +  last_open_longCondition * tp ?
     last_high - last_high * ttp : na, "Long Trailing", black, style=2, linewidth=2,offset=1)
plot(isSL and in_longCondition and isLong and not in_closeLong and last_low_long > last_open_longCondition - last_open_longCondition * sl ?
     last_open_longCondition - last_open_longCondition * sl : na, "Long SL", slColor, style=3,join=false, linewidth=2,offset=1)
//
plot(isTS and in_shortCondition and isShort and not in_closeShort?
     last_low + last_low * ts : na, "Short Trailing", fuchsia, style=2, linewidth=2,offset=1)
plot(isTP and in_shortCondition and isShort and not in_closeShort and last_low > last_open_shortCondition - last_open_shortCondition * tp ?
     last_open_shortCondition - last_open_shortCondition * tp : na, "Short TP Active", tpColor, style=3,join=false, linewidth=2,offset=1)
plot(isTP and in_shortCondition and isShort and not in_closeShort and last_low <= last_open_shortCondition -  last_open_shortCondition * tp ?
     last_low + last_low * ttp : na, "Short Trailing", black, style=2, linewidth=2,offset=1)
plot(isSL and in_shortCondition and isShort and not in_closeShort and last_high_short < last_open_shortCondition + last_open_shortCondition * sl ?
     last_open_shortCondition + last_open_shortCondition * sl : na, "Short SL", slColor, style=3,join=false, linewidth=2,offset=1)
//
bclr = not clrBars ? na : in_closeLong and in_closeShort ? GRAY :
                          in_longCondition and not in_closeLong and isLong ? close<last_open_longCondition? DARKGREEN : LIME :
                          in_shortCondition and not in_closeShort and isShort ? close>last_open_shortCondition? DARKRED : RED : GRAY
barcolor(bclr,title="Trade State Bar Colouring")


///////////////////////////////
//======[ Alert Plots ]======//
///////////////////////////////

//plotshape(longCondition?close:na, title="Long", color=green, textcolor=green, transp=0,
//          style=shape.triangleup, location=location.belowbar, size=size.small,text="LONG",offset=0)
//plotshape(longClose and not in_closeLong[1]?close:na, title="Long Close", color=longCloseCol, textcolor=white, transp=0,
//          style=shape.labeldown, location=location.abovebar, size=size.small,text="Long\nClose",offset=0)

//plotshape(shortCondition?close:na, title="Short", color=red, textcolor=red, transp=0,
//          style=shape.triangledown, location=location.abovebar, size=size.small,text="SHORT",offset=0)
//plotshape(shortClose and not in_closeShort[1]?close:na, title="Short Close", color=shortCloseCol, textcolor=white, transp=0,
//          style=shape.labelup, location=location.belowbar, size=size.small,text="Short\nClose",offset=0)

// Autoview alert syntax - This assumes you are trading coins BUY and SELL on Binance Exchange
// WARNING*** Only use Autoview to automate a strategy after you've sufficiently backtested and forward tested the strategy.
// You can learn more about the syntax here:
//      http://autoview.with.pink/#syntax and you can watch this video here: https://www.youtube.com/watch?v=epN5Tjinuxw

// For the opens you will want to trigger BUY orders on LONGS (eg ETHBTC) with alert option "Once Per Bar Close"
// and SELL orders on SHORTS (eg BTCUSDT)
//      b=buy q=0.001 e=binance s=ethbtc t=market  ( LONG )
// or   b=sell q=0.001 e=binance s=btcusdt t=market ( SHORT )
//alertcondition(longCondition, "Open Long", "LONG")
//alertcondition(shortCondition, "Open Short", "SHORT")

// For the closes you will want to trigger these alerts on condition with alert option "Once Per Bar"
// (NOTE: with Renko you can only use "Once Per Bar Close" option)
//      b=sell q=99% e=binance s=ethbtc t=market  ( CLOSE LONGS )
// or   b=buy q=99% e=binance s=btcusdt t=market  ( CLOSE SHORTS )
// This gets it as it happens and typically results in a better exit live than in the backtest.
// It works really well for counteracting some market slippage
//alertcondition(longClose and not in_closeLong[1], "Close Longs", "CLOSE LONGS")
//alertcondition(shortClose and not in_closeShort[1], "Close Shorts", "CLOSE SHORTS")

////////////////////////////////////////////
//======[ Strategy Entry and Exits ]======//
////////////////////////////////////////////

if testPeriod() and isLong
    strategy.entry("Long", 1, when=longCondition)
    strategy.close("Long", when=longClose and not in_closeLong[1])

if testPeriod() and isShort
    strategy.entry("Short", 0,  when=shortCondition)
    strategy.close("Short", when=shortClose and not in_closeShort[1])

// --- Debugs
//plotchar(longExit,location=location.bottom)
//plotchar(longCondition,location=location.bottom)
//plotchar(in_longCondition,location=location.bottom)
//plotchar(longClose,location=location.bottom)
//plotchar(in_closeLong,location=location.bottom)
// --- /Debugs

///////////////////////////////////
//======[ Reset Variables ]======//
///////////////////////////////////

if longClose or not in_longCondition or not isLong
    last_high := na
    last_high_short := na
    sectionLongs := 0

if longClose and isLong and not in_closeLong[1] and bsState==1
    bsState := 0

if shortClose or not in_shortCondition or not isShort
    last_low := na
    last_low_long := na
    sectionShorts := 0

if shortClose and isShort and not in_closeShort[1] and bsState==-1
    bsState := 0


//plotchar(bsState,location=location.bottom)
// EOF