Стратегия прорыва импульса двойной МА
Обзор
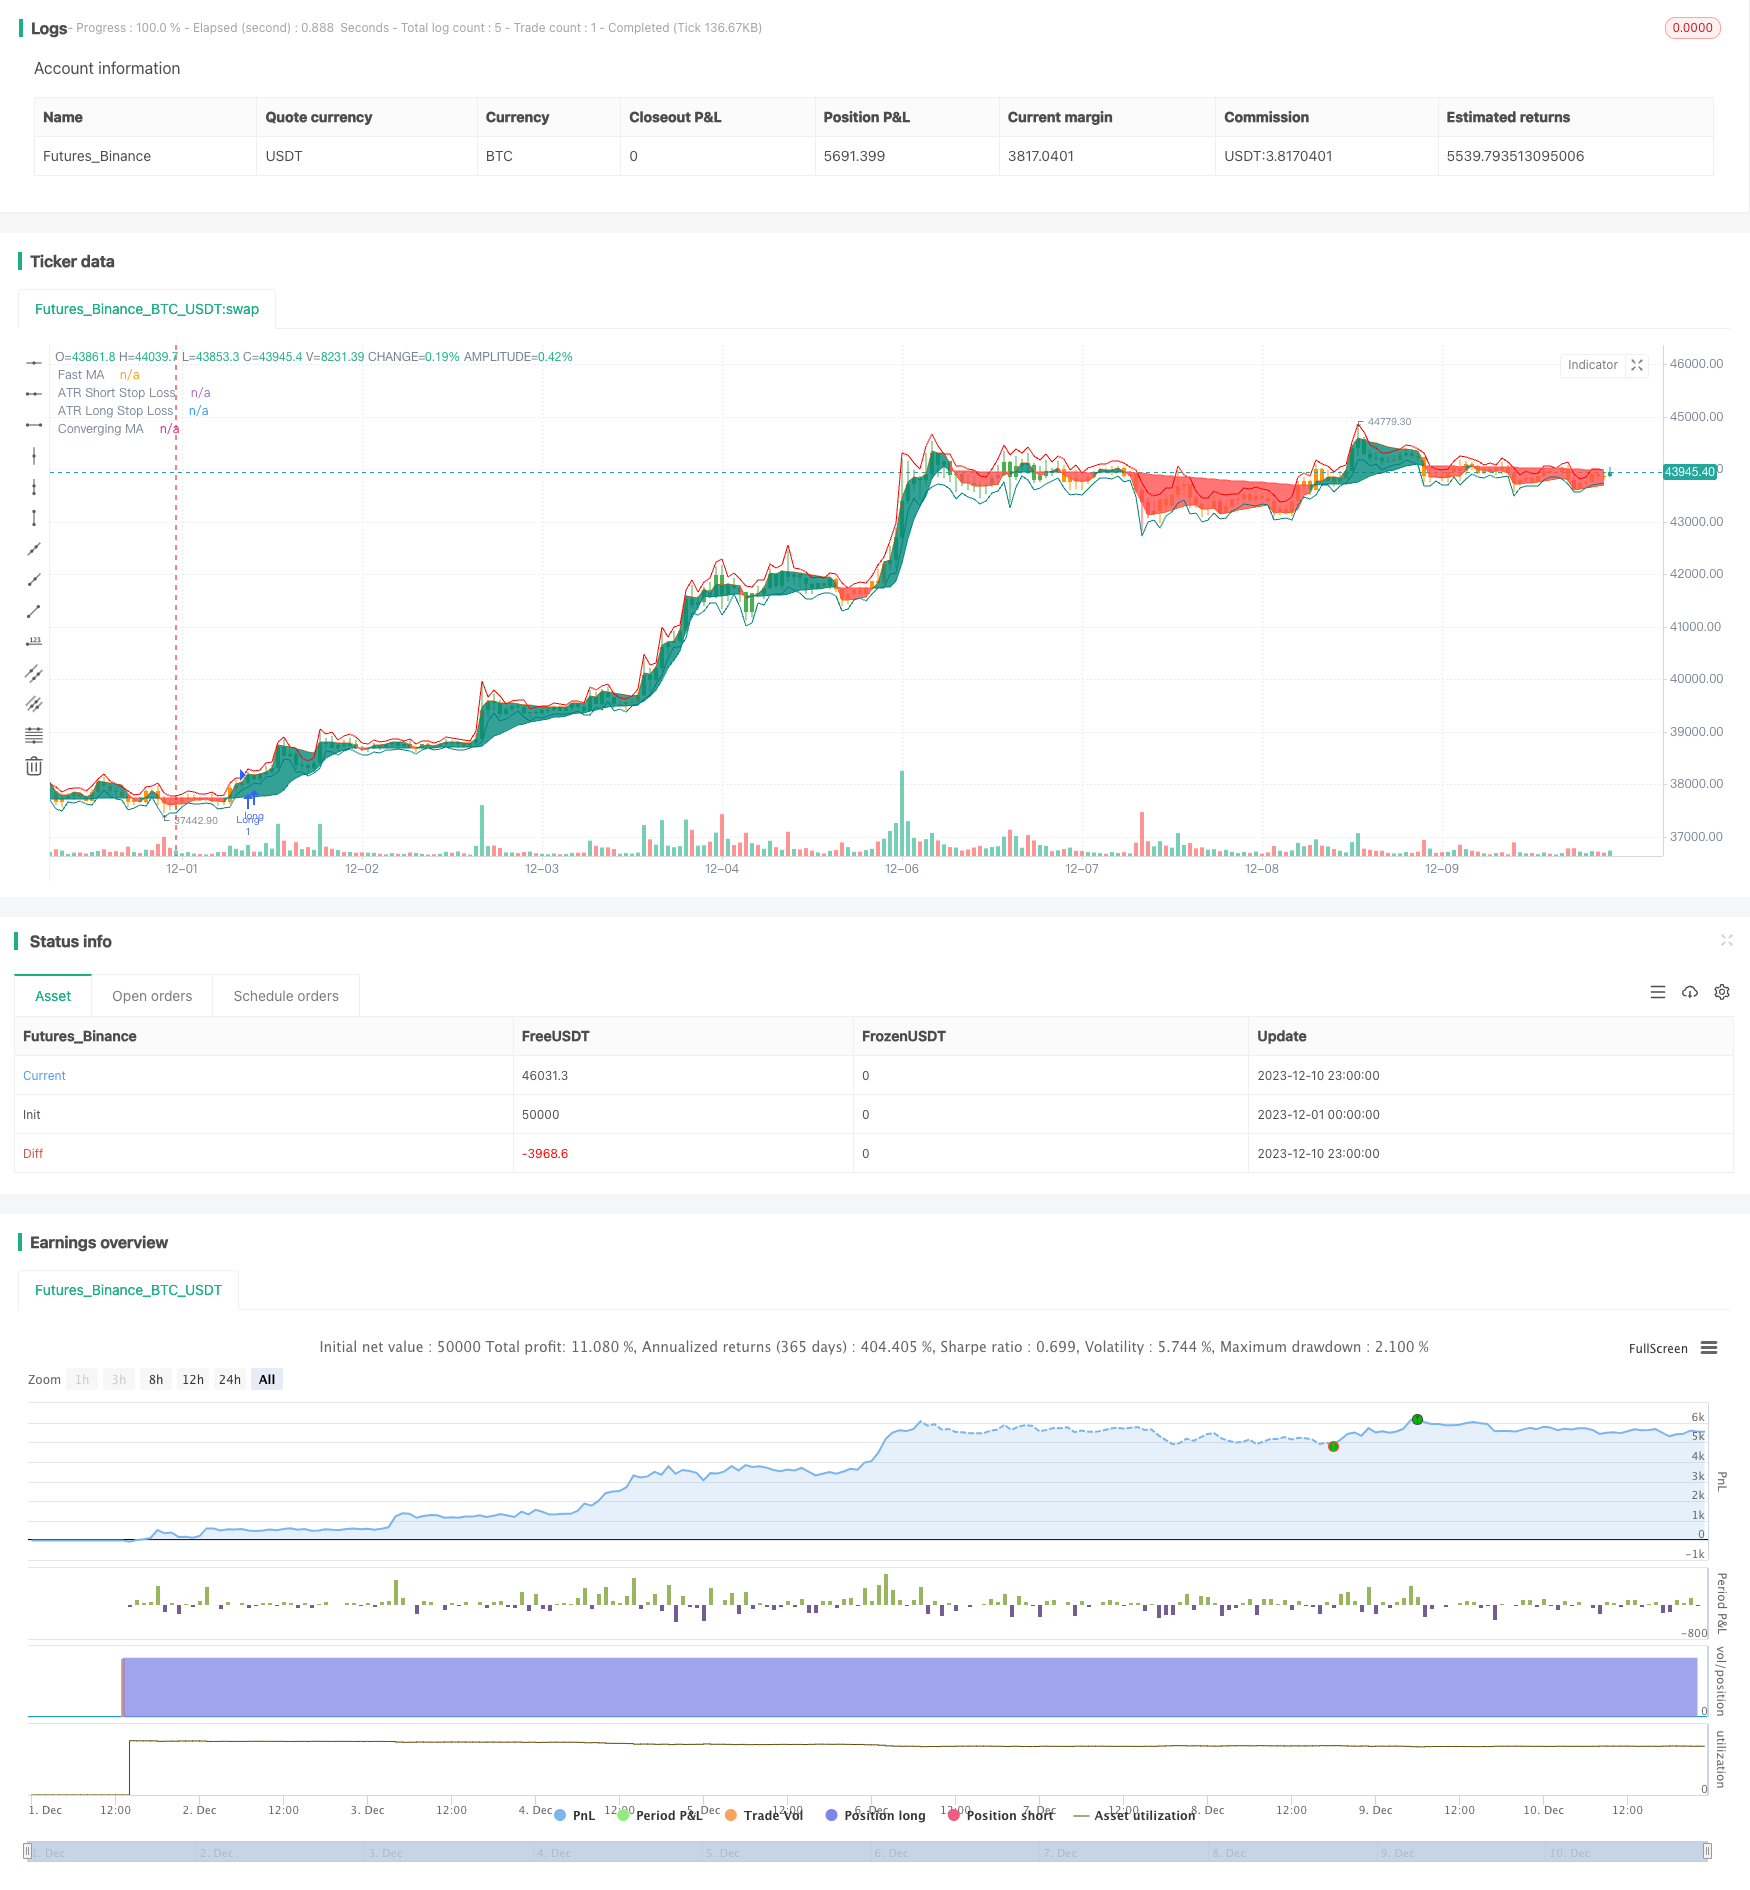
Движущаяся стратегия двойного МА - это количественная торговая стратегия, объединяющая двойные движущиеся средние и RSI. Эта стратегия устанавливает перекуп и перепродажу RSI, используя быстрое движение средних и медленное движение средних и RSI, чтобы уловить тенденцию рынка.
Стратегический принцип
Двойная стратегия прорыва движущейся массы основана на двух движущихся средних и RSI. Сначала вычисляется два движущихся средних, быстрое - 10-дневная взвешенная движущаяся средняя, медленное - 100-дневная линейная адаптированная движущаяся средняя. Затем вычисляется 14-дневный RSI и устанавливается превышение торгового превышения.
В частности, при оценке как сверхтяжелый курс, если RSI в данный момент выше, чем линия сверхпокупа, открывается сверхтяжелый курс; при оценке как сверхтяжелый курс, если RSI ниже, чем линия сверхпродажи, открывается сверхтяжелый курс. После открытия позиции открывается обратный курс, когда происходит обратный сигнал.
Стратегические преимущества
Стратегия двойного прорыва MA в сочетании с двумя показателями MA и RSI позволяет эффективно идентифицировать рыночные тенденции и использовать RSI, чтобы отфильтровать ложные прорывы, что повышает надежность торговых сигналов. По сравнению с системой с одним MA, эта стратегия может значительно снизить количество недействительных сделок. Кроме того, оптимизация параметров RSI также придает стратегии гибкость.
Стратегический риск
Также существует риск, связанный со стратегией прорыва двойной МА. Система двойной МА очень чувствительна к параметрам и требует тщательного тестирования параметров для различных рынков. Кроме того, ненадлежащие пороги, установленные индикатором RSI, могут привести к упущенным торговым возможностям.
Оптимизация стратегии
Стратегия прорыва с двойной динамикой MA может быть оптимизирована в следующих аспектах:
- Оптимизация параметров быстрого и медленного МА для поиска оптимальной комбинации параметров;
- Оптимизация параметров RSI для корректировки находящихся на грани перекупа и перепродажи;
- Увеличение адаптивных механизмов мобильной остановки убытков для контроля риска;
- Добавление модуля оптимизации объема открытых складов, повышение эффективности использования средств.
Подвести итог
Двойная MA-подвижная стратегия для определения направления тенденции с помощью системы двойной MA и фильтрации сигналов RSI может эффективно улучшить недостатки системы с одной MA. Эта стратегия имеет большое пространство для оптимизации параметров и может быть адаптирована. Это отличная стратегия для отслеживания тенденции.
/*backtest
start: 2023-12-01 00:00:00
end: 2023-12-10 23:59:59
period: 1h
basePeriod: 15m
exchanges: [{"eid":"Futures_Binance","currency":"BTC_USDT"}]
*/

// This work is licensed under a Attribution-NonCommercial-ShareAlike 4.0 International (CC BY-NC-SA 4.0) https://creativecommons.org/licenses/by-nc-sa/4.0/
// © Salman4sgd

//@version=5
strategy("MAConverging + QQE Threshold Strategy", overlay = true)
//------------------------------------------------------------------------------
//Settings
//-----------------------------------------------------------------------------{
length = input(100)

incr   = input(10, "Increment")

fast   = input(10)

src    = input(close)

//-----------------------------------------------------------------------------}
//Calculations
//-----------------------------------------------------------------------------{
var ma    = 0.
var fma   = 0.
var alpha = 0.
var k     = 1 / incr

upper = ta.highest(length)
lower = ta.lowest(length)
init_ma = ta.sma(src, length)

cross = ta.cross(src,ma)

alpha := cross ? 2 / (length + 1)
  : src > ma and upper > upper[1] ? alpha + k
  : src < ma and lower < lower[1] ? alpha + k
  : alpha

ma := nz(ma[1] + alpha[1] * (src - ma[1]), init_ma)

fma := nz(cross ? math.avg(src, fma[1])
  : src > ma ? math.max(src, fma[1]) + (src - fma[1]) / fast
  : math.min(src, fma[1]) + (src - fma[1]) / fast,src)

//-----------------------------------------------------------------------------}
//Plots
//-----------------------------------------------------------------------------{
css = fma > ma ? color.teal : color.red

plot0 = plot(fma, "Fast MA"
  , color = #ff5d00
  , transp = 100)

plot1 = plot(ma, "Converging MA"
  , color = css)

fill(plot0, plot1, css
  , "Fill"
  , transp = 80)

//-----------------------------------------------------------------------------}

RSI_Period = input(14, title='RSI Length')
SF = input(5, title='RSI Smoothing')
QQE = input(4.238, title='Fast QQE Factor')
ThreshHold = input(10, title='Thresh-hold')
//
sQQEx = input(false, title='Show Smooth RSI, QQE Signal crosses')
sQQEz = input(false, title='Show Smooth RSI Zero crosses')
sQQEc = input(false, title='Show Smooth RSI Thresh Hold Channel Exits')
ma_type = input.string(title='MA Type', defval='EMA', options=['ALMA', 'EMA', 'DEMA', 'TEMA', 'WMA', 'VWMA', 'SMA', 'SMMA', 'HMA', 'LSMA', 'PEMA'])
lsma_offset = input.int(defval=0, title='* Least Squares (LSMA) Only - Offset Value', minval=0)
alma_offset = input.float(defval=0.85, title='* Arnaud Legoux (ALMA) Only - Offset Value', minval=0, step=0.01)
alma_sigma = input.int(defval=6, title='* Arnaud Legoux (ALMA) Only - Sigma Value', minval=0)
inpDrawBars = input(true, title='color bars?')


ma(type, src, len) =>
    float result = 0
    if type == 'SMA'  // Simple
        result := ta.sma(src, len)
        result
    if type == 'EMA'  // Exponential
        result := ta.ema(src, len)
        result
    if type == 'DEMA'  // Double Exponential
        e = ta.ema(src, len)
        result := 2 * e - ta.ema(e, len)
        result
    if type == 'TEMA'  // Triple Exponential
        e = ta.ema(src, len)
        result := 3 * (e - ta.ema(e, len)) + ta.ema(ta.ema(e, len), len)
        result
    if type == 'WMA'  // Weighted
        result := ta.wma(src, len)
        result
    if type == 'VWMA'  // Volume Weighted
        result := ta.vwma(src, len)
        result
    if type == 'SMMA'  // Smoothed
        w = ta.wma(src, len)
        result := na(w[1]) ? ta.sma(src, len) : (w[1] * (len - 1) + src) / len
        result
    if type == 'HMA'  // Hull
        result := ta.wma(2 * ta.wma(src, len / 2) - ta.wma(src, len), math.round(math.sqrt(len)))
        result
    if type == 'LSMA'  // Least Squares
        result := ta.linreg(src, len, lsma_offset)
        result
    if type == 'ALMA'  // Arnaud Legoux
        result := ta.alma(src, len, alma_offset, alma_sigma)
        result
    if type == 'PEMA'
        // Copyright (c) 2010-present, Bruno Pio
        // Copyright (c) 2019-present, Alex Orekhov (everget)
        // Pentuple Exponential Moving Average script may be freely distributed under the MIT license.
        ema1 = ta.ema(src, len)
        ema2 = ta.ema(ema1, len)
        ema3 = ta.ema(ema2, len)
        ema4 = ta.ema(ema3, len)
        ema5 = ta.ema(ema4, len)
        ema6 = ta.ema(ema5, len)
        ema7 = ta.ema(ema6, len)
        ema8 = ta.ema(ema7, len)
        pema = 8 * ema1 - 28 * ema2 + 56 * ema3 - 70 * ema4 + 56 * ema5 - 28 * ema6 + 8 * ema7 - ema8
        result := pema
        result
    result

src := input(close, title='RSI Source')
//

//
Wilders_Period = RSI_Period * 2 - 1


Rsi = ta.rsi(src, RSI_Period)
RsiMa = ma(ma_type, Rsi, SF)
AtrRsi = math.abs(RsiMa[1] - RsiMa)
MaAtrRsi = ma(ma_type, AtrRsi, Wilders_Period)
dar = ma(ma_type, MaAtrRsi, Wilders_Period) * QQE

longband = 0.0
shortband = 0.0
trend = 0

DeltaFastAtrRsi = dar
RSIndex = RsiMa
newshortband = RSIndex + DeltaFastAtrRsi
newlongband = RSIndex - DeltaFastAtrRsi
longband := RSIndex[1] > longband[1] and RSIndex > longband[1] ? math.max(longband[1], newlongband) : newlongband
shortband := RSIndex[1] < shortband[1] and RSIndex < shortband[1] ? math.min(shortband[1], newshortband) : newshortband
cross_1 = ta.cross(longband[1], RSIndex)
trend := ta.cross(RSIndex, shortband[1]) ? 1 : cross_1 ? -1 : nz(trend[1], 1)
FastAtrRsiTL = trend == 1 ? longband : shortband

//
// Find all the QQE Crosses
QQExlong = 0
QQExlong := nz(QQExlong[1])
QQExshort = 0
QQExshort := nz(QQExshort[1])
QQExlong := sQQEx and FastAtrRsiTL < RSIndex ? QQExlong + 1 : 0
QQExshort := sQQEx and FastAtrRsiTL > RSIndex ? QQExshort + 1 : 0
// Zero cross
QQEzlong = 0
QQEzlong := nz(QQEzlong[1])
QQEzshort = 0
QQEzshort := nz(QQEzshort[1])
QQEzlong := sQQEz and RSIndex >= 50 ? QQEzlong + 1 : 0
QQEzshort := sQQEz and RSIndex < 50 ? QQEzshort + 1 : 0
//
// Thresh Hold channel Crosses give the BUY/SELL alerts.
QQEclong = 0
QQEclong := nz(QQEclong[1])
QQEcshort = 0
QQEcshort := nz(QQEcshort[1])
QQEclong := sQQEc and RSIndex > 50 + ThreshHold ? QQEclong + 1 : 0
QQEcshort := sQQEc and RSIndex < 50 - ThreshHold ? QQEcshort + 1 : 0


// // QQE exit from Thresh Hold Channel
// plotshape(sQQEc and QQEclong == 1 ? RsiMa - 50 : na, title='QQE XC Over Channel', style=shape.diamond, location=location.absolute, color=color.new(color.olive, 0), size=size.small, offset=0)
// plotshape(sQQEc and QQEcshort == 1 ? RsiMa - 50 : na, title='QQE XC Under Channel', style=shape.diamond, location=location.absolute, color=color.new(color.red, 0), size=size.small, offset=0)
// // QQE crosses
// plotshape(sQQEx and QQExlong == 1 ? FastAtrRsiTL[1] - 50 : na, title='QQE XQ Cross Over', style=shape.circle, location=location.absolute, color=color.new(color.lime, 0), size=size.small, offset=-1)
// plotshape(sQQEx and QQExshort == 1 ? FastAtrRsiTL[1] - 50 : na, title='QQE XQ Cross Under', style=shape.circle, location=location.absolute, color=color.new(color.blue, 0), size=size.small, offset=-1)
// // Signal crosses zero line
// plotshape(sQQEz and QQEzlong == 1 ? RsiMa - 50 : na, title='QQE XZ Zero Cross Over', style=shape.square, location=location.absolute, color=color.new(color.aqua, 0), size=size.small, offset=0)
// plotshape(sQQEz and QQEzshort == 1 ? RsiMa - 50 : na, title='QQE XZ Zero Cross Under', style=shape.square, location=location.absolute, color=color.new(color.fuchsia, 0), size=size.small, offset=0)

// hcolor = RsiMa - 50 > ThreshHold ? color.green : RsiMa - 50 < 0 - ThreshHold ? color.red : color.orange
// plot(FastAtrRsiTL - 50, color=color.new(color.blue, 0), linewidth=2)
// p1 = plot(RsiMa - 50, color=color.new(color.orange, 0), linewidth=2)
// plot(RsiMa - 50, color=hcolor, style=plot.style_columns, transp=50)


// hZero = hline(0, color=color.black, linestyle=hline.style_dashed, linewidth=1)
// hUpper = hline(ThreshHold, color=color.green, linestyle=hline.style_dashed, linewidth=2)
// hLower = hline(0 - ThreshHold, color=color.red, linestyle=hline.style_dashed, linewidth=2)
// fill(hUpper, hLower, color=color.new(color.gray, 80))
//EOF

length := input.int(title='ATR Length', defval=14, minval=1)
smoothing = input.string(title='ATR Smoothing', defval='RMA', options=['RMA', 'SMA', 'EMA', 'WMA'])
m = input(0.3, 'ATR Multiplier')
src1 = input(high)
src2 = input(low)
pline = input(true, 'Show Price Lines')
col1 = input(color.blue, 'ATR Text Color')
col2 = input.color(color.teal, 'Low Text Color', inline='1')
col3 = input.color(color.red, 'High Text Color', inline='2')

collong = input.color(color.teal, 'Low Line Color', inline='1')
colshort = input.color(color.red, 'High Line Color', inline='2')

ma_function(source, length) =>
    if smoothing == 'RMA'
        ta.rma(source, length)
    else
        if smoothing == 'SMA'
            ta.sma(source, length)
        else
            if smoothing == 'EMA'
                ta.ema(source, length)
            else
                ta.wma(source, length)

a = ma_function(ta.tr(true), length) * m
s_sl = ma_function(ta.tr(true), length) * m + src1
l_sl = src2 - ma_function(ta.tr(true), length) * m

p1 = plot(s_sl, title='ATR Short Stop Loss', color=colshort, trackprice=pline ? true : false, transp=20)
p2 = plot(l_sl, title='ATR Long Stop Loss', color=collong, trackprice=pline ? true : false, transp=20)


bgc = RsiMa - 50 > ThreshHold ? color.green : Rsi - 50 < 0 - ThreshHold ? color.red : color.orange
barcolor(inpDrawBars ? bgc : na)
prebuy = RsiMa - 50 > ThreshHold
buy=prebuy and not(prebuy[1]) and fma > ma

var long_tp=0.0
var long_sl=0.0
var short_tp=0.0
var short_sl=0.0

if prebuy
    strategy.close("Short")


if buy and strategy.position_size<=0
    strategy.entry("Long", strategy.long)
    long_sl:=l_sl
    long_tp:=close+(close-long_sl)*2


//if strategy.position_size>0
strategy.exit("L_SL","Long",stop=long_sl)
    //strategy.exit("L_SL","Long",stop=long_sl)
// if low<long_sl[1]
//     strategy.close("Long")

presell=RsiMa - 50 < 0 - ThreshHold // RsiMa - 50 < 0 - ThreshHold
sell= presell and not(presell[1]) and fma < ma

//plotshape(presell)

if presell
    strategy.close("Long")

if sell and strategy.position_size>=0
    strategy.entry("Short", strategy.short)
    short_sl:=s_sl
    short_tp:=close-(short_sl-close)*2

//if strategy.position_size<0
strategy.exit("S_SL","Short",stop=short_sl)
    //strategy.exit("S_SL","Short",stop=short_sl)