Стратегия отслеживания импульса в разных временных рамках
Обзор
Эта стратегия позволяет отслеживать динамику по временным рамкам, используя в сочетании 123 обратный и MACD индикаторы. 123 обратный определяет краткосрочные трендовые обратные точки, а MACD определяет среднесрочные тренды, которые в сочетании с этим обеспечивают задержку среднесрочных трендовых сигналов, одновременно блокируя краткосрочные обратные точки.
Стратегический принцип
Стратегия состоит из двух частей:
123 Обратная сторона: две текущие K-линии образуют высокие/низкие точки, и произвольный индикатор дает сигнал купить/продать, когда он ниже/выше 50.
Часть MACD: на быстрой линии при прохождении медленной линии создается сигнал покупки, на нижней линии при прохождении медленной линии создается сигнал продажи.
В конечном счете, когда они объединяются, то есть когда 123 поворачивает, а MACD также производит синхронный сигнал, испускается окончательный сигнал.
Анализ преимуществ
Эта стратегия сочетает в себе краткосрочные реверсии и среднесрочные тенденции, что позволяет зафиксировать среднесрочные тенденции в краткосрочных колебаниях, что позволяет получить более высокую выигрышную вероятность. Особенно в шокирующих ситуациях можно отфильтровать часть шума с помощью 123 реверсий, что повышает стабильность.
Кроме того, с помощью корректировки параметров можно сбалансировать соотношение обратных и трендовых сигналов, чтобы адаптироваться к различным рыночным условиям.
Анализ рисков
Эта стратегия имеет определенную временную задержку, особенно при использовании длительного цикла MACD, и может пропустить краткосрочные события. Кроме того, обратный сигнал сам по себе имеет некоторую степень случайности и легко поддается блокировке.
Можно уместно сократить цикл MACD или увеличить стоп-лосс, чтобы контролировать риск.
Направление оптимизации
Эта стратегия может быть оптимизирована в следующих аспектах:
Настройка 123 для оптимизации обратного эффекта
Настройка MACD-параметров для оптимизации трендовых суждений
Добавление фильтров на другие вспомогательные показатели для повышения эффективности
Повышение стратегии по борьбе с убытками и снижение риска
Подвести итог
Эта стратегия объединяет в себе множество параметров и технических показателей с несколькими временными рамками, сбалансировав преимущества обратной торговли и трендовой торговли путем отслеживания динамики с помощью временных рамок. Эффекты балансирования могут быть скорректированы с помощью параметров и могут быть оптимизированы путем введения большего количества показателей или остановок.
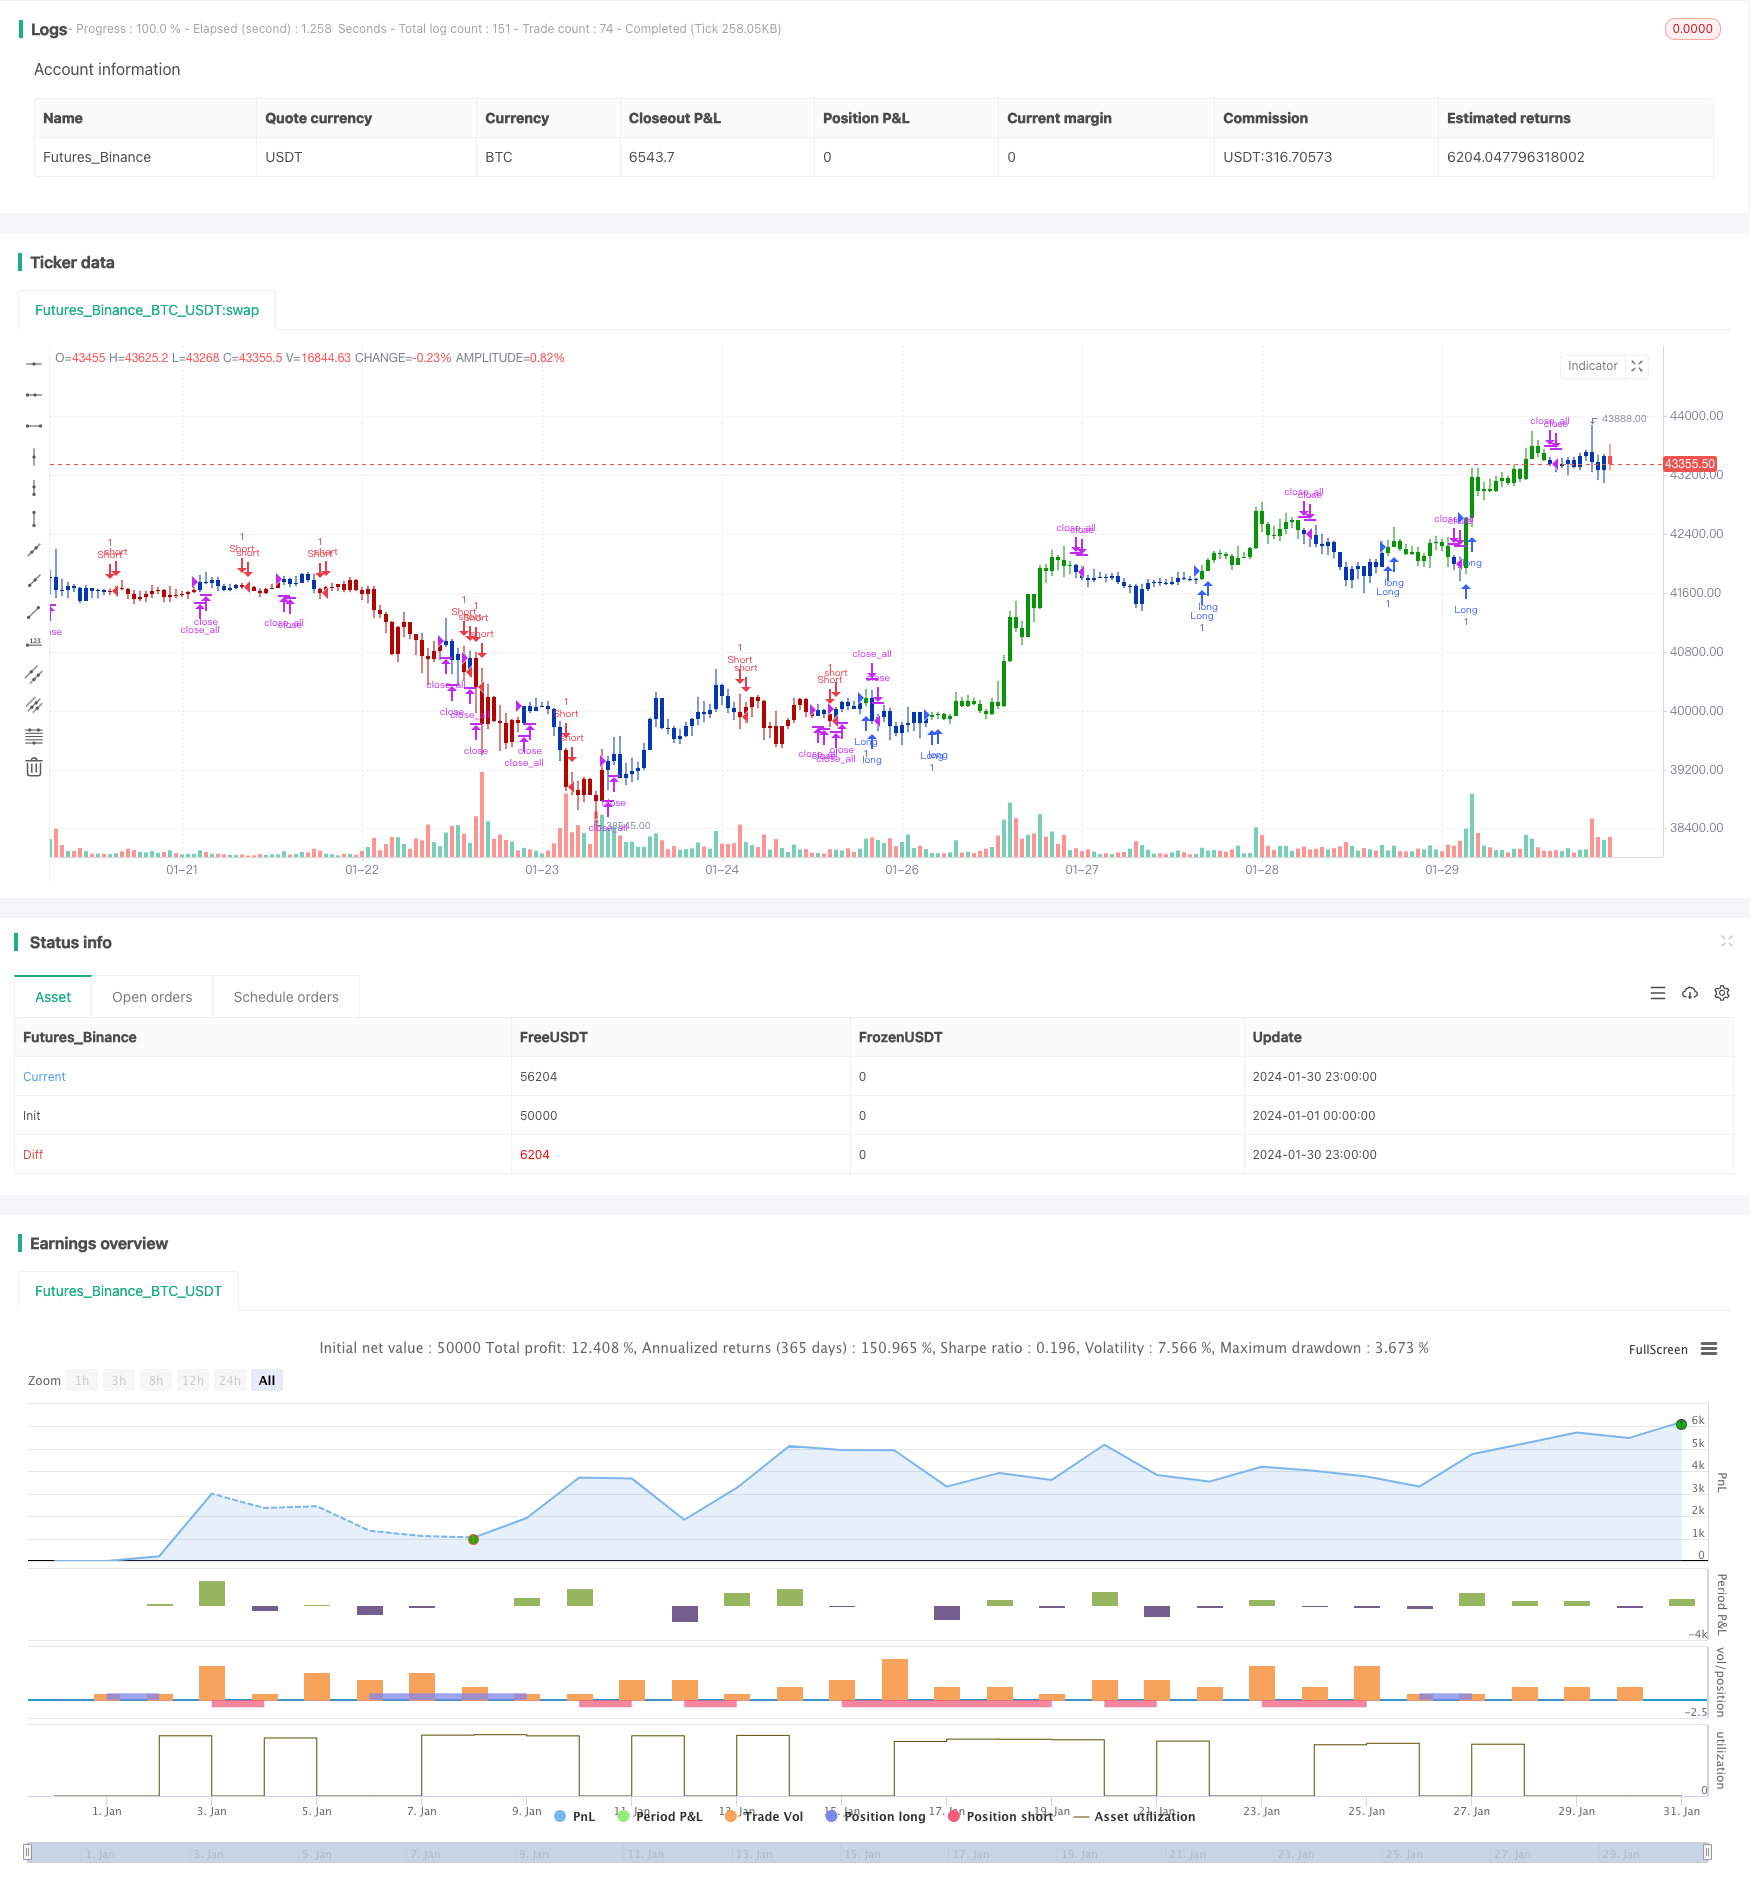
/*backtest
start: 2024-01-01 00:00:00
end: 2024-01-31 00:00:00
period: 1h
basePeriod: 15m
exchanges: [{"eid":"Futures_Binance","currency":"BTC_USDT"}]
*/

//@version=4
////////////////////////////////////////////////////////////
//  Copyright by HPotter v1.0 28/01/2021
// This is combo strategies for get a cumulative signal.
//
// First strategy
// This System was created from the Book "How I Tripled My Money In The
// Futures Market" by Ulf Jensen, Page 183. This is reverse type of strategies.
// The strategy buys at market, if close price is higher than the previous close
// during 2 days and the meaning of 9-days Stochastic Slow Oscillator is lower than 50.
// The strategy sells at market, if close price is lower than the previous close price
// during 2 days and the meaning of 9-days Stochastic Fast Oscillator is higher than 50.
//
// Second strategy
// MACD – Moving Average Convergence Divergence. The MACD is calculated
// by subtracting a 26-day moving average of a security's price from a
// 12-day moving average of its price. The result is an indicator that
// oscillates above and below zero. When the MACD is above zero, it means
// the 12-day moving average is higher than the 26-day moving average.
// This is bullish as it shows that current expectations (i.e., the 12-day
// moving average) are more bullish than previous expectations (i.e., the
// 26-day average). This implies a bullish, or upward, shift in the supply/demand
// lines. When the MACD falls below zero, it means that the 12-day moving average
// is less than the 26-day moving average, implying a bearish shift in the
// supply/demand lines.
// A 9-day moving average of the MACD (not of the security's price) is usually
// plotted on top of the MACD indicator. This line is referred to as the "signal"
// line. The signal line anticipates the convergence of the two moving averages
// (i.e., the movement of the MACD toward the zero line).
// Let's consider the rational behind this technique. The MACD is the difference
// between two moving averages of price. When the shorter-term moving average rises
// above the longer-term moving average (i.e., the MACD rises above zero), it means
// that investor expectations are becoming more bullish (i.e., there has been an
// upward shift in the supply/demand lines). By plotting a 9-day moving average of
// the MACD, we can see the changing of expectations (i.e., the shifting of the
// supply/demand lines) as they occur.
//
// WARNING:
// - For purpose educate only
// - This script to change bars colors.
////////////////////////////////////////////////////////////
Reversal123(Length, KSmoothing, DLength, Level) =>
    vFast = sma(stoch(close, high, low, Length), KSmoothing)
    vSlow = sma(vFast, DLength)
    pos = 0.0
    pos := iff(close[2] < close[1] and close > close[1] and vFast < vSlow and vFast > Level, 1,
	         iff(close[2] > close[1] and close < close[1] and vFast > vSlow and vFast < Level, -1, nz(pos[1], 0)))
	pos

MACD(fastLength,slowLength,signalLength) =>
    pos = 0.0
    fastMA = ema(close, fastLength)
    slowMA = ema(close, slowLength)
    macd = fastMA - slowMA
    signal = sma(macd, signalLength)
    pos:= iff(signal < macd , 1,
	       iff(signal > macd, -1, nz(pos[1], 0)))
    pos

strategy(title="Combo Backtest 123 Reversal & MACD Crossover", shorttitle="Combo", overlay = true)
line1 = input(true, "---- 123 Reversal ----")
Length = input(14, minval=1)
KSmoothing = input(1, minval=1)
DLength = input(3, minval=1)
Level = input(50, minval=1)
//-------------------------
fastLength = input(8, minval=1)
slowLength = input(16,minval=1)
signalLength=input(11,minval=1)
xSeria = input(title="Source", type=input.source, defval=close)
reverse = input(false, title="Trade reverse")
posReversal123 = Reversal123(Length, KSmoothing, DLength, Level)
posMACD = MACD(fastLength,slowLength, signalLength)
pos = iff(posReversal123 == 1 and posMACD == 1 , 1,
	   iff(posReversal123 == -1 and posMACD == -1, -1, 0))
possig = iff(reverse and pos == 1, -1,
          iff(reverse and pos == -1 , 1, pos))
if (possig == 1)
    strategy.entry("Long", strategy.long)
if (possig == -1)
    strategy.entry("Short", strategy.short)
if (possig == 0)
    strategy.close_all()
barcolor(possig == -1 ? #b50404: possig == 1 ? #079605 : #0536b3 )