Стратегия торговли на основе импульса
Обзор
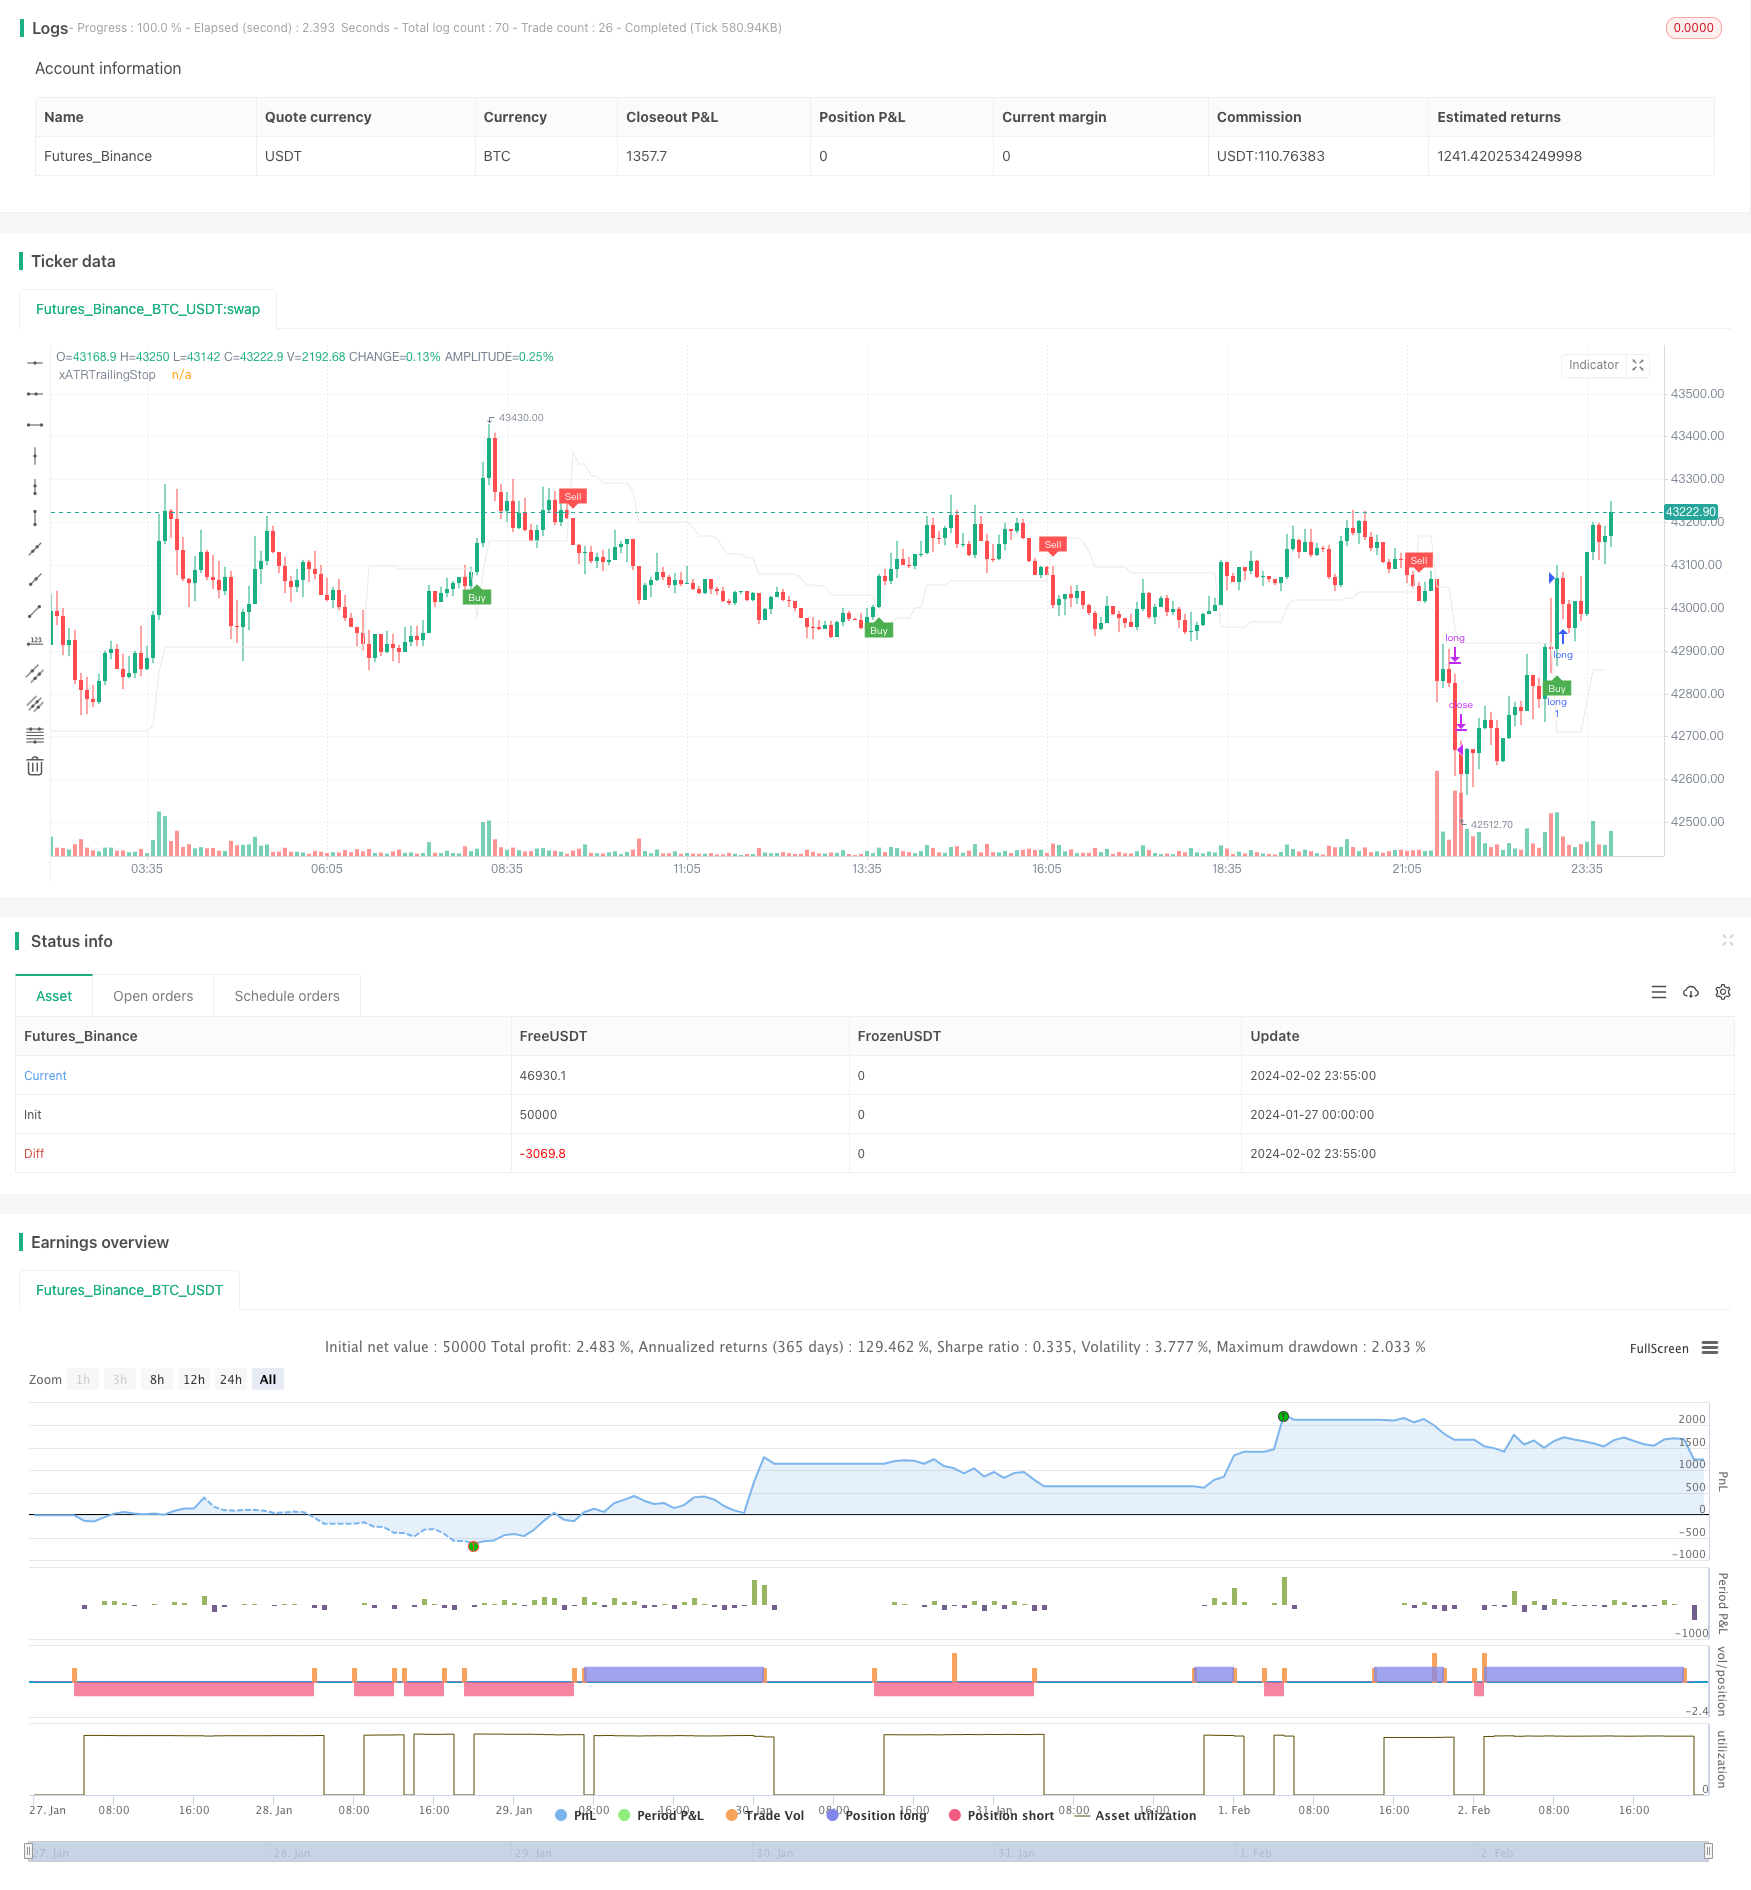
Эта стратегия является стратегией прорыва, основанной на динамических показателях. Она использует несколько показателей, таких как средняя линия, ATR, RSI, чтобы определить тенденции и волатильность рынка, в сочетании с строгими параметрами остановки и убытка для торговли.
Стратегический принцип
Эта стратегия основана на следующих моментах:
Используйте среднюю линию EMA, чтобы определить направление ценового тренда. Средняя линия вверху является позитивным сигналом, а внизу - падением.
Показатель ATR определяет рыночную волатильность. ATR умножается на коэффициент в качестве предела для остановки убытков. Это позволяет эффективно контролировать убытки.
Показатель RSI определяет перекуп и перепродажу. Прорывные сделки, построенные на ATR Stop Loss Price и Average Line Judgment, должны быть вызваны в том случае, если RSI не перекупает и не перепродает. Это позволяет избежать ложных прорывов.
Используйте предыдущие высокие или низкие точки в качестве основы для остановки. Отслеживание цены остановки может привести к увеличению прибыли.
Строгие правила стоп-стоп. Стоп-стоп ATR в сочетании с показателем волатильности позволяет контролировать риск, а стоп-стоп - блокировать прибыль.
Входящий сигнал - это цена, которая пробивает среднюю линию плюс ATR. Если это сигнал порыва, то цена должна преодолеть высокую точку; если это сигнал падения, то цена должна преодолеть низкую точку.
Анализ преимуществ
Эта стратегия имеет следующие преимущества:
Многопоказательная оценка позволяет избежать ложных прорывов и повысить точность сигнала
Настройка ATR Stop Loss Range позволяет контролировать убытки до разумного уровня
Динамический отслеживающий стоп-ап максимизирует прибыль
Строгие правила стоп-стоп помогают контролировать риски
Большое пространство для оптимизации показателей и параметров, которые могут быть адаптированы к различным рынкам
Анализ рисков
Также существуют следующие риски:
Возможность получения прибыли связана с рыночной волатильностью. Когда рыночная тенденция неизвестна или цикл длинный, пространство для получения прибыли ограничено.
Возможен повторный прорыв после колебания стоп-цены. Это может привести к невозможности своевременного создания позиции для отслеживания тенденции. Стоп-цены могут быть соответствующим образом ослаблены.
chasing。
Направление оптимизации
Эта стратегия может быть оптимизирована в следующих аспектах:
Среднелинейные параметры, ATR параметры и т. д. корректируются в зависимости от разных сортов и периодов.
Можно использовать другие показатели, такие как MACD, KDJ и т.д.
Стоп-коэффициент может быть скорректирован в реальном времени в зависимости от значения ATR. Стоп-коэффициент может быть адаптирован к рыночным колебаниям.
Сочетание нескольких временных циклов. Объединение различных циклических показателей может улучшить качество сигнала.
Используйте технологии машинного обучения для тестирования и оптимизации показателей и параметров, чтобы оптимизировать параметры стратегии.
Подвести итог
Стратегия в целом является стратегией для взлома торговли с использованием показателей для суждения и строгого остановки убытков. Она эффективно использует преимущества таких показателей, как средняя линия, ATR и RSI, чтобы эффективно судить о направлении рыночной тенденции. В сочетании с строгими параметрами остановки убытков, она может контролировать риски, одновременно с тем, чтобы удерживать тенденцию к прибыли. Оптимизированная с помощью параметров и правил, эта стратегия может стать количественной стратегией торговли, которая стоит использовать в долгосрочной перспективе.
/*backtest
start: 2024-01-27 00:00:00
end: 2024-02-03 00:00:00
period: 5m
basePeriod: 1m
exchanges: [{"eid":"Futures_Binance","currency":"BTC_USDT"}]
*/

//@version=4
strategy(title="UT Bot Strategy", overlay = true)
//CREDITS to HPotter for the orginal code. The guy trying to sell this as his own is a scammer lol.
// Inputs
emaLengh = input(2, title = "emaLengh")
a = input(3.0,     title = "Key Vaule. 'This changes the sensitivity'")
c = input(10,    title = "ATR Period")
h = input(false, title = "Signals from Heikin Ashi Candles")
emaLengh2 = input(9, title = "emaLengh show")


rate = input(0.00025,    title = "波动率min")
rateMax = input(0.00045,    title = "波动率max")
adx_length =   input(20,    title = "adx_length")
adx_min =   input(14,    title = "adx_min")

sma_length =   input(11,    title = "sma_length")
rsi_len = input(9, title = "rsi_len")

src = h ? security(heikinashi(syminfo.tickerid), timeframe.period, close, lookahead = false) : close

// boll 通道----------------------------------------------------
length = input(20, minval=1)
mult = input(2.0, minval=0.001, maxval=50, title="StdDev")
basis = sma(src, length)
dev = mult * stdev(src, length)
upper = basis + dev
lower = basis - dev
bbr = (src - lower)/(upper - lower)
// plot(upper, color = color.rgb(46, 59, 240), title="upper")
// plot(lower, color = color.rgb(46, 59, 240), title="lower")


// plot(bbr, "Bollinger Bands %B", color=#26A69A)
// band1 = hline(1, "Overbought", color=#787B86, linestyle=hline.style_dashed)
// hline(0.5, "Middle Band", color=color.new(#787B86, 50))
// band0 = hline(0, "Oversold", color=#787B86, linestyle=hline.style_dashed)
// fill(band1, band0, color=color.rgb(38, 166, 154, 90), title="Background")
// boll 通道----------------------------------------------------

// 线性回归 --------------------------------------------------------------
zlsma_length = input(title="zlsma-Length", type=input.integer, defval=50)
zlsma_offset = input(title="zlsma-Offset", type=input.integer, defval=0)
lsma = linreg(src, zlsma_length, zlsma_offset)
lsma2 = linreg(lsma, zlsma_length, zlsma_offset)
eq= lsma-lsma2
zlsma = lsma+eq
// plot(zlsma , color = color.rgb(243, 243, 14), title="zlsma",linewidth=3)
// 线性回归 --------------------------------------------------------------


// --------------------------------
rsi = rsi(src, 6)

// xHH = sma(high, sma_length)
// xLL = sma(low, sma_length)
// movevalue = (xHH - xLL) / 2
// xHHM = xHH + movevalue
// xLLM = xLL - movevalue

// plot(xHHM, color = color.rgb(208, 120, 219), title="xHHM")
// plot(xLLM, color = color.rgb(208, 120, 219), title="xLLM")


xATR  = atr(c)
nLoss = a * xATR


xATRTrailingStop = 0.0
xATRTrailingStop := iff(src > nz(xATRTrailingStop[1], 0) and src[1] > nz(xATRTrailingStop[1], 0), max(nz(xATRTrailingStop[1]), src - nLoss),
   iff(src < nz(xATRTrailingStop[1], 0) and src[1] < nz(xATRTrailingStop[1], 0), min(nz(xATRTrailingStop[1]), src + nLoss),
   iff(src > nz(xATRTrailingStop[1], 0), src - nLoss, src + nLoss)))


pos = 0
pos :=	iff(src[1] < nz(xATRTrailingStop[1], 0) and src > nz(xATRTrailingStop[1], 0), 1,
   iff(src[1] > nz(xATRTrailingStop[1], 0) and src < nz(xATRTrailingStop[1], 0), -1, nz(pos[1], 0)))

xcolor = pos == -1 ? color.red: pos == 1 ? color.green : color.blue

ema   = ema(src,emaLengh)
// sma   = sma(src,emaLengh)
emaFast   = ema(src,100)
emaSlow   = ema(src,576)
emaShow   = ema(src, emaLengh2)
// sma       =  sma(src, 8)

// [superTrend, dir] = supertrend(3, 200)
// 判断连续涨

[diplus, diminus, adx] = dmi(adx_length, adx_length)


above = crossover(ema, xATRTrailingStop)
below = crossover(xATRTrailingStop, ema)
// above = ema == xATRTrailingStop
// below = xATRTrailingStop== ema

// smaabove = crossover(src, sma)
// smabelow = crossover(sma, src)
// smaabove = src > sma
// smabelow = sma > src
close_rate (n)=>
    abs(close[n]-open[n])/min(close[n],open[n])

rate_val = close_rate(0)
rate_val1 = close_rate(1)

buy  = src > xATRTrailingStop and above  and src > zlsma  and adx >adx_min
// and  src>emaShow
// and rate_val < rate_val1*2 and rate_val >=rate_val1
// and rate_val1<rateMax
// and close[1]>open[1]
sell = src < xATRTrailingStop and below  and src < zlsma and adx >adx_min
// and  src<emaShow
// and rate_val < rate_val1*2  and rate_val >=rate_val1
//  and rate_val1<rateMax
// and open[1]>close[1]  and rate_val1 > rate

// buy  = src > xATRTrailingStop
// sell = src < xATRTrailingStop
// plot(rate_val1 , color = color.red, title="rate_val1")


barbuy  = src > xATRTrailingStop
barsell = src < xATRTrailingStop

atrRsi = rsi(xATRTrailingStop,rsi_len)

// plot(emaFast , color = color.rgb(243, 206, 127), title="emaFast")
// plot(ema , color = color.rgb(47, 227, 27), title="ut-ema")


// plot(emaShow , color = color.rgb(47, 227, 27), title="ema9")

plot(xATRTrailingStop, color = color.rgb(233, 233, 232), title="xATRTrailingStop")

plotshape(buy,  title = "Buy",  text = 'Buy',  style = shape.labelup,   location = location.belowbar, color= color.green, textcolor = color.white, size = size.tiny)
plotshape(sell, title = "Sell", text = 'Sell', style = shape.labeldown, location = location.abovebar, color= color.red,   textcolor = color.white, size = size.tiny)


// plotshape(buy,  title = "Sell",  text = 'Sell',  style = shape.labelup,   location = location.belowbar, color= color.green, textcolor = color.white, transp = 0, size = size.tiny)
// plotshape(sell, title = "buy", text = 'buy', style = shape.labeldown, location = location.abovebar, color= color.red,   textcolor = color.white, transp = 0, size = size.tiny)

// barcolor(barbuy  ? color.green : na)
// barcolor(barsell ? color.red   : na)

// strategy.entry("short",   false, when = buy)
// strategy.entry("long ", true, when = sell)


strategy.entry("long",   true, when = buy and strategy.position_size == 0)
strategy.entry("short", false, when = sell and strategy.position_size == 0)


//动态止盈start------------------------------------------------------------------------------------------
profit = input( 0.015,     title = "最小收益率")
close_profit_rate = input( 10,     title = "平仓收益回撤比")
loss = input(0.004,    title = "回撤率")

// 收益回撤比例
profit_price_scale =profit/close_profit_rate

var float profit_price = 0


// 计算小收益价格

get_profit_price(long) =>
    float res = 0
    if long == true
        res := strategy.position_avg_price * (1+profit)
    if long == false
        res := strategy.position_avg_price * (1-profit)
    res

// 止盈平仓条件
close_profit_position(long)=>
    bool result=false
    if long == true and profit_price>0 and profit_price*(1-profit_price_scale) >=close and  get_profit_price(true) <= close
        result:=true
    if long == false and profit_price>0 and profit_price*(1+profit_price_scale) <=close and  get_profit_price(false) >= close
        result:=true
    result

// 更新动态止盈价格
update_profit_price(price)=>
    float res = price
   // 无仓位时 动态止盈价格为0
    if strategy.position_size == 0
        res := 0
   // long - 价格大于最小收益时保存
    if strategy.position_size > 0 and get_profit_price(true) <= close and (res==0 or res < close)
        res := close
   // short - 价格小于最小收益时保存
    if strategy.position_size < 0 and get_profit_price(true) >= close and (res==0 or res > close)
        res := close
    res

///////


profit_price := update_profit_price(profit_price)
long_close_profit_position = close_profit_position(true)
short_close_profit_position = close_profit_position(false)

// plot(profit_price, color = color.green, title="profit_price")
//动态止盈end------------------------------------------------------------------------------------------


strategy.close("long",comment="long-止盈",when = strategy.position_size > 0 and long_close_profit_position)

strategy.close("long",comment="long-止损",when = strategy.position_size >0 and strategy.position_avg_price * (1-loss) >= close)

strategy.close("short",comment="short-止盈",when = strategy.position_size <0 and short_close_profit_position)

strategy.close("short",comment="short-止损",when = strategy.position_size <0 and strategy.position_avg_price * (1+loss) <= close)