Стратегия Ripple, основанная на интервале бэктестинга индикатора Coral Trend
Обзор
Эта стратегия использует индикатор Coral Trend от LazyBear для определения направления ценовой тенденции и определяет потенциальные точки входа, идентифицируя обратный курс индикатора Coral Trend. Для фильтрации ложных прорывов эта стратегия использует индикатор ADX или группу индикаторов Absolute Strength Histogram и HawkEye Volume в качестве совместного подтверждающего индикатора для более надежного входа.
Механизм Exit использует максимальную/минимальную цену последней N-корневой K-линии, умноженную на конфигурируемый риск-возвратный коэффициент, для установки стоп-лосса и стоп-стопа.
Стратегический принцип
Основываясь на индикаторе Coral Trend, чтобы определить направление тенденции, когда цвет индикатора остается неизменным, в цене появляется небольшой обратный обратный обратный обратный обратный обратный обратный обратный обратный обратный обратный обратный обратный обратный обратный обратный обратный обратный обратный обратный обратный обратный обратный обратный обратный обратный обратный обратный обратный обратный обратный обратный обратный обратный обратный обратный обратный обратный обратный обратный обратный обратный обратный обратный обратный обратный обратный обратный обратный обратный обратный обратный обратный обратный обратный обратный обратный обратный обратный обратный обратный обратный обратный обратный обратный обратный обратный обратный обратный обратный обратный обратный обратный обратный обратный обратный обратный обратный обратный обратный обратный обратный обратный обратный обратный обратный обратный обратный обратный обратный обратный обратный обратный обратный обратный обратный обратный обратный обратный обратный обратный обратный обратный обратный обратный обратный обратный обрат
Ключевые требования к участию:
Коралловый тренд (CORAL TREND) - индикатор, направление которого совпадает с направлением торговли (многоголовый = зеленый, пустой = красный)
С тех пор, как цена полностью пробилась через индикатор Coral Trend ((все высоты последнего бара превышают линию Coral Trend), было по крайней мере 1 низкое положение линии K, которое полностью находится над индикатором Coral Trend ((многоголовное) или высокое положение полностью ниже индикатора Coral Trend ((пустое)
Происходит небольшой обратный обратный обратный обратный обратный обратный обратный обратный обратный обратный обратный обратный обратный обратный обратный обратный обратный обратный обратный обратный обратный
После небольшого отклонения конечная цена вернулась к основной тенденции, указанной в Coral Trend
Вышеперечисленные являются основными условиями. В то же время, стратегия использует показатели ADX или показатели Absolute Strength Histogram и HawkEye Volume в качестве условий подтверждения вступления.
Индекс ADX требует, чтобы его значение было > 20 и в последнее время повышалось на 1 K-линию.
Гистограмма абсолютной силы требует, чтобы ее цвет соответствовал направлению сделки: многоголовый = синий, пустой = красный.
Механизм Exit - это использование наивысшей или наименьшей цены на ближайшей N-корневой K-линии, умноженной на риск-возвращение, для установки стоп-лосса и стоп-стопа. Значения N и риск-возвращение могут быть настроены через параметры.
Анализ преимуществ
Наибольшее преимущество этой стратегии заключается в том, что, используя индикатор Coral Trend, можно определить направление основной тенденции и, идентифицировав ее обратный ход, обнаружить возможности для входа, чтобы избежать волнового течения в не трендовых рынках. В то же время, использование индикатора Confirm позволяет отфильтровать множество ложных прорывов, что повышает успех входа.
Кроме того, эта стратегия обеспечивает полный механизм контроля риска, включая установку стоп-лосс и процентный контроль риска, так что даже убытки от отдельных сделок не оказывают значительного влияния на общий капитал.
Анализ рисков
Самый большой риск в этой стратегии заключается в том, что использование показателей для принятия решений о входе в рынок, легко создает иллюзию, что полностью полагаться на параметрическую конфигурацию можно автоматически получить прибыль. На самом деле, оптимизация параметров и конфигурация правил требуют сочетания закономерностей изменения цены в основе, интуитивного суждения об эффекте соединения показателей с ценами, чтобы установить конфигурацию, которая лучше подходит для вашего торгового стиля и разновидности.
Кроме того, нужно правильно настроить стоп-пароли и стоп-позиции. Слишком большие стоп-пароли могут привести к невозможности остановить игрока, а слишком маленькие стоп-пароли - к риску. Это необходимо настроить в зависимости от степени волатильности различных видов и индивидуальной рискованности.
Направление оптимизации
Оптимизация стратегии включает в себя:
Настройка параметров индикатора Coral Trend, чтобы он был более чувствительным к изменениям цен на различные сорта
Попробуйте различные индикаторы подтверждения или комбинации показателей, такие как KDJ, MACD и т. Д., Чтобы получить более точный сигнал входа
Настройка расчетов стоп-лосса и стоп-поста в зависимости от степени волатильности различных сортов для лучшего контроля риска
Добавление модуля управления капиталом, который позволяет регулировать размер одного ордера в зависимости от количества позиций, чтобы эффективно контролировать общие потери
Добавление модуля управления временем торговли, чтобы стратегия работала только в определенное время, избегая убытков в периоды сильной волатильности
Подвести итог
Эта стратегия сначала использует Coral Trend для определения средне-длинной тенденции цены, а затем, оценивая ее обратную сторону, в сочетании с фильтрацией сигналов Confirm на ложные прорывы, создает более надежную стратегию отслеживания тенденций. В то же время, усовершенствованная настройка управления ветром также позволяет этой стратегии работать в течение длительного времени и стабильность средств.
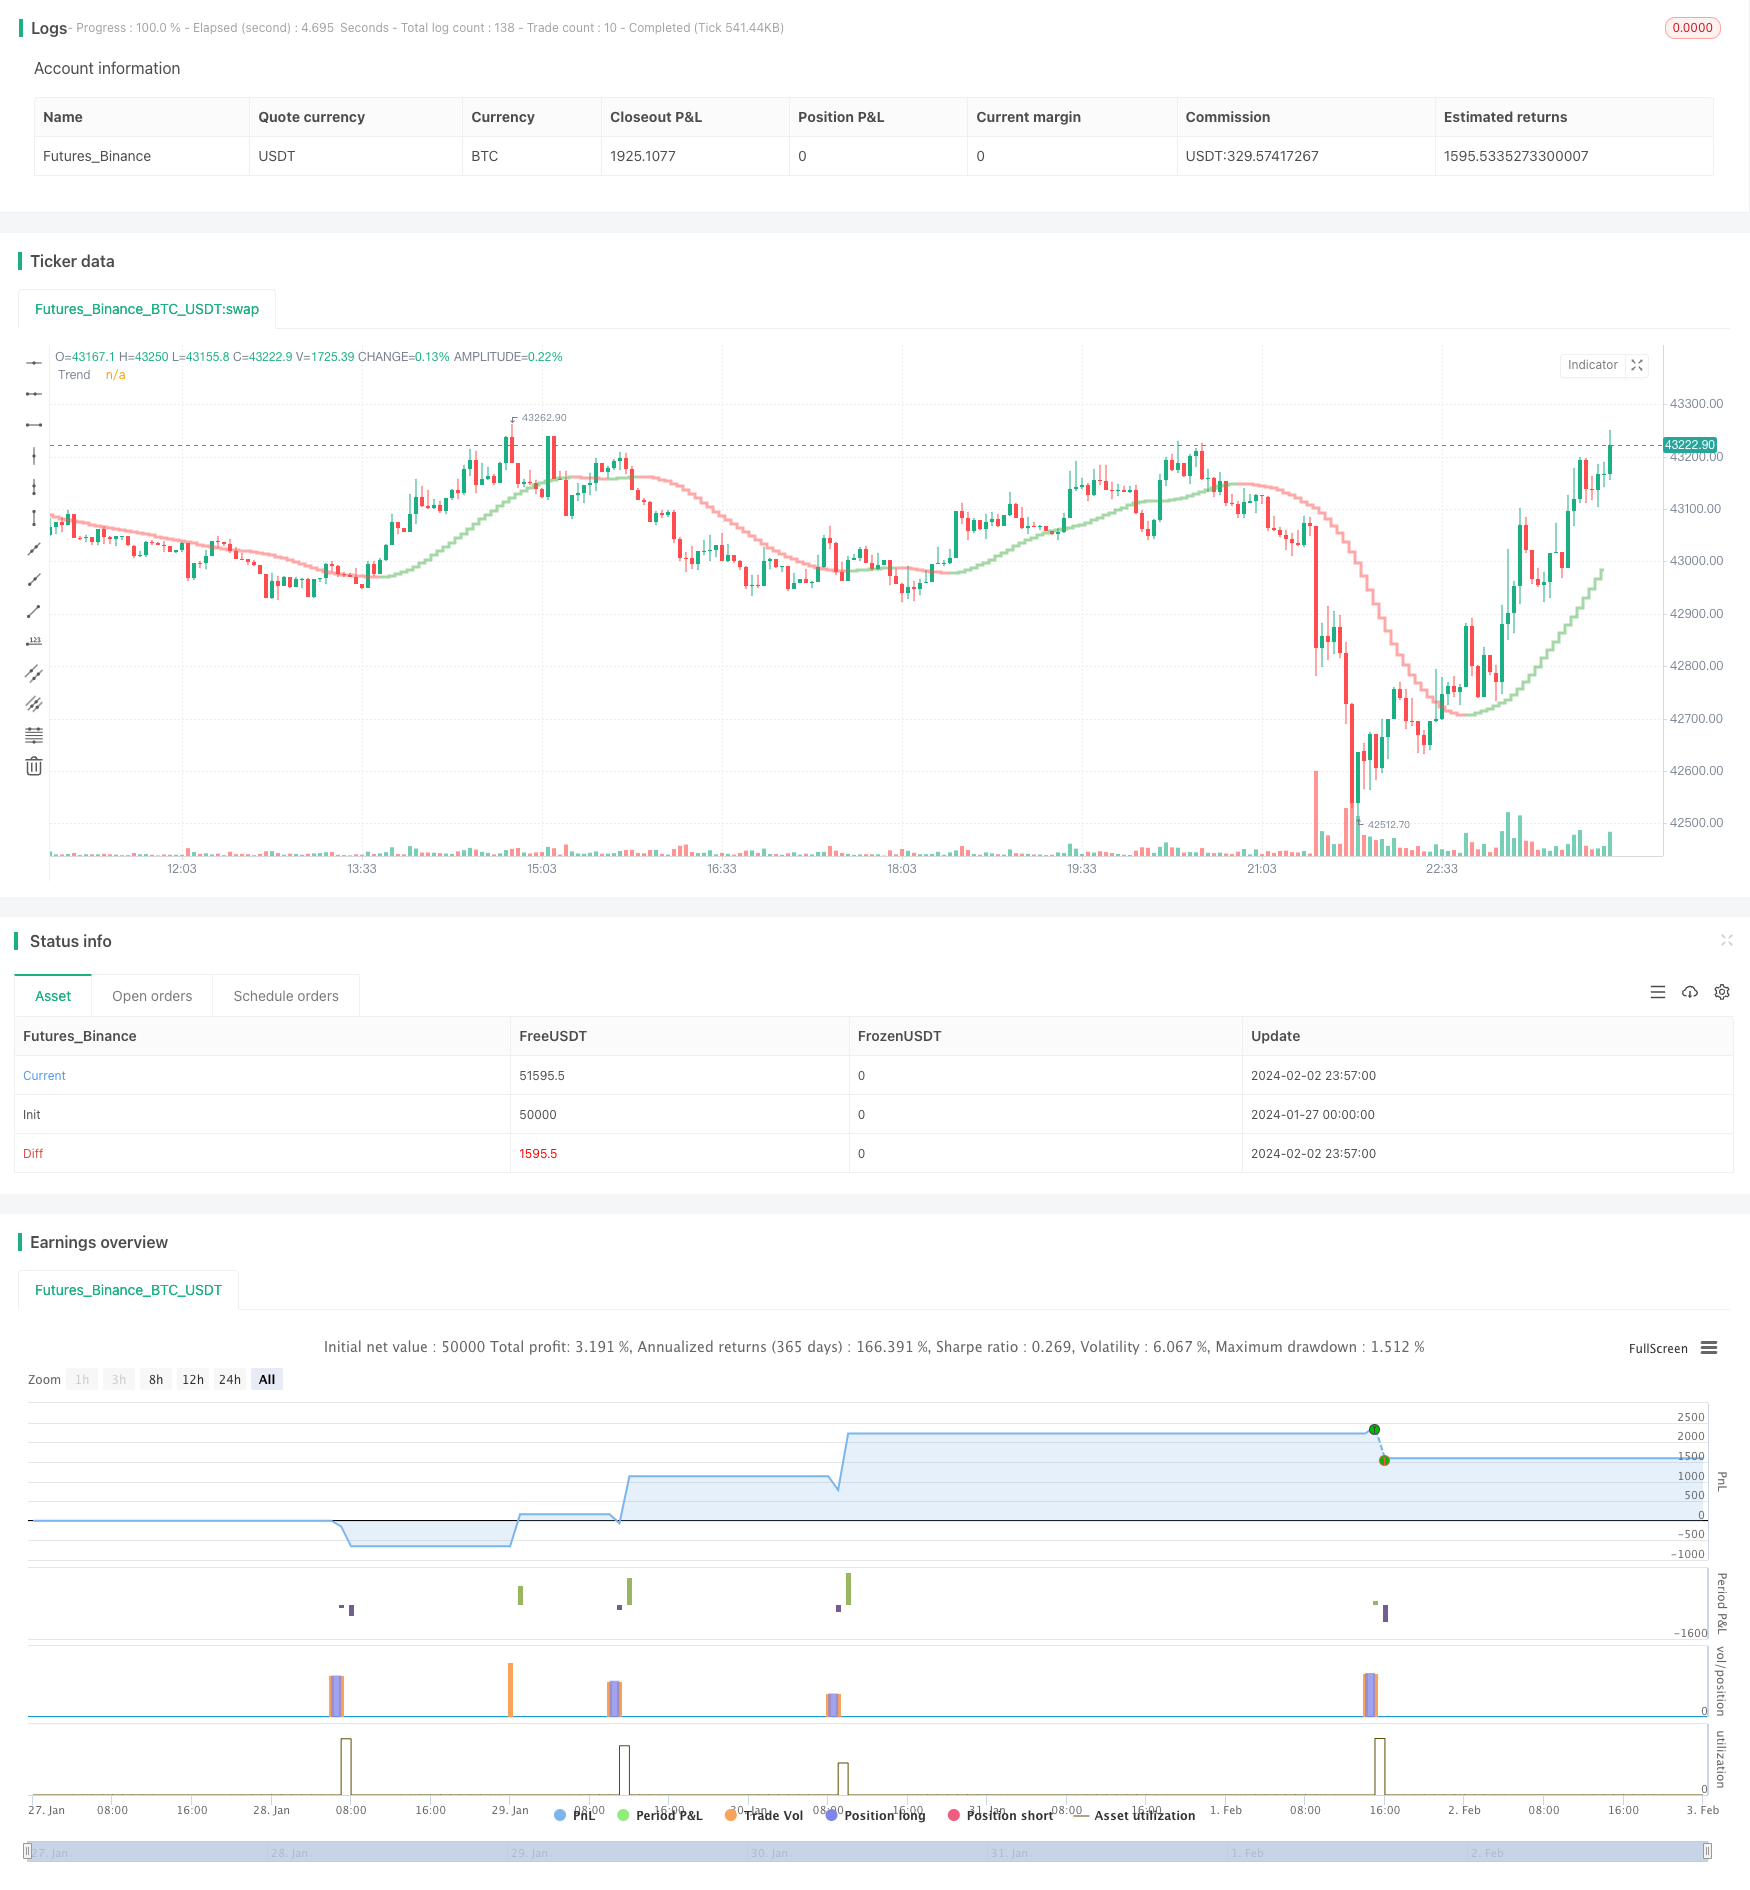
/*backtest
start: 2024-01-27 00:00:00
end: 2024-02-03 00:00:00
period: 3m
basePeriod: 1m
exchanges: [{"eid":"Futures_Binance","currency":"BTC_USDT"}]
*/

// This source code is subject to the terms of the Mozilla Public License 2.0 at https://mozilla.org/MPL/2.0/
// © kevinmck100

// @description
//
// Strategy is taken from the TradeIQ YouTube video called "I Finally Found 80% Win Rate Trading Strategy For Crypto"
// Check out the full video for further details/clarification on strategy entry/exit conditions.
//
// It incorporates the following features:
//
//      - Risk management:  Configurable X% loss per stop loss
//                          Configurable R:R ratio
//
//      - Trade entry:      Conditions outlines below
//
//      - Trade exit:       Conditions outlined below
//
//      - Backtesting:      Configurable backtesting range by date
//
//      - Trade drawings:   TP/SL boxes drawn for all trades (can be turned on and off)
//                          Trade exit information labels (can be turned on and off)
//                          NOTE: Trade drawings will only be applicable when using overlay strategies
//
//      - Debugging:        Includes section with useful debugging techniques
//
// Strategy conditions:
//
//      - Trade entry:      LONG:   C1: Coral Trend is bullish
//                                  C2: At least 1 candle where low is above Coral Trend since last cross above Coral Trend
//                                  C3: Pullback happens and price closes below Coral Trend
//                                  C4: Coral Trend colour remains bullish for duration of pullback
//                                  C5: After valid pullback, price then closes above Coral Trend
//                                  C6: Optional confirmation indicators (choose either C6.1 or C6.2 or NONE):
//                                      C6.1: ADX and DI (Single indicator)
//                                          C6.1.1: Green line is above red line
//                                          C6.1.2: Blue line > 20
//                                          C6.1.3: Blue trending up over last 1 candle
//                                      C6.2: Absolute Strengeh Histogram + HawkEye Volume Indicator (Two indicators combined)
//                                          C6.2.1: Absolute Strengeh Histogram colour is blue
//                                          C6.2.2: HawkEye Volume Indicator colour is green
//                          SHORT:  C1: Coral Trend is bearish
//                                  C2: At least 1 candle where high is below Coral Trend since last cross below Coral Trend
//                                  C3: Pullback happens and price closes above Coral Trend
//                                  C4: Coral Trend colour remains bearish for duration of pullback
//                                  C5: After valid pullback, price then closes below Coral Trend
//                                  C6: Optional confirmation indicators (choose either C6.1 or C6.2 or NONE):
//                                      C6.1: ADX and DI (Single indicator)
//                                          C6.1.1: Red line is above green line
//                                          C6.1.2: Blue line > 20
//                                          C6.1.3: Blue trending up over last 1 candle
//                                      C6.2: Absolute Strengeh Histogram + HawkEye Volume Indicator (Two indicators combined)
//                                          C6.2.1: Absolute Strengeh Histogram colour is red
//                                          C6.2.2: HawkEye Volume Indicator colour is red
//                          NOTE: All the optional confirmation indicators cannot be overlayed with Coral Trend so feel free to add each separately to the chart for visual purposes
//
//
//      - Trade exit:       Stop Loss:      Calculated by recent swing low over previous X candles (configurable with "Local High/Low Lookback")
//                          Take Profit:    Calculated from R:R multiplier * Stop Loss size
//
// @credits
//
// Coral Trend Indicator [LazyBear]     by @LazyBear
// Absolute Strength Histogram | jh     by @jiehonglim
// Indicator: HawkEye Volume Indicator  by @LazyBear
// ADX and DI                           by @BeikabuOyaji

//@version=5
INITIAL_CAPITAL = 1000
DEFAULT_COMMISSION = 0.02
MAX_DRAWINGS = 500
IS_OVERLAY = true

strategy("Coral Trend Pullback Strategy (TradeIQ)", "Coral Trend Pullback", overlay = IS_OVERLAY, initial_capital = INITIAL_CAPITAL, currency = currency.NONE, max_labels_count = MAX_DRAWINGS, max_boxes_count = MAX_DRAWINGS, max_lines_count = MAX_DRAWINGS, default_qty_type = strategy.cash, commission_type = strategy.commission.percent, commission_value = DEFAULT_COMMISSION)

// =============================================================================
// INPUTS
// =============================================================================

// ---------------
// Risk Management
// ---------------
riskReward          = input.float(1.5,  "Risk : Reward        1 :",     group = "Strategy: Risk Management",    inline = "RM1", minval = 0, step = 0.1, tooltip = "Previous high or low (long/short dependant) is used to determine TP level. 'Risk : Reward' ratio is then used to calculate SL based of previous high/low level.\n\nIn short, the higher the R:R ratio, the smaller the SL since TP target is fixed by previous high/low price data.")
accountRiskPercent  = input.float(1,    "Portfolio Risk %        ",     group = "Strategy: Risk Management",    inline = "RM2", minval = 0, step = 0.1, tooltip = "Percentage of portfolio you lose if trade hits SL.\n\nYou then stand to gain\n  Portfolio Risk % * Risk : Reward\nif trade hits TP.")

localHlLookback     = input.int (5,     "Local High/Low Lookback     ", group = "Strategy: Stop Loss Settings", inline = "SL1", minval = 1,             tooltip = "This strategy calculates the Stop Loss value from the recent local high/low. This lookback period determines the number of candles to include for the local high/low.")

// ----------
// Date Range
// ----------
startYear           = input.int (2010,  "Start Date  ",                 group = "Strategy: Date Range",         inline = "DR1", minval    = 1900, maxval = 2100)
startMonth          = input.int (1,     "",                             group = "Strategy: Date Range",         inline = "DR1", options   = [1, 2, 3, 4, 5, 6, 7, 8, 9, 10, 11, 12])
startDate           = input.int (1,     "",                             group = "Strategy: Date Range",         inline = "DR1", options   = [1, 2, 3, 4, 5, 6, 7, 8, 9, 10, 11, 12, 13, 14, 15, 16, 17, 18, 19, 20, 21, 22, 23, 24, 25, 26, 27, 28, 29, 30, 31])
endYear             = input.int (2100,  "End Date    ",                 group = "Strategy: Date Range",         inline = "DR2", minval    = 1900, maxval = 2100)
endMonth            = input.int (1,     "",                             group = "Strategy: Date Range",         inline = "DR2", options   = [1, 2, 3, 4, 5, 6, 7, 8, 9, 10, 11, 12])
endDate             = input.int (1,     "",                             group = "Strategy: Date Range",         inline = "DR2", options   = [1, 2, 3, 4, 5, 6, 7, 8, 9, 10, 11, 12, 13, 14, 15, 16, 17, 18, 19, 20, 21, 22, 23, 24, 25, 26, 27, 28, 29, 30, 31])

// ----------------
// Drawing Settings
// ----------------
showTpSlBoxes       = input.bool(true,  "Show TP / SL Boxes",           group = "Strategy: Drawings",           inline = "D1",  tooltip = "Show or hide TP and SL position boxes.\n\nNote: TradingView limits the maximum number of boxes that can be displayed to 500 so they may not appear for all price data under test.")
showLabels          = input.bool(false, "Show Trade Exit Labels",       group = "Strategy: Drawings",           inline = "D2",  tooltip = "Useful labels to identify Profit/Loss and cumulative portfolio capital after each trade closes.\n\nAlso note that TradingView limits the max number of 'boxes' that can be displayed on a chart (max 500). This means when you lookback far enough on the chart you will not see the TP/SL boxes. However you can check this option to identify where trades exited.")

// ------------------
// Indicator Settings
// ------------------

// Coral Trend
ctSm                = input.int  (25,       "Smoothing Period       ",              group = "Leading Indicator: Coral Trand Settings",                      inline = "CT1")
ctCd                = input.float(0.4,      "Constant D          ",                 group = "Leading Indicator: Coral Trand Settings",                      inline = "CT2", step = 0.1)

// Confirmation indicator inputs
confirmationInd     = input.string("ADX and DI", "Entry Confirmation Method    ",   group = "Confirmation Indicator: Indicator Selection",                  inline = "IS1", options=["None", "ADX and DI", "Absolute Strength Histogram + HawkEye Volume"], tooltip = "Select one of the possible confirmation indicator(s) which can be used to confirm entry signals from the main Coral Trend indicator conditions. See strategy conditions to understand the logic behind each confirmation indicator")
// ADX and DI
adxLen              = input.int(14, "ADX Length           ",                        group = "Confirmation Indicator: ADX and DI Settings",                  inline = "AD1")
midLine             = input.int(20, "Mid Line            ",                         group = "Confirmation Indicator: ADX and DI Settings",                  inline = "AD2", tooltip = "Mid line on standard ADX and DI indicator. In this strategy the DI must be above this line for entry confirmation.")
// Absolute Strength Histogram
ashLength           = input.int(9, "Period of Evaluation       ",                   group = "Confirmation Indicator: Absolute Strength Histogram Settings", inline = "ASH1")
ashSmooth           = input.int(6, "Period of Smoothing      ",                     group = "Confirmation Indicator: Absolute Strength Histogram Settings", inline = "ASH2")
ashSrc              = input.source(close, "Source             ",                    group = "Confirmation Indicator: Absolute Strength Histogram Settings", inline = "ASH3")
ashMode             = input.string("RSI", "Indicator Method       ",                group = "Confirmation Indicator: Absolute Strength Histogram Settings", inline = "ASH4", options=["RSI", "STOCHASTIC", "ADX"])
sahMaType           = input.string("SMA", "MA              ",                       group = "Confirmation Indicator: Absolute Strength Histogram Settings", inline = "ASH5", options=["ALMA", "EMA", "WMA", "SMA", "SMMA", "HMA"])
ashAlmaOffset       = input.float(0.85, "* Arnaud Legoux (ALMA) Offset",            group = "Confirmation Indicator: Absolute Strength Histogram Settings", inline = "ASH6", minval=0, step=0.01)
ashAlmaSigma        = input.int(6, "* Arnaud Legoux (ALMA) Sigma",                  group = "Confirmation Indicator: Absolute Strength Histogram Settings", inline = "ASH7", minval=0)
// HawkEye Volume Indicator
hevLength           = input.int(200, "Length             ",                         group = "Confirmation Indicator: HawkEye Volume Settings",              inline = "HV1")
hevDivisor          = input.float(1.6, "Divisor             ",                      group = "Confirmation Indicator: HawkEye Volume Settings",              inline = "HV2", step=0.1)

// =============================================================================
// INDICATORS
// =============================================================================

// -----------
// Coral Trend
// -----------
src             = close
di              = (ctSm - 1.0) / 2.0 + 1.0
c1              = 2 / (di + 1.0)
c2              = 1 - c1
c3              = 3.0 * (ctCd * ctCd + ctCd * ctCd * ctCd)
c4              = -3.0 * (2.0 * ctCd * ctCd + ctCd + ctCd * ctCd * ctCd)
c5              = 3.0 * ctCd + 1.0 + ctCd * ctCd * ctCd + 3.0 * ctCd * ctCd
var float i1    = na
var float i2    = na
var float i3    = na
var float i4    = na
var float i5    = na
var float i6    = na
i1             := c1 * src + c2 * nz(i1[1])
i2             := c1 * i1  + c2 * nz(i2[1])
i3             := c1 * i2  + c2 * nz(i3[1])
i4             := c1 * i3  + c2 * nz(i4[1])
i5             := c1 * i4  + c2 * nz(i5[1])
i6             := c1 * i5  + c2 * nz(i6[1])

bfr             = -ctCd * ctCd * ctCd * i6 + c3 * i5 + c4 * i4 + c5 * i3
bfrC            = bfr > nz(bfr[1]) ? color.new(color.green, 50) : bfr < nz(bfr[1]) ? color.new(color.red, 50) : color.new(color.blue, 50)
plot(bfr, "Trend", linewidth = 3, style = plot.style_stepline, color = bfrC)

// ----------
// ADX and DI
// ----------
TrueRange                           = math.max(math.max(high - low, math.abs(high - nz(close[1]))), math.abs(low - nz(close[1])))
DirectionalMovementPlus             = high - nz(high[1]) > nz(low[1]) - low ? math.max(high - nz(high[1]), 0) : 0
DirectionalMovementMinus            = nz(low[1]) - low > high - nz(high[1]) ? math.max(nz(low[1]) - low, 0) : 0

SmoothedTrueRange                   = 0.0
SmoothedTrueRange                  := nz(SmoothedTrueRange[1]) - nz(SmoothedTrueRange[1]) / adxLen + TrueRange

SmoothedDirectionalMovementPlus     = 0.0
SmoothedDirectionalMovementPlus    := nz(SmoothedDirectionalMovementPlus[1]) - nz(SmoothedDirectionalMovementPlus[1]) / adxLen + DirectionalMovementPlus

SmoothedDirectionalMovementMinus    = 0.0
SmoothedDirectionalMovementMinus   := nz(SmoothedDirectionalMovementMinus[1]) - nz(SmoothedDirectionalMovementMinus[1]) / adxLen + DirectionalMovementMinus

DIPlus                              = SmoothedDirectionalMovementPlus / SmoothedTrueRange * 100
DIMinus                             = SmoothedDirectionalMovementMinus / SmoothedTrueRange * 100
DX                                  = math.abs(DIPlus - DIMinus) / (DIPlus + DIMinus) * 100
ADX                                 = ta.sma(DX, adxLen)

// ---------------------------
// Absolute Strength Histogram
// ---------------------------
ashMa(ashType, ashSrc, ashLen) =>
    float result = 0
    if ashType == 'SMA'  // Simple
        result := ta.sma(ashSrc, ashLen)
        result
    if ashType == 'EMA'  // Exponential
        result := ta.ema(ashSrc, ashLen)
        result
    if ashType == 'WMA'  // Weighted
        result := ta.wma(ashSrc, ashLen)
        result
    if ashType == 'SMMA'  // Smoothed
        ashWma = ta.wma(ashSrc, ashLen)
        ashSma = ta.sma(ashSrc, ashLen)
        result := na(ashWma[1]) ? ashSma : (ashWma[1] * (ashLen - 1) + ashSrc) / ashLen
        result
    if ashType == 'HMA'  // Hull
        result := ta.wma(2 * ta.wma(ashSrc, ashLen / 2) - ta.wma(ashSrc, ashLen), math.round(math.sqrt(ashLen)))
        result
    if ashType == 'ALMA'  // Arnaud Legoux
        result := ta.alma(ashSrc, ashLen, ashAlmaOffset, ashAlmaSigma)
        result
    result

Price           = ashSrc
Price1          = ashMa('SMA', Price, 1)
Price2          = ashMa('SMA', Price[1], 1)

//RSI
Bulls0          = 0.5 * (math.abs(Price1 - Price2) + Price1 - Price2)
Bears0          = 0.5 * (math.abs(Price1 - Price2) - (Price1 - Price2))

//STOCHASTIC
Bulls1          = Price1 - ta.lowest(Price1, ashLength)
Bears1          = ta.highest(Price1, ashLength) - Price1

//ADX
Bulls2          = 0.5 * (math.abs(high - high[1]) + high - high[1])
Bears2          = 0.5 * (math.abs(low[1] - low) + low[1] - low)

Bulls           = ashMode == 'RSI' ? Bulls0 : ashMode == 'STOCHASTIC' ? Bulls1 : Bulls2
Bears           = ashMode == 'RSI' ? Bears0 : ashMode == 'STOCHASTIC' ? Bears1 : Bears2
AvgBulls        = ashMa(sahMaType, Bulls, ashLength)
AvgBears        = ashMa(sahMaType, Bears, ashLength)

SmthBulls       = ashMa(sahMaType, AvgBulls, ashSmooth)
SmthBears       = ashMa(sahMaType, AvgBears, ashSmooth)

isTrendBullish  = SmthBulls > SmthBears ? true : false

// ------------------------
// HawkEye Volume Indicator
// ------------------------
hevRange1   = high - low
hevRangeAvg = ta.sma(hevRange1, hevLength)
hevVolumeA  = ta.sma(volume, hevLength)

hevHigh1    = high[1]
hevLow1     = low[1]
hevMid1     = hl2[1]

hevU1       = hevMid1 + (hevHigh1 - hevLow1) / hevDivisor
hevD1       = hevMid1 - (hevHigh1 - hevLow1) / hevDivisor

rEnabled1   = hevRange1 > hevRangeAvg and close < hevD1 and volume > hevVolumeA
rEnabled2   = close < hevMid1
rEnabled    = rEnabled1 or rEnabled2

gEnabled1   = close > hevMid1
gEnabled2   = hevRange1 > hevRangeAvg and close > hevU1 and volume > hevVolumeA
gEnabled3   = high > hevHigh1 and hevRange1 < hevRangeAvg / 1.5 and volume < hevVolumeA
gEnabled4   = low < hevLow1 and hevRange1 < hevRangeAvg / 1.5 and volume > hevVolumeA
gEnabled    = gEnabled1 or gEnabled2 or gEnabled3 or gEnabled4

grEnabled1  = hevRange1 > hevRangeAvg and close > hevD1 and close < hevU1 and volume > hevVolumeA and volume < hevVolumeA * 1.5 and volume > volume[1]
grEnabled2  = hevRange1 < hevRangeAvg / 1.5 and volume < hevVolumeA / 1.5
grEnabled3  = close > hevD1 and close < hevU1
grEnabled   = grEnabled1 or grEnabled2 or grEnabled3

// =============================================================================
// STRATEGY LOGIC
// =============================================================================

// ---------
// FUNCTIONS
// ---------

percentAsPoints(pcnt) =>
    math.round(pcnt / 100 * close / syminfo.mintick)

calcStopLossPrice(pointsOffset, isLong) =>
    priceOffset = pointsOffset * syminfo.mintick
    if isLong
        close - priceOffset
    else
        close + priceOffset

calcProfitTrgtPrice(pointsOffset, isLong) =>
    calcStopLossPrice(-pointsOffset, isLong)


printLabel(barIndex, msg) => label.new(barIndex, close, msg)

printTpSlHitBox(left, right, slHit, tpHit, entryPrice, slPrice, tpPrice) =>
    if showTpSlBoxes
        box.new (left = left,   top = entryPrice,   right = right,  bottom = slPrice,   bgcolor = slHit ? color.new(color.red, 60)   : color.new(color.gray, 90), border_width = 0)
        box.new (left = left,   top = entryPrice,   right = right,  bottom = tpPrice,   bgcolor = tpHit ? color.new(color.green, 60) : color.new(color.gray, 90), border_width = 0)
        line.new(x1 = left,     y1 = entryPrice,    x2 = right,     y2 = entryPrice,    color = color.new(color.yellow, 20))
        line.new(x1 = left,     y1 = slPrice,       x2 = right,     y2 = slPrice,       color = color.new(color.red, 20))
        line.new(x1 = left,     y1 = tpPrice,       x2 = right,     y2 = tpPrice,       color = color.new(color.green, 20))

printTpSlNotHitBox(left, right, entryPrice, slPrice, tpPrice) =>
    if showTpSlBoxes
        box.new (left = left,   top = entryPrice,   right = right,  bottom = slPrice,   bgcolor = color.new(color.gray, 90), border_width = 0)
        box.new (left = left,   top = entryPrice,   right = right,  bottom = tpPrice,   bgcolor = color.new(color.gray, 90), border_width = 0)
        line.new(x1 = left,     y1 = entryPrice,    x2 = right,     y2 = entryPrice,    color = color.new(color.yellow, 20))
        line.new(x1 = left,     y1 = slPrice,       x2 = right,     y2 = slPrice,       color = color.new(color.red, 20))
        line.new(x1 = left,     y1 = tpPrice,       x2 = right,     y2 = tpPrice,       color = color.new(color.green, 20))

printTradeExitLabel(x, y, posSize, entryPrice, pnl) =>
    if showLabels
        labelStr = "Position Size: " + str.tostring(math.abs(posSize), "#.##") + "\nPNL: " + str.tostring(pnl, "#.##") + "\nCapital: " + str.tostring(strategy.equity, "#.##") + "\nEntry Price: " + str.tostring(entryPrice, "#.##")
        label.new(x = x, y = y, text = labelStr, color = pnl > 0 ? color.new(color.green, 60) : color.new(color.red, 60), textcolor = color.white, style = label.style_label_down)

printVerticalLine(col) => line.new(bar_index, close, bar_index, close * 1.01, extend = extend.both, color = col)

// ----------
// CONDITIONS
// ----------

inDateRange                 = true

// Condition 1: Coral Trend color matches trend direction (long=green, short=red)
isCoralBullish              = bfr > nz(bfr[1])
isCoralBearish              = bfr < nz(bfr[1])

// Condition 2: At least 1 candle completely above/below (long/short) Coral Trend since last cross above/below (long/short) Coral Trend (could potentially try also with only close above)
sincePrePullbackBullBreakout= ta.barssince(ta.crossover(close, bfr))
sincePrePullbackBearBreakout= ta.barssince(ta.crossunder(close, bfr))
prePullbackBullBreakout     = ta.barssince(low > bfr and high > bfr) < sincePrePullbackBullBreakout[1]
prePullbackBearBreakout     = ta.barssince(low < bfr and high < bfr) < sincePrePullbackBearBreakout[1]

// Condition 3: Pullback closes below/above (long/short) Coral Trend
barssinceBullPullbackStart  = ta.barssince(ta.crossunder(close, bfr))
barssinceBearPullbackStart  = ta.barssince(ta.crossover(close, bfr))
barssincePullbackStart      = isCoralBullish ? barssinceBullPullbackStart : isCoralBearish ? barssinceBearPullbackStart : na

// Condition 4: Coral Trend colour matched trend direction for duration of pullback
sinceBullish                = ta.barssince(ta.crossover(bfr, nz(bfr[1])))
sinceBearish                = ta.barssince(ta.crossunder(bfr, nz(bfr[1])))
barssinceCoralflip          = isCoralBullish ? sinceBullish : isCoralBearish ? sinceBearish : na
isPullbackValid             = barssincePullbackStart < barssinceCoralflip

// Condition 5: After valid pullback, price then closes above/below (long/short) Coral Trend
entryBreakout               = (isCoralBullish and ta.crossover(close, bfr)) or (isCoralBearish and ta.crossunder(close, bfr))

// Condition 6: Confirmation indicators (6.1 or 6.2, optional depending on settings) confirms trade entry
// 6.1:         ADX and DI
//      6.1.1:  Green and red match trend (long=(green > red), short=(red > green))
//      6.1.2:  Blue > 20
//      6.1.3:  Blue trending up over last 1 candle
// 6.2:         Absolute Strengeh Histogram + HawkEye Volume Indicator
//      6.2.1:  Absolute Strengeh Histogram colour matches trend (long=blue, short=red)
//      6.2.2:  HawkEye Volume Indicator colour matches trend (long=green, short=red)
var longTradeConfirmed  = false
var shortTradeConfirmed = false
if confirmationInd      == "ADX and DI"
    isAdxUp             = ADX       > ADX [1]
    isAdxValid          = ADX       > midLine   and isAdxUp
    longTradeConfirmed := DIPlus    > DIMinus   and isAdxValid
    shortTradeConfirmed:= DIMinus   > DIPlus    and isAdxValid
else if confirmationInd == "Absolute Strength Histogram + HawkEye Volume"
    isAshBullish        = SmthBulls > SmthBears ? true : false
    isHevBullish        = not grEnabled     and gEnabled ? true : false
    isHevBearish        = not grEnabled     and rEnabled ? true : false
    longTradeConfirmed := isAshBullish      and isHevBullish
    shortTradeConfirmed:= not isAshBullish  and isHevBearish
else if confirmationInd == "None"
    longTradeConfirmed := true
    shortTradeConfirmed:= true

// Combine all entry conditions
goLong              = inDateRange and isCoralBullish and prePullbackBullBreakout and isPullbackValid and entryBreakout and longTradeConfirmed
goShort             = inDateRange and isCoralBearish and prePullbackBearBreakout and isPullbackValid and entryBreakout and shortTradeConfirmed

// Trade entry and exit variables
var tradeEntryBar   = bar_index
var profitPoints    = 0.
var lossPoints      = 0.
var slPrice         = 0.
var tpPrice         = 0.
var inLong          = false
var inShort         = false
var entryPrice      = 0.

// Entry decisions
openLong            = (goLong and not inLong)
openShort           = (goShort and not inShort)
flippingSides       = (goLong and inShort) or (goShort and inLong)
enteringTrade       = openLong or openShort
inTrade             = inLong or inShort

// Exit calculations
entryPrice         := close
longSlPrice         = ta.lowest(localHlLookback)
shortSlPrice        = ta.highest(localHlLookback)
slAmount            = isCoralBullish ? entryPrice - longSlPrice : shortSlPrice - entryPrice
slPercent           = math.abs((1 - (entryPrice - slAmount) / entryPrice) * 100)
tpPercent           = slPercent * riskReward

// Risk calculations
riskAmt             = strategy.equity * accountRiskPercent / 100
entryQty            = math.abs(riskAmt / slPercent * 100)  / close

if openLong
    if strategy.position_size < 0
        printTpSlNotHitBox(tradeEntryBar + 1, bar_index + 1, strategy.position_avg_price, slPrice, tpPrice)
        printTradeExitLabel(bar_index + 1, math.max(tpPrice, slPrice), strategy.position_size, strategy.position_avg_price, strategy.openprofit)
    strategy.entry("Long", strategy.long, qty = entryQty, alert_message = "Long Entry")
    enteringTrade   := true
    inLong          := true
    inShort         := false

if openShort
    if strategy.position_size > 0
        printTpSlNotHitBox(tradeEntryBar + 1, bar_index + 1, strategy.position_avg_price, slPrice, tpPrice)
        printTradeExitLabel(bar_index + 1, math.max(tpPrice, slPrice), strategy.position_size, strategy.position_avg_price, strategy.openprofit)
    strategy.entry("Short", strategy.short, qty = entryQty, alert_message = "Short Entry")
    enteringTrade   := true
    inShort         := true
    inLong          := false

if enteringTrade
    profitPoints    := percentAsPoints(tpPercent)
    lossPoints      := percentAsPoints(slPercent)
    slPrice         := calcStopLossPrice(lossPoints, openLong)
    tpPrice         := calcProfitTrgtPrice(profitPoints, openLong)
    tradeEntryBar   := bar_index

strategy.exit("TP/SL", profit = profitPoints, loss = lossPoints, comment_profit = "TP Hit", comment_loss = "SL Hit", alert_profit = "TP Hit Alert", alert_loss = "SL Hit Alert")

// =============================================================================
// DRAWINGS
// =============================================================================

// -----------
// TP/SL Boxes
// -----------

slHit           = (inShort and high >= slPrice) or (inLong  and low <= slPrice)
tpHit           = (inLong  and high >= tpPrice) or (inShort and low <= tpPrice)

exitTriggered   = slHit or tpHit
ctEntryPrice    = strategy.closedtrades.entry_price (strategy.closedtrades - 1)
pnl             = strategy.closedtrades.profit      (strategy.closedtrades - 1)
posSize         = strategy.closedtrades.size        (strategy.closedtrades - 1)

// Print boxes for trades closed at profit or loss
if (inTrade and exitTriggered)
    inShort    := false
    inLong     := false
    // printTpSlHitBox(tradeEntryBar, bar_index, slHit, tpHit, ctEntryPrice, slPrice, tpPrice)
    // printTradeExitLabel(bar_index, math.max(tpPrice, slPrice), posSize, ctEntryPrice, pnl)

// Print TP/SL box for current open trade
// if barstate.islastconfirmedhistory and strategy.position_size != 0
//     printTpSlNotHitBox(tradeEntryBar + 1, bar_index + 1, strategy.position_avg_price, slPrice, tpPrice)

// // =============================================================================
// // DEBUGGING
// // =============================================================================

// Data window plots
plotchar(prePullbackBullBreakout,   "prePullbackBullBreakout",  "")
plotchar(prePullbackBearBreakout,   "prePullbackBearBreakout",  "")
plotchar(barssincePullbackStart,    "barssincePullbackStart",   "")
plotchar(isCoralBullish,            "isCoralBullish",           "")
plotchar(isCoralBearish,            "isCoralBearish",           "")
plotchar(barssinceCoralflip,        "barssinceCoralflip",       "")
plotchar(isPullbackValid,           "isPullbackValid",          "")
plotchar(entryBreakout,             "entryBreakout",            "")
plotchar(slHit,                     "slHit",                    "")
plotchar(tpHit,                     "tpHit",                    "")
plotchar(slPrice,                   "slPrice",                  "")

// Label plots
// plotDebugLabels = false
// if plotDebugLabels
//     if bar_index == tradeEntryBar
//         printLabel(bar_index, "Position size: " + str.tostring(entryQty * close, "#.##"))