Базовая стратегия для прорыва восходящего тренда
Обзор
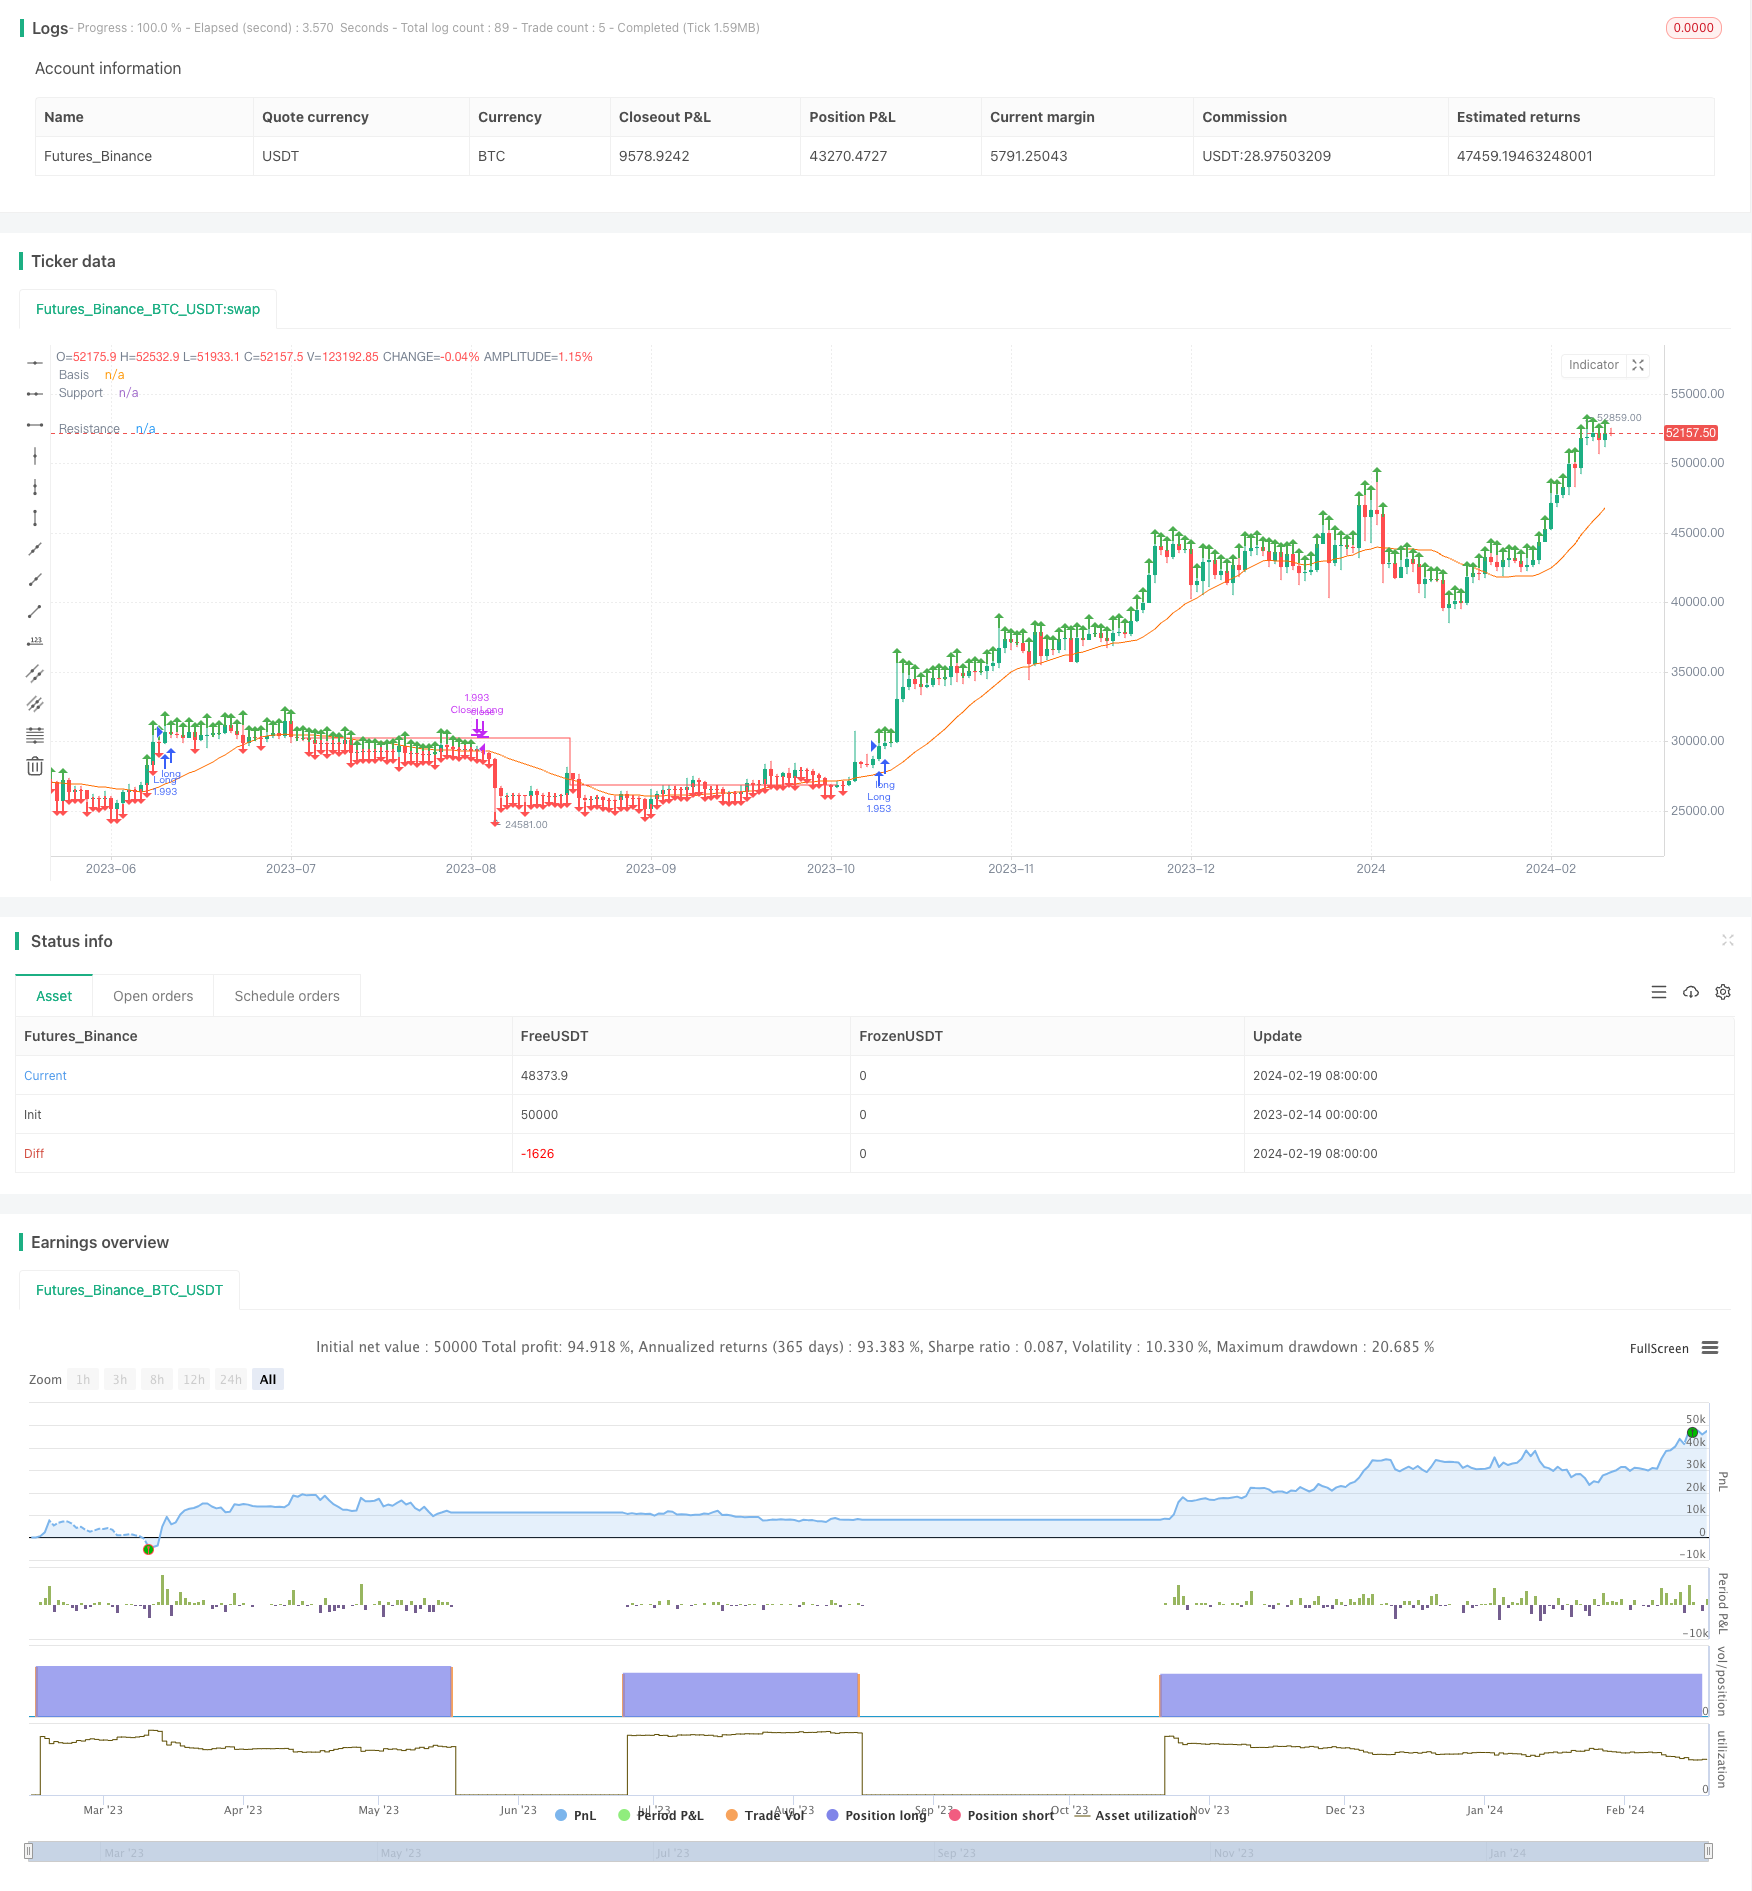
Эта стратегия - это долгосрочная стратегия, основанная на простом движущемся среднем, которая определяет направление тренда, а также поддерживает сопротивление, чтобы сформировать сигнал прорыва. С помощью вычисления цены Pivot Highs и Pivot Lows, вычислить сопротивление и поддержку, сделать больше, когда цена прорывает сопротивление, и плавную позицию, когда она прорывает поддержку.
Стратегический принцип
- Вычисление 20-дневной простой скользящей средней в качестве ориентира для определения тенденции
- Вычисление пивотной высоты и пивотной низки в зависимости от введенных пользователем параметров
- Нарисуйте линию сопротивления и линию поддержки в зависимости от Pivot High и Pivot Low
- Если цена закрытия выше линии сопротивления, то нужно сделать дополнительный вход.
- Прямая позиция, когда поддержка проходит через линию сопротивления
Эта стратегия использует простые движущиеся средние, чтобы определить направление общей тенденции, а затем использует ключевые точки, чтобы сформировать торговый сигнал, и относится к типичным стратегиям типа прорыва. С помощью ключевых точек и тенденций можно эффективно фильтровать ложные прорывы.
Анализ преимуществ
- У нас есть много возможностей для стратегии, подходящей для высоко волатильных акций, и мы можем легко улавливать тенденции.
- Управление рисками: риски выше, чем выгоды
- Сигналы проникновения помогут избежать риска ложного проникновения
- Настраиваемые параметры, адаптивность
Анализ рисков
- Оптимизация зависит от параметров, неправильные параметры увеличивают вероятность ложного прорыва
- Сигнал прорыва задерживается, возможно, пропускается часть возможностей
- Ущерб от землетрясений
- Несвоевременная коррекция линии поддержки может привести к убыткам
Снижение риска может быть достигнуто путем оптимизации параметров на фиксированном диске в сочетании с стратегией остановки убытков.
Направление оптимизации
- Оптимизация циклических параметров скользящих средних
- Оптимизация параметров резистентной линии
- Добавление стратегии остановки убытков
- Дополнение механизма подтверждения прорыва
- Фильтрация сигналов на такие показатели, как объем торгов
Подвести итог
Эта стратегия в целом является типичной стратегией прорыва, которая опирается на оптимизацию параметров и ликвидность и подходит для трейдеров, которые следят за тенденциями. Как эталонная система, она может быть модульно расширена в соответствии с реальными потребностями, чтобы снизить риск и повысить стабильность с помощью механизмов, таких как остановка убытков, фильтрация сигналов и т. Д.
/*backtest
start: 2023-02-14 00:00:00
end: 2024-02-20 00:00:00
period: 1d
basePeriod: 1h
exchanges: [{"eid":"Futures_Binance","currency":"BTC_USDT"}]
*/

// This source code is subject to the terms of the Mozilla Public License 2.0 at https://mozilla.org/MPL/2.0/
// © CheatCode1

//@version=5
strategy("Quantitative Trend Strategy- Uptrend long", 'Steady Uptrend Strategy', overlay=true, initial_capital = 1500, default_qty_value = 100, commission_type = strategy.commission.percent, commission_value = 0.01, default_qty_type = strategy.percent_of_equity)


length = input.int(20, minval=1)
src = input(close, title="Source")
basis = ta.sma(src, length)
offset = input.int(0, "Offset", minval = -500, maxval = 500)
plot(basis, "Basis", color=#FF6D00, offset = offset)

inp1 = input.int(46, 'LookbackLeft')
inp2 = input.int(32, 'LookbackRight')

l1 = ta.pivothigh(close, inp1, inp2)
S1 = ta.pivotlow(close, inp1, inp2)

// plot(l1, 'Pivothigh', color.red, 1)
// // plot(S1, 'Pivot Low', color.red)

l1V = ta.valuewhen(l1, close, 0)
S1V = ta.valuewhen(S1, close, 0)

Plotl1 = not na(l1) ? l1V : na
PlotS1 = not na(S1) ? S1V : na

plot(Plotl1, 'Resistance', color.green, 1, plot.style_stepline, true)
plot(PlotS1, 'Support', color.red, 1, plot.style_stepline, true)

Priceforlong = close > l1V ? true : na
Priceforshort = close < S1V ? true : na

plotshape(Priceforlong ? high : na, 'p', shape.arrowup, location.abovebar, color.green, size = size.small)
plotshape(Priceforshort ? low : na, 's', shape.arrowdown, location.belowbar, color.red, size = size.small)

vol = volume
volma = ta.sma(vol, 20)

Plotl1C = ta.valuewhen(na(Plotl1), l1V, 0)
PlotS1C = ta.valuewhen(na(PlotS1), S1V, 0)
//Strategy Execution
volc = volume > volma

Lc1 = Priceforlong

Sc1 = Priceforshort

sL = Plotl1 < PlotS1 ? close : na
sS = PlotS1 > Plotl1 ? close : na


if Lc1
    strategy.entry('Long', strategy.long)
// if Sc1 and C2
//     strategy.entry('Short', strategy.short)

if Priceforshort
    strategy.cancel('Long')
if Priceforlong
    strategy.cancel('Short')


// Stp1 = ta.crossover(k, d)
// Ltp1 = ta.crossunder(k, d)
// Ltp = d > 70  ? Ltp1 : na
// Stp = d < 30  ? Stp1 : na


if strategy.openprofit >= 0 and sL
    strategy.close('Long')
if strategy.openprofit >= 0 and sS
    strategy.close('Short')
takeP = input.float(2, title='Take Profit') / 100
stopL = input.float(1.75, title='Stop Loss') / 100


// // Pre Directionality

Stop_L = strategy.position_avg_price * (1 - stopL)

Stop_S = strategy.position_avg_price * (1 + stopL)

Take_S= strategy.position_avg_price * (1 - takeP)

Take_L = strategy.position_avg_price * (1 + takeP)

// sL = Plotl1 < PlotS1 ? close : na
// sS = PlotS1 < Plotl1 ? close : na

// //Post Excecution
if strategy.position_size > 0 and not (Lc1)
    strategy.exit("Close Long", stop = Stop_L, limit = Take_L)

if strategy.position_size < 0 and not (Sc1)
    strategy.exit("Close Short", stop = Stop_S, limit = Take_S)