Техническая количественная торговая стратегия с несколькими индикаторами
Обзор
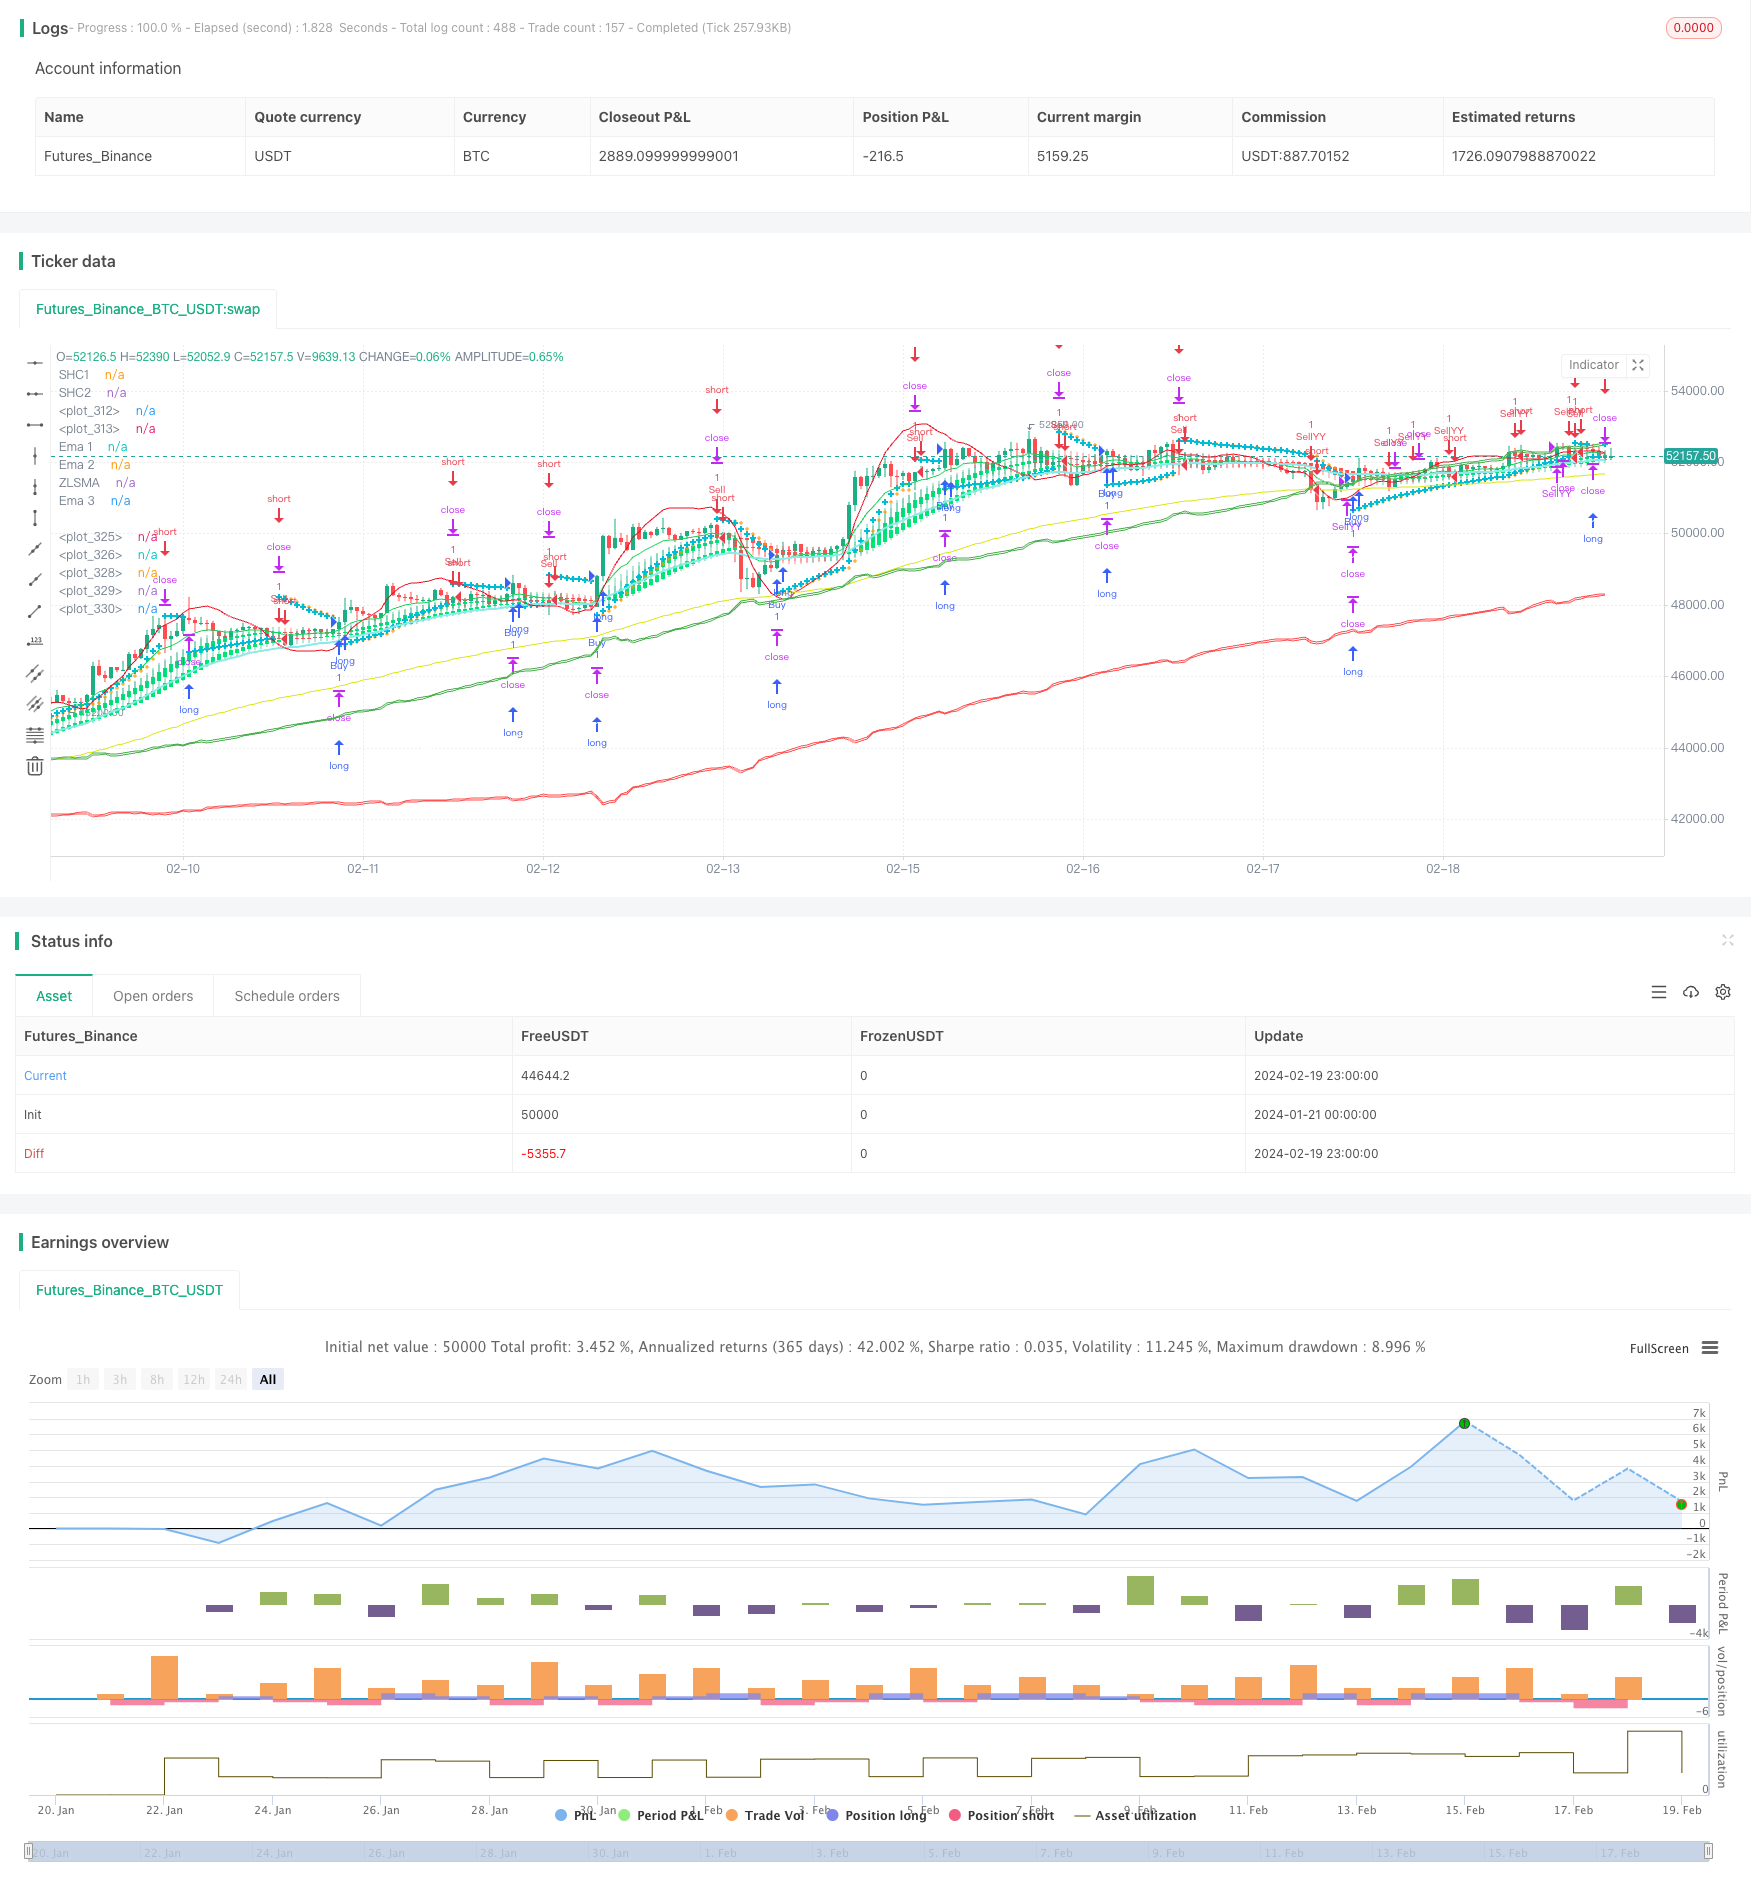
Стратегия использует множество технических показателей, включая параллельную линию, переходную систему, экспорт мнения, простые скользящие средние, индексные скользящие средние и текущие средние, чтобы идентифицировать потенциальные точки покупки и продажи на графике.
Стратегический принцип
Основные показатели
- Система параллельной линии: для определения остановочных и потенциальных точек входа
- Стратегия экспортного мнения: для определения направления тенденций
- Простая скользящая средняя с нулевым отставанием: предоставление скользящей средней с низким отставанием
- Индексные скользящие средние: отслеживание тенденций и колебаний цен
- Гладкая средняя линия: создание более гладкой средней линии
Торговые сигналы
- Когда парализовая линия поворачивает систему вверх и цена превышает 99-ю скользящую среднюю индекса, делать больше; когда она показывает тенденцию к снижению и цена ниже 99-й скользящей средней индекса, делать меньше
- Сигналы в сочетании с стратегией экспорта общественного мнения подтверждают дальнейшее направление тенденции
- Гладкая равномерная линия сочетается с сигналом параллельной линии, чтобы избежать ложного прорыва
Управление рисками
- Настройка стоп-лома и стоп-стоп
- Рассмотреть возможность переоформления условий покупки и гибкости в изменении позиций
Анализ преимуществ
Наибольшее преимущество этой стратегии заключается в том, что портфель индикаторов является всеобъемлющим, что позволяет эффективно идентифицировать направление тенденции. Система параллельных линий определяет потенциальные переломы; ОПИОННАЯ ЭКСПОРТНАЯ СТРАТЕГИЯ ОДНОЛОЖЕНИЯ ОДНОЛОЖЕНИЯ ПРИМЕРНЫХ ТРЕНДОВ; ПОДВИЖНАЯ СТРАТЕГИЯ ПРИМЕРНЫХ ФИЛТЕРОВ.
Кроме того, в стратегию включены механизмы остановки и остановки для управления рисками. Гладкая равновесие также используется для предотвращения помех от кратковременного шума. Все это делает стратегию очень стабильной.
Анализ рисков
Из-за зависимости от большого количества показателей, когда эти показатели посылают сигналы конфликта, эта стратегия сталкивается с определенными трудностями. Кроме того, неправильная настройка параметров может негативно повлиять на торговлю.
Кроме того, технические сделки сами по себе несут определенные риски, которые не позволяют полностью избежать убытков.
Направление оптимизации
- Тестирование и оптимизация параметров показателя для поиска оптимального сочетания
- Включение алгоритмов машинного обучения, использующих модели обучения большим объемам данных, для дальнейшего повышения точности сигналов
- Динамическая коррекция позиций и линий стоп-ложа в сочетании с эмоциональными показателями, информацией о новостях и другими факторами, определяющими состояние рынка
- Оптимизация логики перенаправления условий покупки, чтобы сделать обнаружение сигналов более гибким и последовательным
Подвести итог
Стратегия объединяет несколько технических показателей, чтобы идентифицировать торговые сигналы через комбинацию показателей. Преимущество заключается в высокой точности и стабильности сигнала. В то же время, меры по контролю риска находятся на месте. В целом, это набор торговых программ, которые стоит рассмотреть.
/*backtest
start: 2024-01-21 00:00:00
end: 2024-02-20 00:00:00
period: 1h
basePeriod: 15m
exchanges: [{"eid":"Futures_Binance","currency":"BTC_USDT"}]
*/


//@version=5
strategy("CE-ZLSMA-EMA-SAR-SHC", overlay=true)

// Parabolic SAR Strategy
start = input(0.02)
increment = input(0.02)
maximum = input(0.2)

var bool uptrend = na
var float EP = na
var float SAR = na
var float AF = start
var float nextBarSAR = na
var bool longSar = false
var bool shortSar = false
//input smoothed HAC 1
len=input.int(title="Length SHC1", defval = 10)
o=ta.ema(open,len)
c=ta.ema(close,len)
h=ta.ema(high,len)
l=ta.ema(low,len)

haclose = (o+h+l+c)/4
var haopen = 0.0
if na(haopen[1])
    haopen := (o + c) / 2
else
    haopen := (haopen[1] + haclose[1]) / 2


hahigh = math.max (h, math.max(haopen,haclose))
halow = math.min (l, math.min(haopen,haclose))

len2=input(10)
o2=ta.ema(haopen, len2)
c2=ta.ema(haclose, len2)
h2=ta.ema(hahigh, len2)
l2=ta.ema(halow, len2)

col=o2>c2 ? color.red : color.lime
bool shc1Green = o2 > c2
bool shc1Lime = o2 < c2
//input smoothed HAC 1
lenSHC2=input.int(title="Length SHC2 ", defval = 20)
oShc2=ta.ema(open,lenSHC2)
cShc2=ta.ema(close,lenSHC2)
hShc2=ta.ema(high,lenSHC2)
lShc2=ta.ema(low,lenSHC2)

hacloseShc2 = (oShc2+hShc2+lShc2+cShc2)/4
var haopenShc2 = 0.0
if na(haopenShc2[1])
    haopenShc2 := (oShc2 + cShc2) / 2
else
    haopenShc2 := (haopenShc2[1] + hacloseShc2[1]) / 2


hahighShc2 = math.max (hShc2, math.max(haopenShc2,hacloseShc2))
halowShc2 = math.min (lShc2, math.min(haopenShc2,hacloseShc2))

len2Shc2=input(10)
o2Shc2=ta.ema(haopenShc2, len2Shc2)
c2Shc2=ta.ema(hacloseShc2, len2Shc2)
h2Shc2=ta.ema(hahighShc2, len2Shc2)
l2Shc2=ta.ema(halowShc2, len2Shc2)

colShc2=o2Shc2>c2Shc2 ? color.red : color.lime
bool shc2Green = o2Shc2 > c2Shc2
bool shc2Lime = o2Shc2 < c2Shc2
//end smooth

bool shcGree = shc1Green and shc2Green
bool shcLime = shc1Lime and shc2Lime

//zlsma
lengthZlsma = input.int(title="Length", defval=32)
offset = input.int(title="Offset", defval=0)
src = input(close, title="Source")
lsma = ta.linreg(src, lengthZlsma, offset)
lsma2 = ta.linreg(lsma, lengthZlsma, offset)
eq= lsma-lsma2
zlsma = lsma+eq
// ema 10
len4 = input.int(10, minval=1, title="Length")
src4 = input.source(close, title="Source")
out4 = ta.ema(src4, len4)
//End of format

// ema 34
len5 = input.int(34, minval=1, title="Length")
src5 = input.source(close, title="Source")
out5 = ta.ema(src5, len5)
//end ema 34

// ema 99
len6 = input.int(99, minval=1, title="Length")
src6 = input.source(close, title="Source")
out6 = ta.ema(src6, len6)
// end ema 99

//kiem tra dieu kien gia dong cua lon hon ema99 thi moi me lenh long
bool onEma99 = close > out6
bool downEma99 = open < out6

if bar_index > 0
    firstTrendBar = false
    SAR := nextBarSAR
    if bar_index == 1
        float prevSAR = na
        float prevEP = na
        lowPrev = low[1]
        highPrev = high[1]
        closeCur = close
        closePrev = close[1]
        if closeCur > closePrev
            uptrend := true
            EP := high
            prevSAR := lowPrev
            prevEP := high
        else
            uptrend := false
            EP := low
            prevSAR := highPrev
            prevEP := low
        firstTrendBar := true
        SAR := prevSAR + start * (prevEP - prevSAR)
    if uptrend
		if SAR > low
			firstTrendBar := true
			uptrend := false
			SAR := math.max(EP, high)
			EP := low
			AF := start
	else
		if SAR < high
			firstTrendBar := true
			uptrend := true
			SAR := math.min(EP, low)
			EP := high
			AF := start
	if not firstTrendBar
		if uptrend
			if high > EP
				EP := high
				AF := math.min(AF + increment, maximum)
		else
			if low < EP
				EP := low
				AF := math.min(AF + increment, maximum)
	if uptrend
		SAR := math.min(SAR, low[1])
		if bar_index > 1
			SAR := math.min(SAR, low[2])
	else
		SAR := math.max(SAR, high[1])
		if bar_index > 1
			SAR := math.max(SAR, high[2])
	nextBarSAR := SAR + AF * (EP - SAR)
	if barstate.isconfirmed
		if uptrend
			// log.info("true")
			strategy.entry("ParSE", strategy.short, stop=nextBarSAR, comment="ParSE")
			strategy.cancel("ParLE")
			shortSar := false
			longSar := true
		else
			// log.info("false")
			strategy.entry("ParLE", strategy.long, stop=nextBarSAR, comment="ParLE")
			strategy.cancel("ParSE")
			longSar := false
			shortSar := true

// Chandelier Exit Strategy
length = input.int(title="ATR Period",  defval=1)
mult = input.float(title="ATR Multiplier",  step=0.1, defval=1.1)
showLabels = input.bool(title="Show Buy/Sell Labels ?",  defval=true)
useClose = input.bool(title="Use Close Price for Extremums ?",  defval=true)
highlightState = input.bool(title="Highlight State ?",  defval=true)

atr = mult * ta.atr(length)

longStop = (useClose ? ta.highest(close, length) : ta.highest(length)) - atr
longStopPrev = nz(longStop[1], longStop)
longStop := close[1] > longStopPrev ? math.max(longStop, longStopPrev) : longStop

shortStop = (useClose ? ta.lowest(close, length) : ta.lowest(length)) + atr
shortStopPrev = nz(shortStop[1], shortStop)
shortStop := close[1] < shortStopPrev ? math.min(shortStop, shortStopPrev) : shortStop


var int dir = 1
dir := close > shortStopPrev ? 1 : close < longStopPrev ? -1 : dir

var bool longOpened = false
var bool shortOpended = false
// Entry and exit logic
if (dir == 1)
	if longSar
		if not longOpened
			strategy.close("Sell", disable_alert = true)
    		strategy.order("Buy", strategy.long)
			longOpened := true
			shortOpended := false

if (dir == -1)
	if shortSar
		if not shortOpended
			strategy.close("Buy", disable_alert = true)
			strategy.order("Sell", strategy.short)
			shortOpended := true
			longOpened := false


//strategy YY
// ~~~~~~~~~~~ INPUTS ~~~~~~~~~~~ //
lenYY = input.int(80, "Trend Length:", tooltip="How far back should we span this indicator?\nThis length effects all lengths of the indicator")
purchaseSrc = input.source(close, "Purchase Source (Long and Short):", tooltip="What source needs to exit the purchase zone for a purchase to happen?")
exitSrc = input.source(close, "Exit Source (Long and Short):", tooltip="What source needs to hit a exit condition to stop the trade (Take profit, Stop Loss or hitting the other sides Purchase Zone)?")
useTakeProfit = input.bool(true, "Use Take Profit", tooltip="Should we take profit IF we cross the basis line and then cross it AGAIN?")
useStopLoss = input.bool(true, "Use Stop Loss", tooltip="Stop loss will ensure you don't lose too much if its a bad call")
stopLossMult = input.float(0.1, "Stoploss Multiplier %:", tooltip="How far from the purchase lines should the stop loss be")
resetCondition = input.string("Entry", "Reset Purchase Availability After:", options=["Entry", "Stop Loss", "None"],
 tooltip="If we reset after a condition is hit, this means we can purchase again when the purchase condition is met. \n" +
 "Otherwise, we will only purchase after an opposite signal has appeared.\n" +
 "Entry: means when the close enters the purchase zone (buy or sell).\n" +
 "Stop Loss: means when the close hits the stop loss location (even when were out of a trade)\n" +
 "This allows us to get more trades and also if our stop loss initally was hit but it WAS a good time to purchase, we don't lose that chance.")

// ~~~~~~~~~~~ VARIABLES ~~~~~~~~~~~ //
var bool longStart = na
var bool longAvailable = na
var bool longTakeProfitAvailable = na
var bool longStopLoss = na
var bool shortStart = na
var bool shortAvailable = na
var bool shortTakeProfitAvailable = na
var bool shortStopLoss = na

resetAfterStopLoss = resetCondition == "Stop Loss"
resetAfterEntry = resetCondition == "Entry"

// ~~~~~~~~~~~ CALCULATIONS ~~~~~~~~~~~ //
// Mid Line
midHigh = ta.vwma(ta.highest(high, lenYY), lenYY)
midLow = ta.vwma(ta.lowest(low, lenYY), lenYY)
mid = math.avg(midHigh, midLow)
midSmoothed = ta.ema(mid, lenYY)

//Volume Filtered
avgVol = ta.vwma(volume, lenYY)
volDiff = volume / avgVol
midVolSmoothed = ta.vwma(midSmoothed * volDiff, 3)

//RSI Filtered
midDifference = ta.sma(midHigh - midLow, lenYY)
midRSI = ta.rsi(midVolSmoothed, lenYY) * 0.01
midAdd = midRSI * midDifference

//Calculate Zones
purchaseZoneHigh = midSmoothed + midAdd
purchaseZoneLow = midSmoothed - midAdd
purchaseZoneBasis = math.avg(purchaseZoneHigh, purchaseZoneLow)

//Create Stop Loss Locations
stopLossHigh = purchaseZoneHigh * (1 + (stopLossMult * 0.01))
stopLossLow = purchaseZoneLow * (1 - (stopLossMult * 0.01))

// ~~~~~~~~~~~ PURCHASE CALCULATIONS ~~~~~~~~~~~ //
//Long
longEntry = ta.crossunder(purchaseSrc, purchaseZoneLow)
longStart := ta.crossover(purchaseSrc, purchaseZoneLow) and longAvailable
longAvailable := ta.crossunder(purchaseSrc, purchaseZoneHigh) or (resetAfterStopLoss and longStopLoss) or (resetAfterEntry and longEntry) ? true : longStart ? false : longAvailable[1]
longEnd = ta.crossover(exitSrc, purchaseZoneHigh)
longStopLoss := ta.crossunder(exitSrc, stopLossLow)
longTakeProfitAvailable := ta.crossover(exitSrc, purchaseZoneBasis) ? true : longEnd ? false : longTakeProfitAvailable[1]
longTakeProfit = ta.crossunder(exitSrc, purchaseZoneBasis) and longTakeProfitAvailable

//Short
shortEntry = ta.crossover(purchaseSrc, purchaseZoneHigh)
shortStart := ta.crossunder(purchaseSrc, purchaseZoneHigh) and shortAvailable
shortAvailable := ta.crossover(purchaseSrc, purchaseZoneLow) or (resetAfterStopLoss and shortStopLoss) or (resetAfterEntry and shortEntry)? true : shortStart ? false : shortAvailable[1]
shortEnd = ta.crossunder(exitSrc, purchaseZoneLow)
shortStopLoss := ta.crossover(exitSrc, stopLossHigh)
shortTakeProfitAvailable := ta.crossunder(exitSrc, purchaseZoneBasis) ? true : shortEnd ? false : shortTakeProfitAvailable[1]
shortTakeProfit = ta.crossover(exitSrc, purchaseZoneBasis) and shortTakeProfitAvailable

// ~~~~~~~~~~~ STRATEGY ~~~~~~~~~~~ //
var bool openLongYY = false
var bool openShortYY = false
if (longStart)
    strategy.order("BuyYY", strategy.long)
	strategy.close("SellYY", disable_alert = true)
	openLongYY := true
	openShortYY := false
else if (longEnd or (useStopLoss and longStopLoss) or (useTakeProfit and longTakeProfit))
    strategy.close("BuyYY", disable_alert = true)

if (shortStart)
	strategy.close("BuyYY", disable_alert = true)
    strategy.order("SellYY", strategy.short)
	openShortYY := true
	openLongYY := false
else if (shortEnd or (useStopLoss and shortStopLoss) or (useTakeProfit and shortTakeProfit))
    strategy.close("SellYY", disable_alert = true)

// ~~~~~~~~~~~ ALERTS ~~~~~~~~~~~ //
// if longStart or (longEnd or (useStopLoss and longStopLoss) or (useTakeProfit and longTakeProfit)) or shortStart or (shortEnd or (useStopLoss and shortStopLoss) or (useTakeProfit and shortTakeProfit))
//     alert("{{strategy.order.action}} | {{ticker}} | {{close}}", alert.freq_once_per_bar)

// Plotting
plot(SAR, style=plot.style_cross, linewidth=1, color=color.orange)
plot(nextBarSAR, style=plot.style_cross, linewidth=3, color=color.aqua)
plot(zlsma, color=color.rgb(235, 15, 33), linewidth=1, title = "ZLSMA")

plot(out4, color=color.rgb(24, 209, 85), title="Ema 1")
plot(out5, color=color.rgb(139, 234, 231), linewidth = 2, title="Ema 2")
plot(out6, color=color.rgb(219, 230, 18), title="Ema 3")

plotcandle(o2, h2, l2, c2, title="SHC1", color=col)
plotcandle(o2Shc2, hShc2, l2Shc2, c2Shc2, title="SHC2", color=col)


// ~~~~~~~~~~~ PLOTS YY ~~~~~~~~~~~ //
shortLine = plot(purchaseZoneHigh, color=color.green)
shortStopLossLine = plot(stopLossHigh, color=color.green) //color=color.rgb(0, 97, 3)
fill(shortLine, shortStopLossLine, color = color.new(color.green, 90))
plot(purchaseZoneBasis, color=color.white)
longLine = plot(purchaseZoneLow, color=color.red)
longStopLossLine = plot(stopLossLow, color=color.red) //color=color.rgb(105, 0, 0)
fill(longLine, longStopLossLine, color=color.new(color.red, 90))