Стратегия тройного перекрытия супертренда
Обзор
Это стратегия, которая использует трёхкратное наложение сверхтрендовых индикаторов для принятия торговых решений. Она позволяет уловить большие направленные возможности в трендовых ситуациях.
Стратегический принцип
Эта стратегия использует функцию ta.supertrend() для вычисления индикатора супертренда с тремя различными параметрами. Она рассчитывает супертренд 10-го дня с 3-кратным ATR, супертренд 1-го дня с 2-кратным ATR, супертренд 2-го дня с 14-го дня, супертренд 2-го дня с 2-кратным ATR и супертренд 3-го дня с 2-кратным ATR на 20-й день.
Показатель супертенденции в сочетании с показателем ATR позволяет эффективно отслеживать тенденции изменения цены. Трехкратное наложение стратегии супертенденции делает сигнал более надежным, что позволяет получать большую прибыль в трендовых ситуациях.
Стратегические преимущества
- Трехкратная фильтрация, предотвращение ложных сигналов, улучшение качества сигнала
- Сами по себе индикаторы супертенденции обладают хорошей функцией шумоподавления.
- Конфигурируемые комбинации сверхпаметров для более широкой рыночной среды
- Исторические тесты показали хорошие результаты, прибыль - риск
Стратегический риск
- Некоторые возможности могут быть упущены с помощью многократных фильтров
- Не очень хорошо в условиях землетрясения
- Оптимизация комбинаций из трех групп гиперпараметров
- Централизованные торговые часы подвержены влиянию внезапных событий
Для снижения риска можно рассмотреть следующие моменты:
- Фильтрационные условия изменены, чтобы сохранить одну или две сверхтенденции.
- Увеличение стратегии по удержанию
- Оптимизация сверхпараметров, повышение выигрыша
Направление оптимизации стратегии
- Испытание большего количества комбинаций параметров, чтобы найти оптимальный суперпараметр
- Добавление алгоритмов машинного обучения, оптимизация параметров в реальном времени
- Увеличение стратегии по сдерживанию убытков и борьба с единичными потерями
- В сочетании с другими показателями, чтобы определить тенденции и колебания
- Расширяйте время торговли, избегайте риска в одном временном узле
Подвести итог
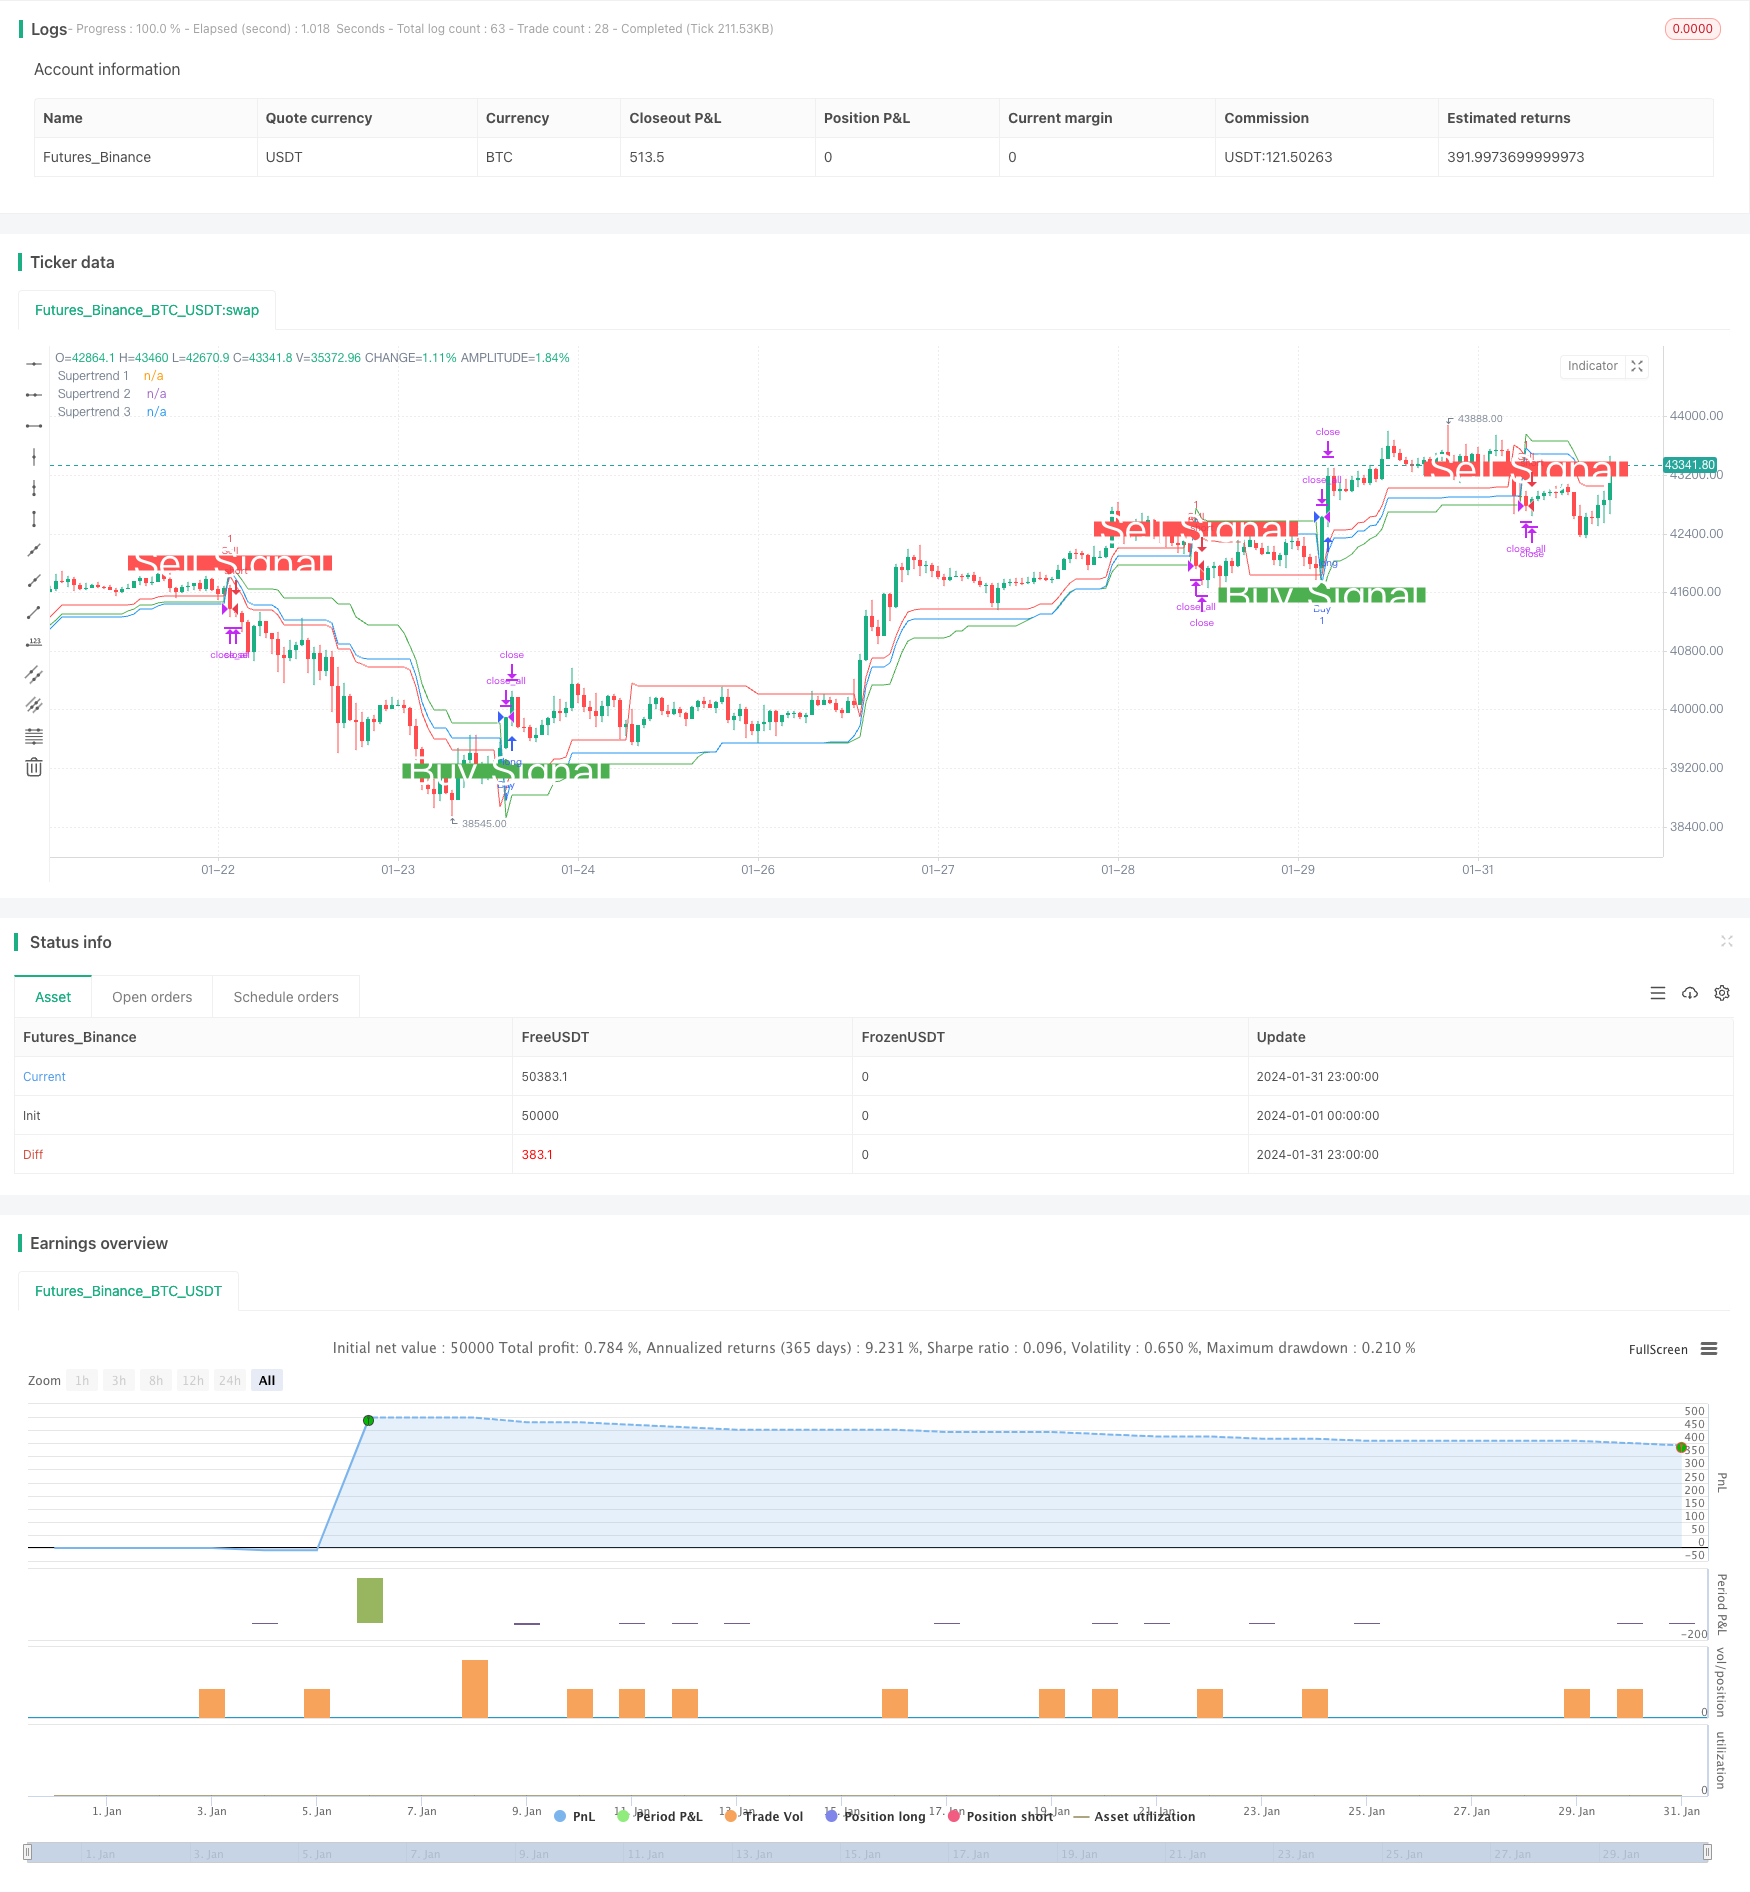
Эта стратегия использует тройное наложение сверхтенденций для принятия решений и эффективного определения направления тенденции. Она обладает преимуществами высокого качества сигнала, оптимизации параметров и т. Д. В то же время существует определенный риск, требующий корректировки параметров и времени выхода, чтобы адаптироваться к различным рыночным условиям. В целом, эта стратегия показала выдающиеся результаты и заслуживает дальнейшего изучения и применения.
/*backtest
start: 2024-01-01 00:00:00
end: 2024-01-31 23:59:59
period: 1h
basePeriod: 15m
exchanges: [{"eid":"Futures_Binance","currency":"BTC_USDT"}]
*/

//@version=5
strategy('Combined Supertrend Strategy - Ajit Prasad', overlay=true)

// Function to calculate Supertrend
supertrendFunc(atrLength, factor) =>
    [supertrend, direction] = ta.supertrend(factor, atrLength)
    [supertrend, direction]

// Input parameters for the first Supertrend
atrPeriod1 = input(10, 'ATR Length 1')
factor1 = input(3, 'Factor 1')

// Calculate the first Supertrend
[supertrend1, direction1] = supertrendFunc(atrPeriod1, factor1)

// Input parameters for the second Supertrend
atrPeriod2 = input(14, 'ATR Length 2') // Change values as needed
factor2 = input(2, 'Factor 2') // Change values as needed

// Calculate the second Supertrend
[supertrend2, direction2] = supertrendFunc(atrPeriod2, factor2)

// Input parameters for the third Supertrend
atrPeriod3 = input(20, 'ATR Length 3') // Change values as needed
factor3 = input(2.5, 'Factor 3') // Change values as needed

// Calculate the third Supertrend
[supertrend3, direction3] = supertrendFunc(atrPeriod3, factor3)

// Define market opening and closing times
marketOpenHour = 9
marketOpenMinute = 15
marketCloseHour = 15
marketCloseMinute = 30
exitTimeHour = 15
exitTimeMinute = 10

// Fetch historical close values using security function
histClose = request.security(syminfo.tickerid, "D", close)

// Buy condition
buyCondition = close > supertrend1 and close > supertrend2 and close > supertrend3 and close[1] <= supertrend1[1]

// Sell condition
sellCondition = close < supertrend1 and close < supertrend2 and close < supertrend3 and close[1] >= supertrend1[1]

// Exit conditions
buyExitCondition = close < supertrend1[1] or close < supertrend2[1] or close < supertrend3[1]
sellExitCondition = close > supertrend1[1] or close > supertrend2[1] or close > supertrend3[1]

// Execute orders with market timing
if true
    // Buy condition without 'and not'
    strategy.entry('Buy', strategy.long, when = buyCondition)

    // Sell condition without 'and not'
    strategy.entry('Sell', strategy.short, when = sellCondition)

    // Close conditions
    strategy.close('Buy', when = buyExitCondition )
    strategy.close('Sell', when = sellExitCondition)

// Close all trades at 3:10 pm IST
if true
    strategy.close_all()

// Plot Supertrends
plot(supertrend1, 'Supertrend 1', color=color.new(color.green, 0), style=plot.style_linebr)
plot(supertrend2, 'Supertrend 2', color=color.new(color.red, 0), style=plot.style_linebr)
plot(supertrend3, 'Supertrend 3', color=color.new(color.blue, 0), style=plot.style_linebr)

// Plot labels
plotshape(buyCondition, style=shape.labelup, location=location.belowbar, color=color.new(color.green, 0), size=size.large, text='Buy Signal', textcolor=color.new(color.white, 0))
plotshape(sellCondition, style=shape.labeldown, location=location.abovebar, color=color.new(color.red, 0), size=size.large, text='Sell Signal', textcolor=color.new(color.white, 0))