Стратегия многовременной торговли на основе индикатора сжатия

Обзор
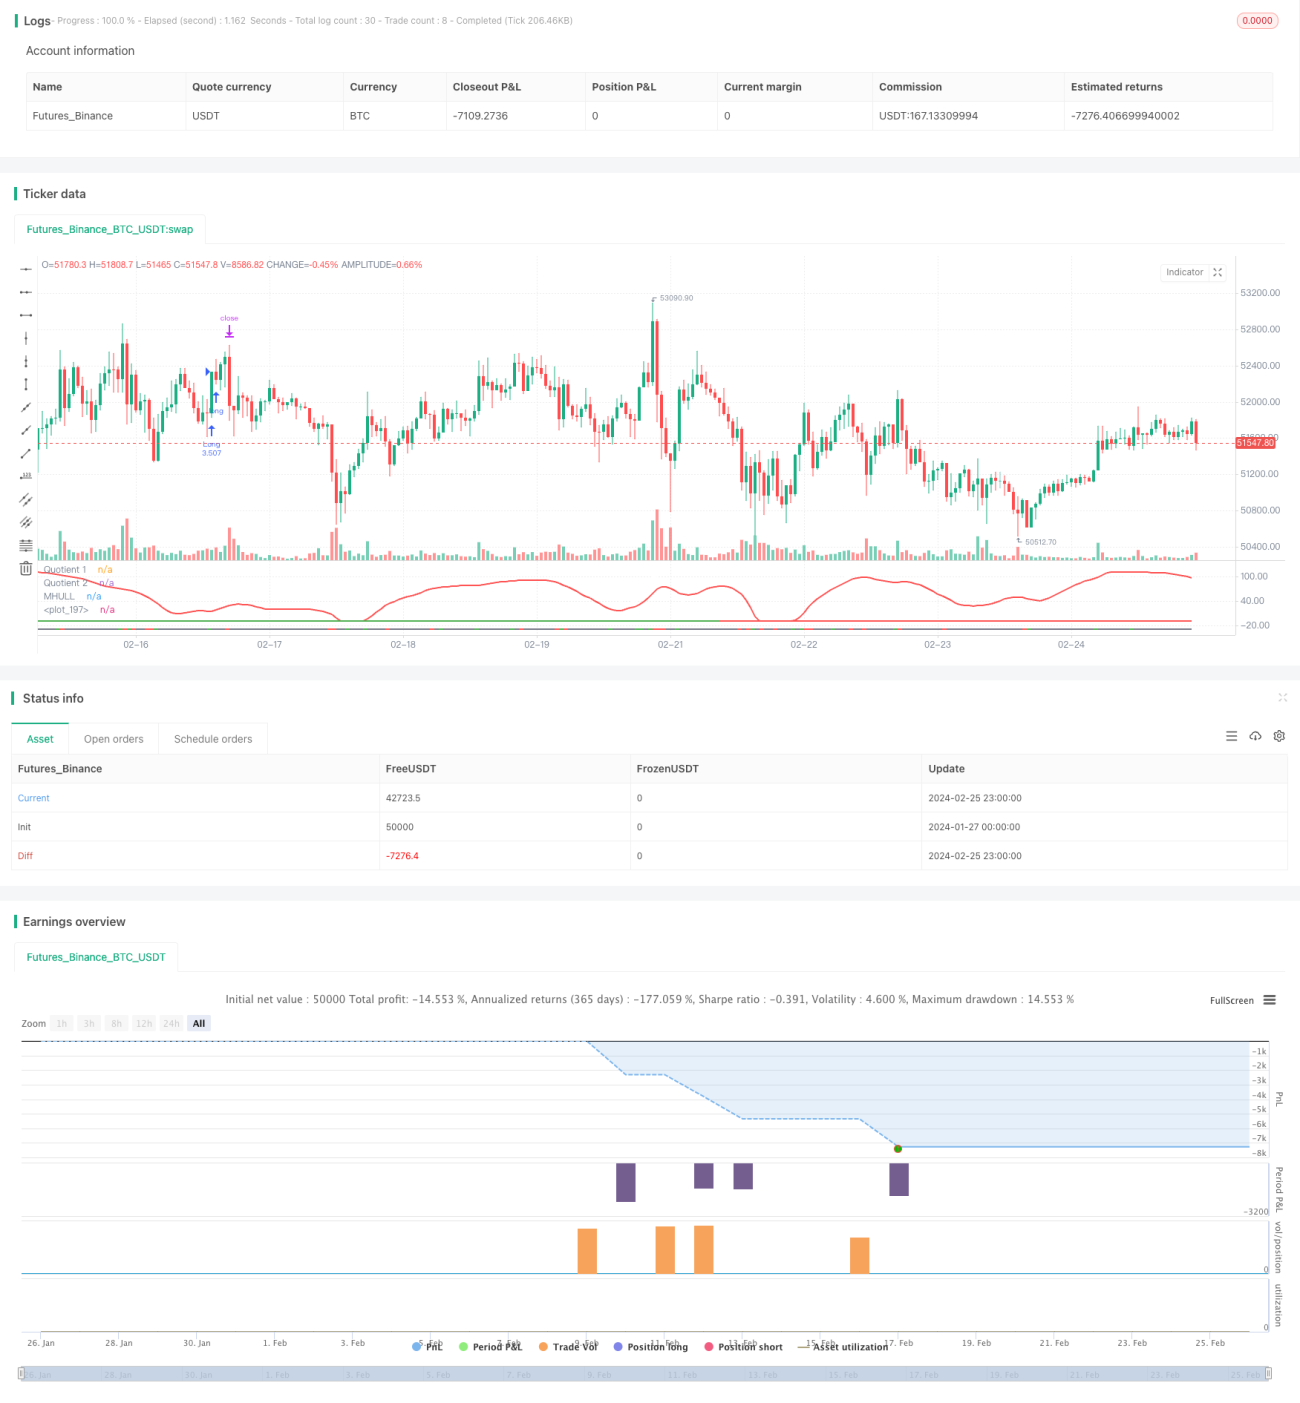
Эта стратегия реализует количественную стратегию для отслеживания тенденций и совершения сделок с прорывом в течение нескольких временных рамок путем объединения трех показателей Boom Hunter, Hull Suite и Volatility Oscillator. Эта стратегия применима к цифровым активам, таким как биткойн, с высокой волатильностью и внезапными ценовыми явлениями.
Принципы
Основная логика этой стратегии основана на следующих трех показателях:
-
Охотники за тканями: Оциллятор, реализованный с использованием технологии сжатия индикаторов, для определения сигналов покупки и продажи путем скрещивания двух индикаторов (Quotient1 и Quotient2).
-
Hull Suite (англ.) (недоступная ссылка): набор гладких движущихся среднелинейных индикаторов, используемых для определения направления тенденции по отношению к среднему и верхнему и нижнему трекам.
-
Волатильный осцилляторОригинальное название: Oscillatory indicator of quantitative price fluctuation information.
Входная логика этой стратегии заключается в том, что в то время, когда два показателя Quotient для ловца тканей пересекаются вверх или вниз, цена должна прорваться через среднюю траекторию Хелла и отклониться от верхней или нижней траектории, в то время как показатель колебаний находится в зоне перекупа. Это позволяет отфильтровать некоторые ложные сигналы прорыва и повысить точность входа.
Стоп-убыток устанавливается путем поиска наименьшей долины или наивысшей вершины за определенный период (по умолчанию 20 K-линий), а прибыль получается за счет стоп-убытков в процентном соотношении, умноженном на конфигурацию стоп-убытков (по умолчанию в 3 раза). Позиции рассчитываются на основе процента от общего объема активов счета (по умолчанию в 3%) и стоп-убытков для конкретного параметра.
Преимущества
- Использование технологии сжатия индикаторов для извлечения основных торговых сигналов из цены для повышения вероятности получения прибыли
- Проверка комбинации множественных показателей, избегание ложных прорывов, точное определение направления тенденции
- Настройка динамического стоп-стоп, отслеживание тенденций с управляемым риском
- Использование показателей волатильности для обеспечения высоко волатильной торговли
- Анализ многократных временных рамок для повышения стабильности стратегии
Риск
- Показатель охотников за тканями может быть искажен с помощью сжатия, что приводит к ошибочному сигналу
- По словам эксперта, это приведет к задержкам в работе сети Hull, что не позволит вовремя отслеживать изменения цен.
- В случае снижения волатильности, возможно, будет упущена возможность совершить сделку, или же это приведет к убыточному плавающему положению.
Решение проблемы:
- Настройка параметров показателя сжатия, балансировка чувствительности показателя
- Попробуйте использовать скользящие средние индексов, такие как EHMA, вместо средних
- Добавление других критериев оценки, чтобы избежать ошибочного восприятия колебаний
Оптимизация
Эта стратегия может быть оптимизирована в следующих аспектах:
-
Параметры оптимизации: получение оптимального сочетания параметров путем изменения параметров показателя, таких как длина цикла, коэффициент сжатия и т. д.
-
Оптимизация временных рамок: тестирование различных временных циклов ((1 минута, 5 минут, 30 минут и т. д.), поиск наиболее подходящего цикла торговли
-
Оптимизация позицийПоиск оптимальных вариантов использования капитала: изменение размера и пропорций позиций при каждой сделке
-
Оптимизация убытковПримечание: Для достижения оптимального риско-рентабельного соотношения необходимо корректировать свои стоп-позиции в зависимости от различных сделок.
-
Оптимизация условийУвеличение или уменьшение критериев фильтрации показателей для более точного времени входа в игру
Подвести итог
Эта стратегия использует комбинацию из трех показателей: ловцов, пакетов Хелл и волатильности осциллятора, чтобы реализовать торговлю с отслеживанием тенденций в течение нескольких временных рамок, эффективно идентифицировать внезапные действия цены и применяется к цифровым активам с высокой волатильностью. Эта стратегия является управляемой риском, оптимизируется с помощью параметров, волатильных условий и остановки убытков, имеет высокую практическую эффективность и масштабируемость.
- 1