TrendHunter w/MF многотаймфреймовая трендовая стратегия

Обзор
TrendHunter w/MF — это стратегия следования за трендом на нескольких таймфреймах, основанная на множестве технических индикаторов и многотаймфреймовом анализе. Стратегия комплексно учитывает такие факторы, как облако Ишимоку, скользящие средние, SuperTrend, WaveTrend и денежный поток, и использует строгие условия для определения точек входа с целью захвата основного тренда рынка.
Принцип стратегии
Основной принцип стратегии заключается в комплексном анализе множества технических индикаторов на нескольких таймфреймах. В частности:
-
Облако Ишимоку (Ichimoku): Анализ относительного положения цены и облака, а также скользящей средней относительно облака для определения текущего рыночного тренда. Когда цена находится выше облака, а скользящая средняя также выше облака, считается восходящий тренд; в противном случае — нисходящий.
-
SuperTrend: Анализ относительного положения цены и SuperTrend для подтверждения текущего рыночного тренда. Когда цена находится выше SuperTrend, считается восходящий тренд; в противном случае — нисходящий.
-
WaveTrend: Анализ направления и положения индикатора WaveTrend для определения текущего рыночного тренда. Когда WaveTrend направлен вверх и не достигает зоны перекупленности, считается восходящий тренд; когда WaveTrend направлен вниз и не достигает зоны перепроданности, считается нисходящий тренд.
-
Денежный поток (MoneyFlow): Анализ состояния индикатора денежного потока для подтверждения текущего рыночного тренда. Когда денежный поток положителен, считается восходящий тренд; в противном случае — нисходящий.
При открытии длинной позиции стратегия требует, чтобы цена находилась выше облака, скользящая средняя выше облака, SuperTrend был направлен вверх, WaveTrend направлен вверх и не достиг зоны перекупленности, а денежный поток был положительным. Для короткой позиции — противоположные условия. Такая строгая фильтрация по множеству индикаторов и таймфреймов эффективно позволяет избежать частых сделок в боковом рынке, тем самым повышая стабильность и надежность стратегии.
Анализ преимуществ
-
Высокая надежность за счет комплексной оценки нескольких индикаторов: Стратегия учитывает несколько технических индикаторов, которые дополняют друг друга в различных рыночных состояниях, обеспечивая всестороннее отражение рыночного тренда и избегая возможных ошибок отдельных индикаторов.
-
Строгие условия входа, позволяющие избежать частых сделок: Стратегия устанавливает жесткие условия входа; для открытия позиции требуется одновременное выполнение условий по нескольким индикаторам. Это эффективно предотвращает частые сделки в боковом рынке и снижает издержки стратегии.
-
Многотаймфреймовый анализ для охвата основного тренда: Стратегия анализирует несколько таймфреймов, что помогает ей рассматривать основной тренд рынка с более широкой перспективы, избегая влияния краткосрочного шума.
-
Четкая стратегия стоп-лосса, контролируемый риск: Стратегия использует SuperTrend в качестве условия стоп-лосса. Как только рыночный тренд меняется, стратегия своевременно закрывает позицию, ограничивая убытки в приемлемых рамках.
Анализ рисков
-
Отсутствие динамической адаптации, ограниченная способность реагировать на изменения рынка: Параметры стратегии фиксированы и не адаптируются к состоянию рынка. При существенных изменениях рыночных условий стратегия может перестать работать.
-
Чрезмерно строгие условия входа, возможен пропуск хороших возможностей: Условия входа очень жесткие. Хотя это позволяет избежать частых сделок, это также может привести к пропуску некоторых хороших точек входа.
-
Неизвестная адаптация к экстремальным рыночным ситуациям: Стратегия хорошо работает в обычных рыночных условиях, но ее адаптация к экстремальным ситуациям, таким как резкие и значительные движения, еще требует проверки.
-
Относительно простая стратегия стоп-лосса с возможностью оптимизации: В настоящее время стратегия использует только SuperTrend как условие стоп-лосса. Это просто и понятно, но есть возможности для дальнейшей оптимизации стратегии управления рисками.
Направления оптимизации
-
Внедрить оценку состояния рынка, динамически корректировать параметры: Можно рассмотреть введение индикаторов состояния рынка, таких как индикаторы волатильности, для динамической настройки параметров стратегии в зависимости от изменения рыночных условий, чтобы адаптироваться к различным рыночным средам.
-
Оптимизировать условия входа для повышения чувствительности: Можно рассмотреть оптимизацию условий входа, например, ввести дополнительные подтверждающие индикаторы, чтобы повысить чувствительность стратегии при сохранении надежности и уловить больше торговых возможностей.
-
Добавить меры противодействия экстремальным рыночным ситуациям: Для экстремальных ситуаций, таких как резкие и значительные движения, можно рассмотреть введение специальных мер, таких как более сильный стоп-лосс или приостановка торговли, чтобы снизить риск стратегии в таких условиях.
-
Оптимизировать стратегию стоп-лосса для улучшения контроля рисков: Можно рассмотреть введение большего количества условий стоп-лосса, таких как временной стоп-лосс, стоп-лосс по ширине канала, а также динамические стоп-лоссы, например, трейлинг-стоп, для лучшего контроля рисков.
Заключение
TrendHunter w/MF — это стратегия следования за трендом, основанная на анализе множества индикаторов и нескольких таймфреймов. Благодаря комплексному учету факторов облака Ишимоку, скользящих средних, SuperTrend, WaveTrend и денежного потока, строгим условиям входа и многотаймфреймовому анализу, стратегия может достаточно надежно захватывать основные тренды рынка, избегая частых сделок в боковом рынке, что обеспечивает хорошую стабильность и надежность.
В то же время стратегия имеет некоторые ограничения и риски, такие как отсутствие динамической адаптации, возможно излишне строгие условия входа, неизвестная адаптация к экстремальным ситуациям и относительно простая стратегия стоп-лосса. Это направления, по которым стратегия может быть оптимизирована и улучшена в будущем.
В целом, TrendHunter w/MF — это многообещающая стратегия следования за трендом. При ее использовании трейдеру необходимо полностью понимать ее принципы, преимущества и риски, а также вносить необходимые корректировки и оптимизации в соответствии со своей склонностью к риску и стилем торговли. Кроме того, следует внимательно следить за изменениями рыночных условий и своевременно адаптировать стратегию к изменениям рынка. Только на основе глубокого понимания и осторожного использования эта стратегия сможет раскрыть свой потенциальный потенциал и приносить трейдеру стабильную прибыль.
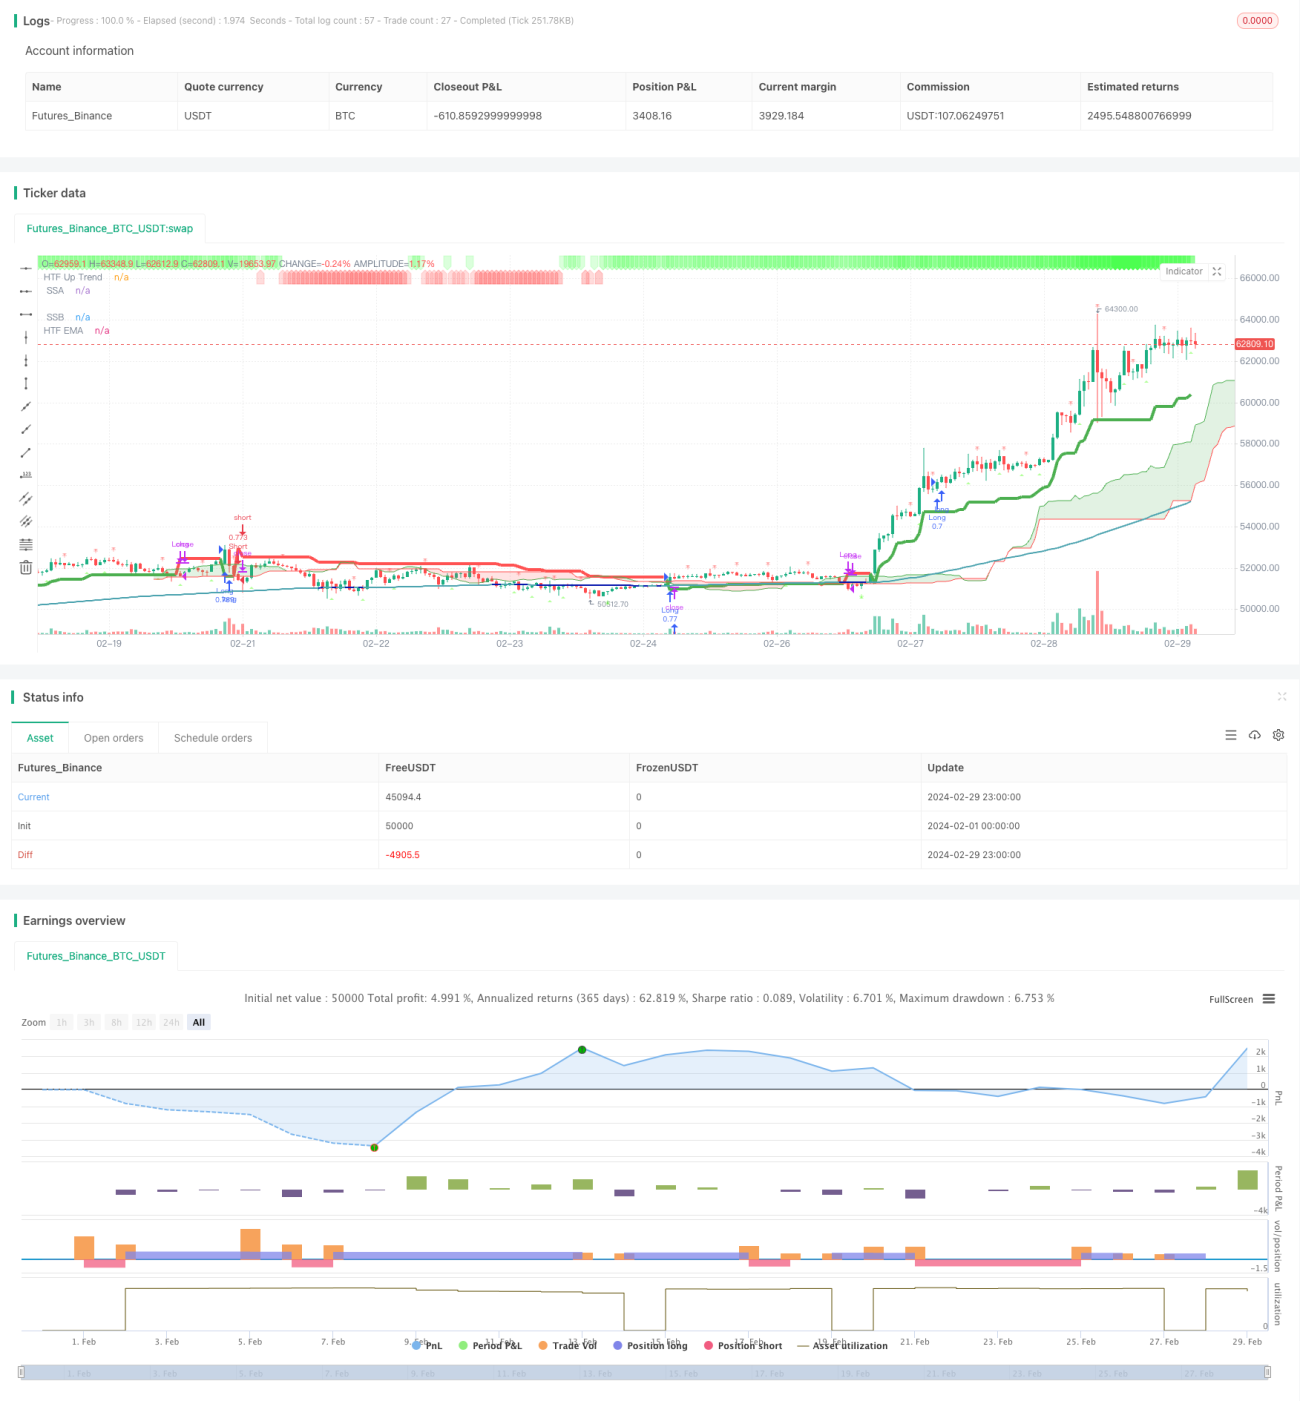
/*backtest
start: 2024-02-01 00:00:00
end: 2024-02-29 23:59:59
period: 1h
basePeriod: 15m
exchanges: [{"eid":"Futures_Binance","currency":"BTC_USDT"}]
*/

// This Pine Script™ code is subject to the terms of the Mozilla Public License 2.0 at https://mozilla.org/MPL/2.0/
// © godzcopilot / blockybears

// Thanks to anthonyf50 for his MTF Ichimoku https://www.tradingview.com/script/Pw9cBFma/- 1