Двойная стратегия RSI и полос Боллинджера

Обзор
Эта стратегия, которая сочетает в себе два технических показателя, относительно сильные и слабые индексы (RSI) и полосы (Bollinger Bands), создает сигнал покупки, когда цена находится ниже отклонения от полосы, и сигнал продажи, когда цена находится выше отклонения от полосы. Эта стратегия запускает торговый сигнал только в том случае, если RSI и полоса находятся одновременно в состоянии перепродажи или перекупа.
Стратегический принцип
- Рассчитайте RSI в соответствии с установленными RSI-параметрами.
- Расчет средней, верхней и нижней полос по формуле ленты Бурин.
- Оценить, прорвет ли текущий конечный курс по Брин-Бенду, чтобы подняться или опуститься.
- Определите, превышает ли текущий RSI превышение или превышение.
- Соответствующий торговый сигнал создается, когда BRI и RSI одновременно выполняют условия покупки или продажи.
Стратегические преимущества
- С помощью технических показателей, включающих тенденции и динамику, можно более полно оценить состояние рынка.
- Использование одновременно двух показателей в качестве фильтрующих условий эффективно снижает вероятность появления ложных сигналов.
- Логика кода ясна, параметры настроены гибко, для различных рыночных условий и стилей торговли.
Стратегический риск
- В условиях нестабильных рынков эта стратегия может привести к большему количеству убыточных сделок.
- Неправильная настройка параметров может привести к неэффективной работе стратегии, которую необходимо оптимизировать в соответствии с реальными обстоятельствами.
- Стратегия не включает в себя стоп-лосс, что может привести к более высокому риску отмены.
Направление оптимизации стратегии
- Параметры RSI и BRI могут быть оптимизированы в зависимости от рыночных особенностей и личных предпочтений.
- Внедрение других технических показателей, таких как MACD, средняя линия и т. д., повышает надежность сигнала.
- Установка разумных стоп-лосс и стоп-стопов для контроля риска по отдельным сделкам.
- В случае с волатильными рынками, можно рассмотреть возможность увеличения условий оценки или уменьшения позиций, чтобы снизить затраты, связанные с частотой торгов.
Подвести итог
Двойная стратегия RSI и Brin Belt позволяет более полно оценить состояние рынка и дать соответствующие торговые сигналы, используя в сочетании трендовые и динамические показатели. Однако эта стратегия может плохо работать в волатильных рынках и не включает в себя меры по контролю за риском, поэтому следует соблюдать осторожность при использовании в реальном мире.
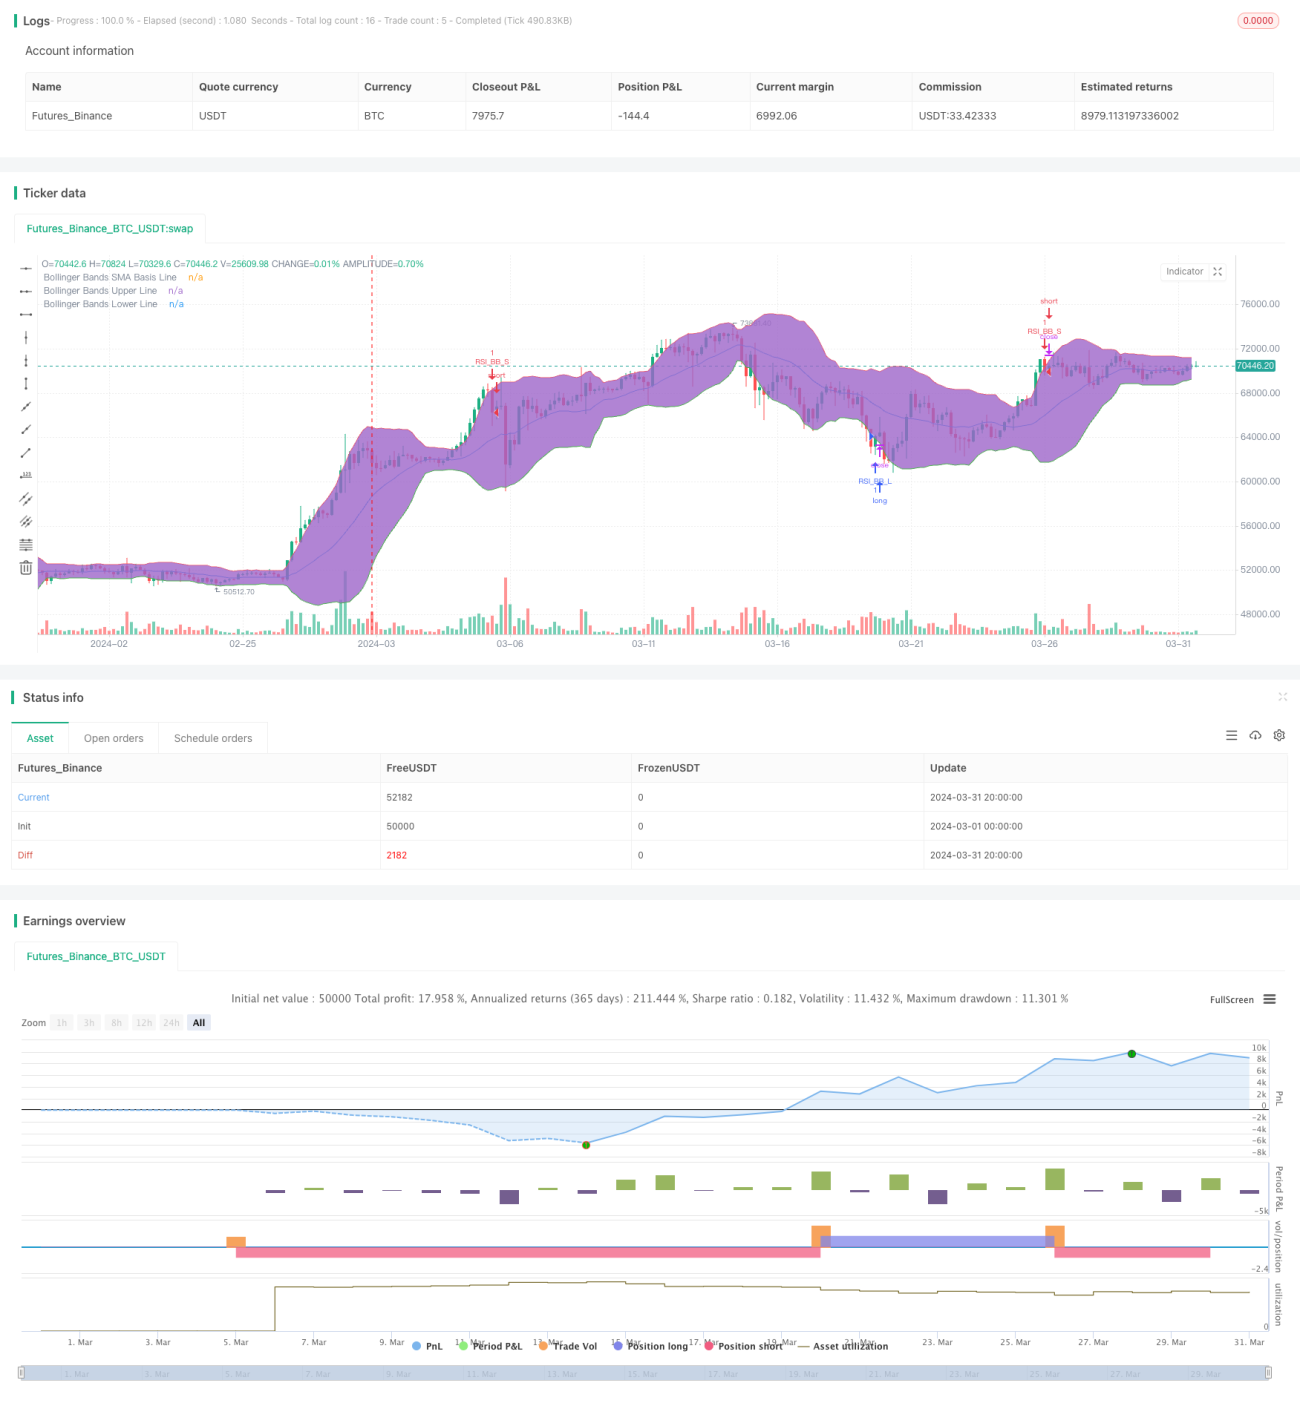
/*backtest
start: 2024-03-01 00:00:00
end: 2024-03-31 23:59:59
period: 4h
basePeriod: 15m
exchanges: [{"eid":"Futures_Binance","currency":"BTC_USDT"}]
*/

//@version=4
strategy("Bollinger + RSI, Double Strategy (by ChartArt) v1.1", shorttitle="CA_-_RSI_Bol_Strat_1.1", overlay=true)

// ChartArt's RSI + Bollinger Bands, Double Strategy - Update- 1