Стратегия получения прибыли с использованием многослойного кроссовера скользящих средних

Обзор
Эта стратегия использует пересечение двух движущихся средних для определения рыночных тенденций, открывая позиции, когда они пересекают долгосрочные движущиеся средние по краткосрочным движущимся средним, и, наоборот, открывая позиции. В то же время, эта стратегия использует многоуровневый метод заканчивания прибыли, когда цены достигают заданного уровня прибыли, и, таким образом, максимизирует прибыль и контролирует риск.
Стратегический принцип
В основе этой стратегии лежит использование движущихся средних различных циклов для захвата рыночных тенденций. Когда краткосрочные движущиеся средние пересекают долгосрочные движущиеся средние, это означает, что рынок может войти в восходящий тренд, и в это время открывается много позиций; когда краткосрочные движущиеся средние пересекают долгосрочные движущиеся средние, это означает, что рынок может войти в нисходящий тренд, и в это время открываются пустые позиции.
Стратегические преимущества
- Простая и эффективная: стратегия основана на классическом принципе пересечения скользящих средних, простая и понятная, и одновременно доказана эффективной на практике.
- Многоуровневый выигрышный конец: путем установки нескольких уровней выигрыша и разделения на серии погашений, когда цена достигает этих уровней, можно максимизировать прибыль, а также контролировать риск.
- Гибкость параметров: параметры этой стратегии очень гибки, пользователи могут адаптировать циклы и уровни прибыли для достижения оптимального эффекта в соответствии с их потребностями и рыночными характеристиками.
Стратегический риск
- Риск рыночной волатильности: при резкой волатильности рынка, частое перекрестное сигнализирование может привести к более частым сделкам в стратегии, увеличивая стоимость сделки и риск отзыва.
- Риски параметров: неправильная параметровая настройка может привести к плохой работе стратегии, например, неправильный выбор цикла движущихся средних или необоснованная настройка уровня прибыли.
- Риск распознавания тенденций: стратегия в основном зависит от тенденций, и в случае колебаний рынка или неясности тенденций может быть больше ложных сигналов, что приводит к убыткам.
Направление оптимизации стратегии
- Комбинирование с другими индикаторами: можно рассмотреть возможность комбинирования с другими техническими индикаторами, такими как RSI, MACD и т. д., чтобы повысить точность и надежность определения тенденций.
- Оптимизирующие параметры: можно отслеживать и оптимизировать, чтобы найти оптимальный цикл скользящих средних и параметры уровня прибыли, чтобы адаптироваться к различным рыночным условиям.
- Добавление стоп-убытков: можно рассмотреть возможность добавления стоп-механизмов для дальнейшего контроля риска, например, динамического стоп-убытков в соответствии с настройками ATR и т. д.
- Изменение входа и выхода: можно исследовать дополнительные условия входа и выхода, такие как учет объема торгов, поддерживающего сопротивления и т. Д., Чтобы повысить устойчивость стратегии.
Подвести итог
Стратегия пересечения скопления скопления скопления скопления скопления скопления скопления скопления скопления скопления скопления скопления скопления скопления скопления скопления скопления скопления скопления скопления скопления скопления скопления скопления скопления скопления скопления скопления скопления скопления скопления скопления скопления скопления скопления скопления скопления скопления скопления скопления скопления скопления скопления скопления скопления скопления скопления скопления скопления скопления скопления скопления скопления скопления скопления скопления скопления скопления скопления скопления скопления скопления скопления скопления скопления скопления скопления скопления скопления скопления скопления скопления скопления скопления скопления скопления скопления скопления скопления скопления скопления скопления скопления ско
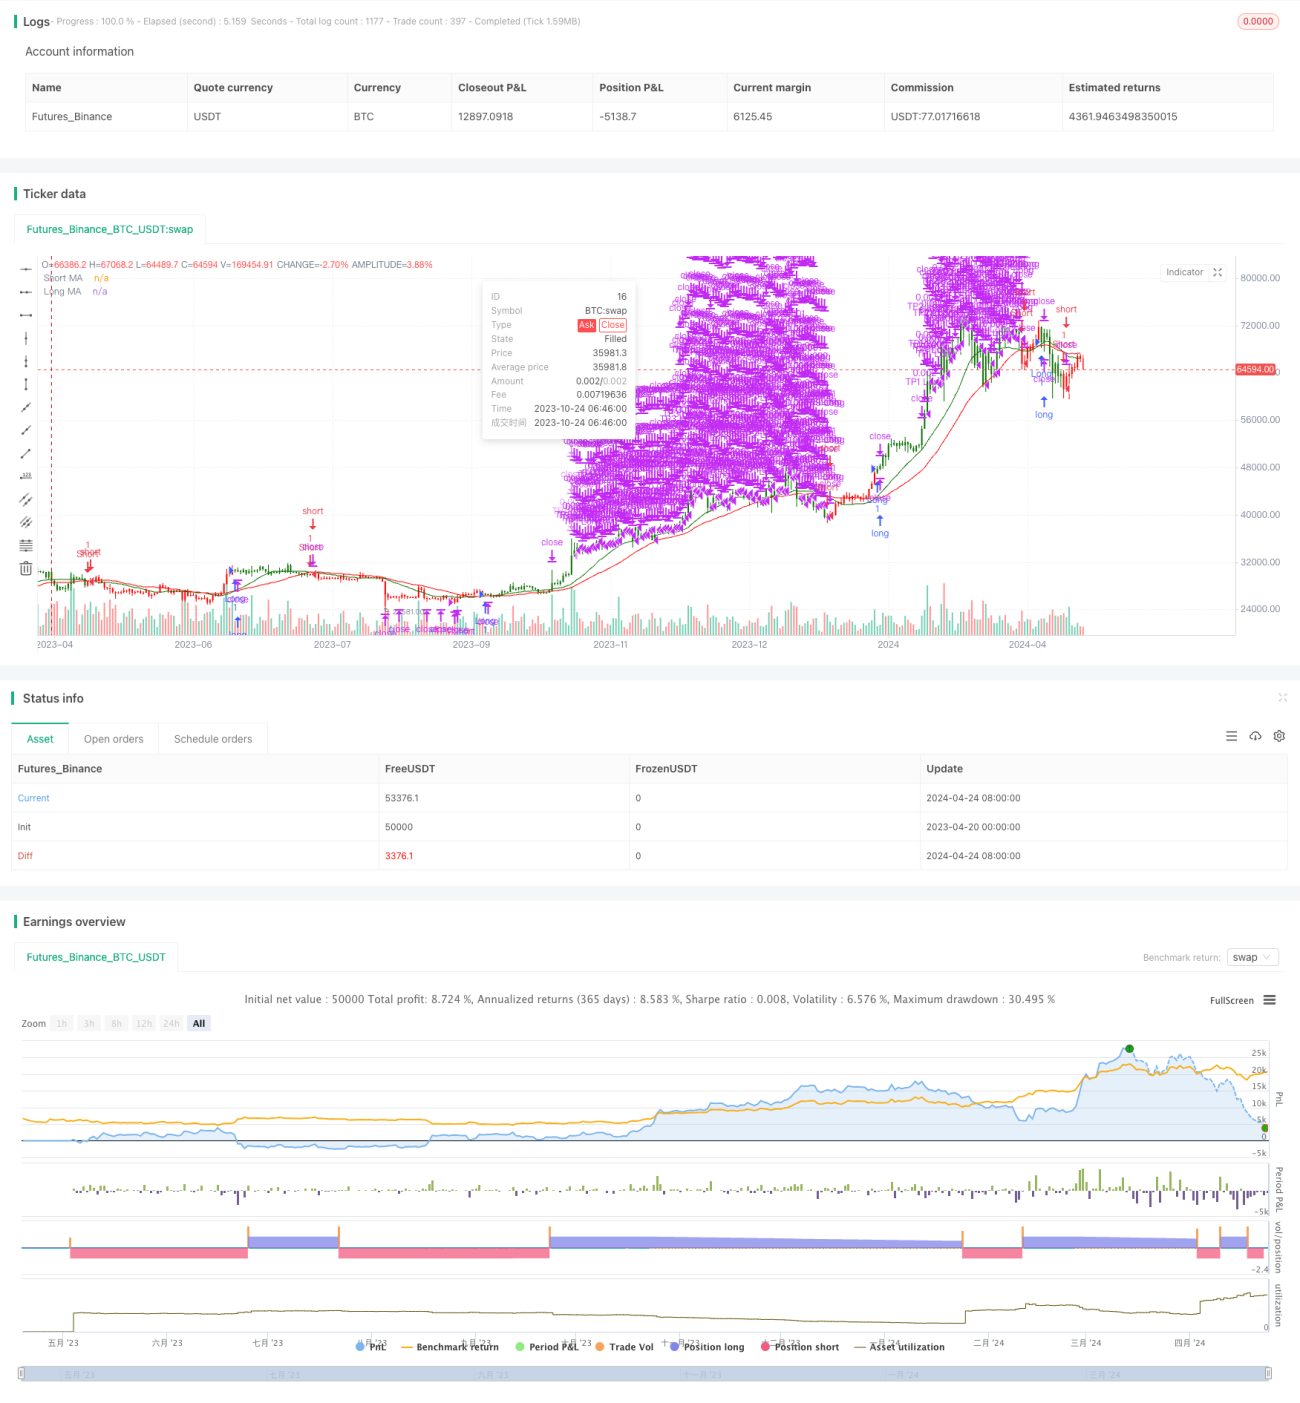
/*backtest
start: 2023-04-20 00:00:00
end: 2024-04-25 00:00:00
period: 1d
basePeriod: 1h
exchanges: [{"eid":"Futures_Binance","currency":"BTC_USDT"}]
*/

// This Pine Script™ code is subject to the terms of the Mozilla Public License 2.0 at https://mozilla.org/MPL/2.0/
// © ValdesTradingBots

//Follow Us for More Insights and Updates!- 1