Стратегия следования за трендом на основе Z-оценки

Обзор
"Стратегия отслеживания трендов на основе Z-значений" использует статистический показатель Z-значений для захвата трендовых возможностей, измеряя отклонение цен от их движущихся средних и используя стандартное расхождение в качестве унифицированной шкалы. Эта стратегия известна своей простотой и эффективностью, особенно для рынков, где ценовые движения часто возвращаются к равновесию. В отличие от сложных систем, которые зависят от нескольких показателей, "Стратегия отслеживания трендов на основе Z-значений" фокусируется на четких, статистически значимых ценовых изменениях и идеально подходит для трейдеров, которые предпочитают простые, управляемые данными методы.
Стратегический принцип
В основе этой стратегии лежит вычисление Z-значений. Z-значения могут быть получены путем вычисления разницы между текущей ценой и пользовательски определенной длиной Price Index Moving Average (PIA) (EMA) и деления разницы на ценовые стандарты той же длины:
z = (x - μ) / σ
где x - текущая цена, μ - средняя величина EMA, σ - стандартная разница.
Торговые сигналы генерируются на основе Z-значений, пересекающих заданные пороговые значения:
- Многоголовый вход: когда Z-значение пересекает положительную границу.
- Многоглавое выступление: когда Z-значение пересекает отрицательный порог.
- Вход с пустой головой: когда Z-значение пересекает отрицательный порог.
- Появление головой: когда Z-значение пересекает положительную границу.
Стратегические преимущества
- Простая и эффективная: стратегия, основанная на небольшом количестве параметров, легко понятна и реализуется, и одновременно эффективна в поимке трендовых возможностей.
- Статистические основы: Z-значения как проверенный статистический инструмент, обеспечивающий прочную теоретическую основу для этой стратегии.
- Гибкость: стратегия может гибко адаптироваться к различным стилям торговли и рыночным условиям путем корректировки параметров, таких как отклонения, ЭМА и циклы расчета стандартной разницы.
- Ясные сигналы: торговые сигналы, основанные на пересечении Z-значений, просты и ясны, что способствует быстрому принятию решений и исполнению.
Стратегический риск
- Чувствительные параметры: неправильная настройка параметров (например, слишком высокий или слишком низкий порог) может привести к искажению торговых сигналов, упущенным возможностям или убыткам.
- Определение трендов: при колебаниях или рыночной реструктуризации стратегия может столкнуться с частыми ложными сигналами и плохо работать.
- Эффект задержки: в качестве стратегии отслеживания тенденций, сигналы входа и выхода имеют определенную задержку и могут упустить лучший момент.
Вышеуказанные риски могут быть контролированы и смягчены с помощью постоянного анализа рынка, оптимизации параметров и осторожной реализации на основе обратной оценки.
Направление оптимизации стратегии
- Динамические пороги: внедрение динамических порогов, связанных с волатильностью, которые могут эффективно адаптироваться к различным состояниям рынка, повышая качество сигнала.
- Комбинированные индикаторы: объединение других технических индикаторов, таких как RSI, MACD и т. Д., для вторичного подтверждения торговых сигналов, повышения надежности.
- Управление позициями: включение механизмов контроля позиций, таких как ATR, своевременное снижение позиций в волатильных рынках, своевременное увеличение позиций в трендовых рынках, оптимизация доходности и риска.
- Многовременные масштабы: Z-значения рассчитываются в разных временных масштабах, чтобы зафиксировать тенденции на разных уровнях и обогатить стратегические измерения.
Подвести итог
"Стратегия отслеживания трендов на основе Z-значений" благодаря своей простоте, устойчивости и гибкости предоставляет уникальный взгляд на возможность захвата трендовых возможностей. С помощью разумной настройки параметров, тщательного управления рисками и постоянной оптимизации эта стратегия может стать полезным помощником для количественных трейдеров, чтобы прочно продвигаться в изменчивых рынках.
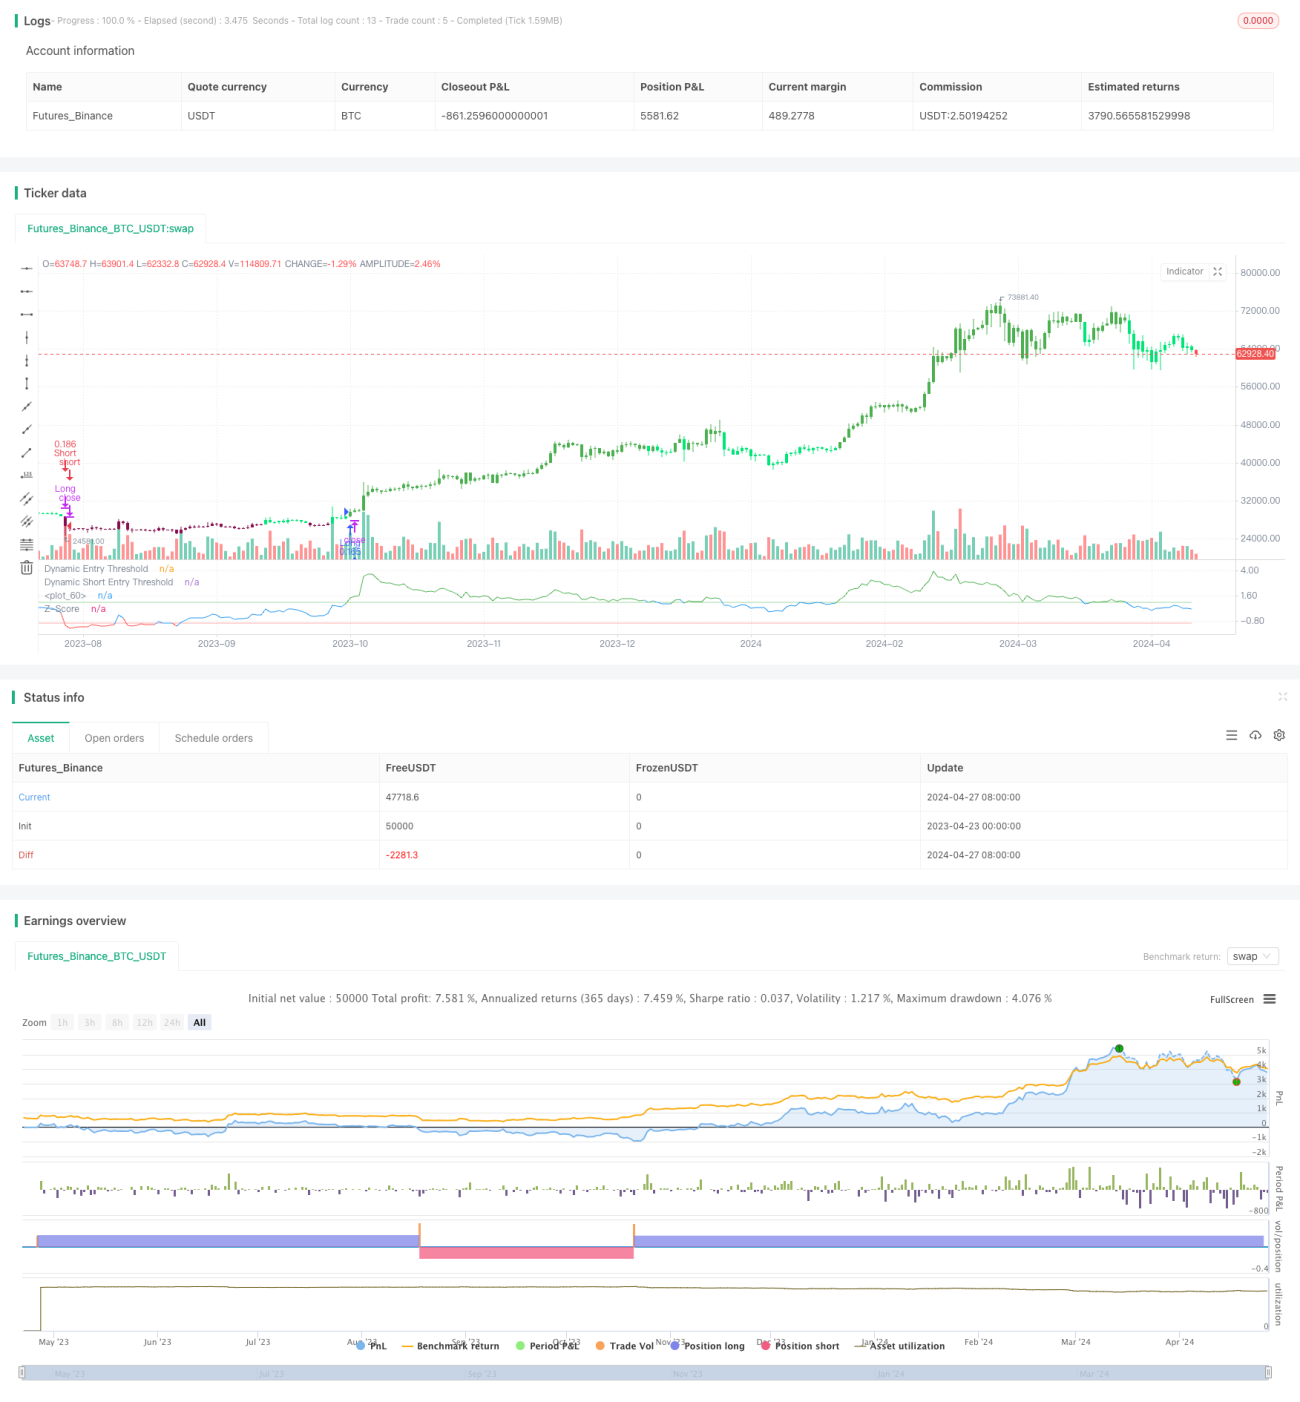
/*backtest
start: 2023-04-23 00:00:00
end: 2024-04-28 00:00:00
period: 1d
basePeriod: 1h
exchanges: [{"eid":"Futures_Binance","currency":"BTC_USDT"}]
*/

// This Pine Script™ code is subject to the terms of the Mozilla Public License 2.0 at https://mozilla.org/MPL/2.0/
// © PresentTrading

// This strategy employs a statistical approach by using a Z-score, which measures the deviation of the price from its moving average normalized by the standard deviation.- 1