Стратегия количественной торговли относительной нереализованной прибыли EMA100 и NUPL

Обзор
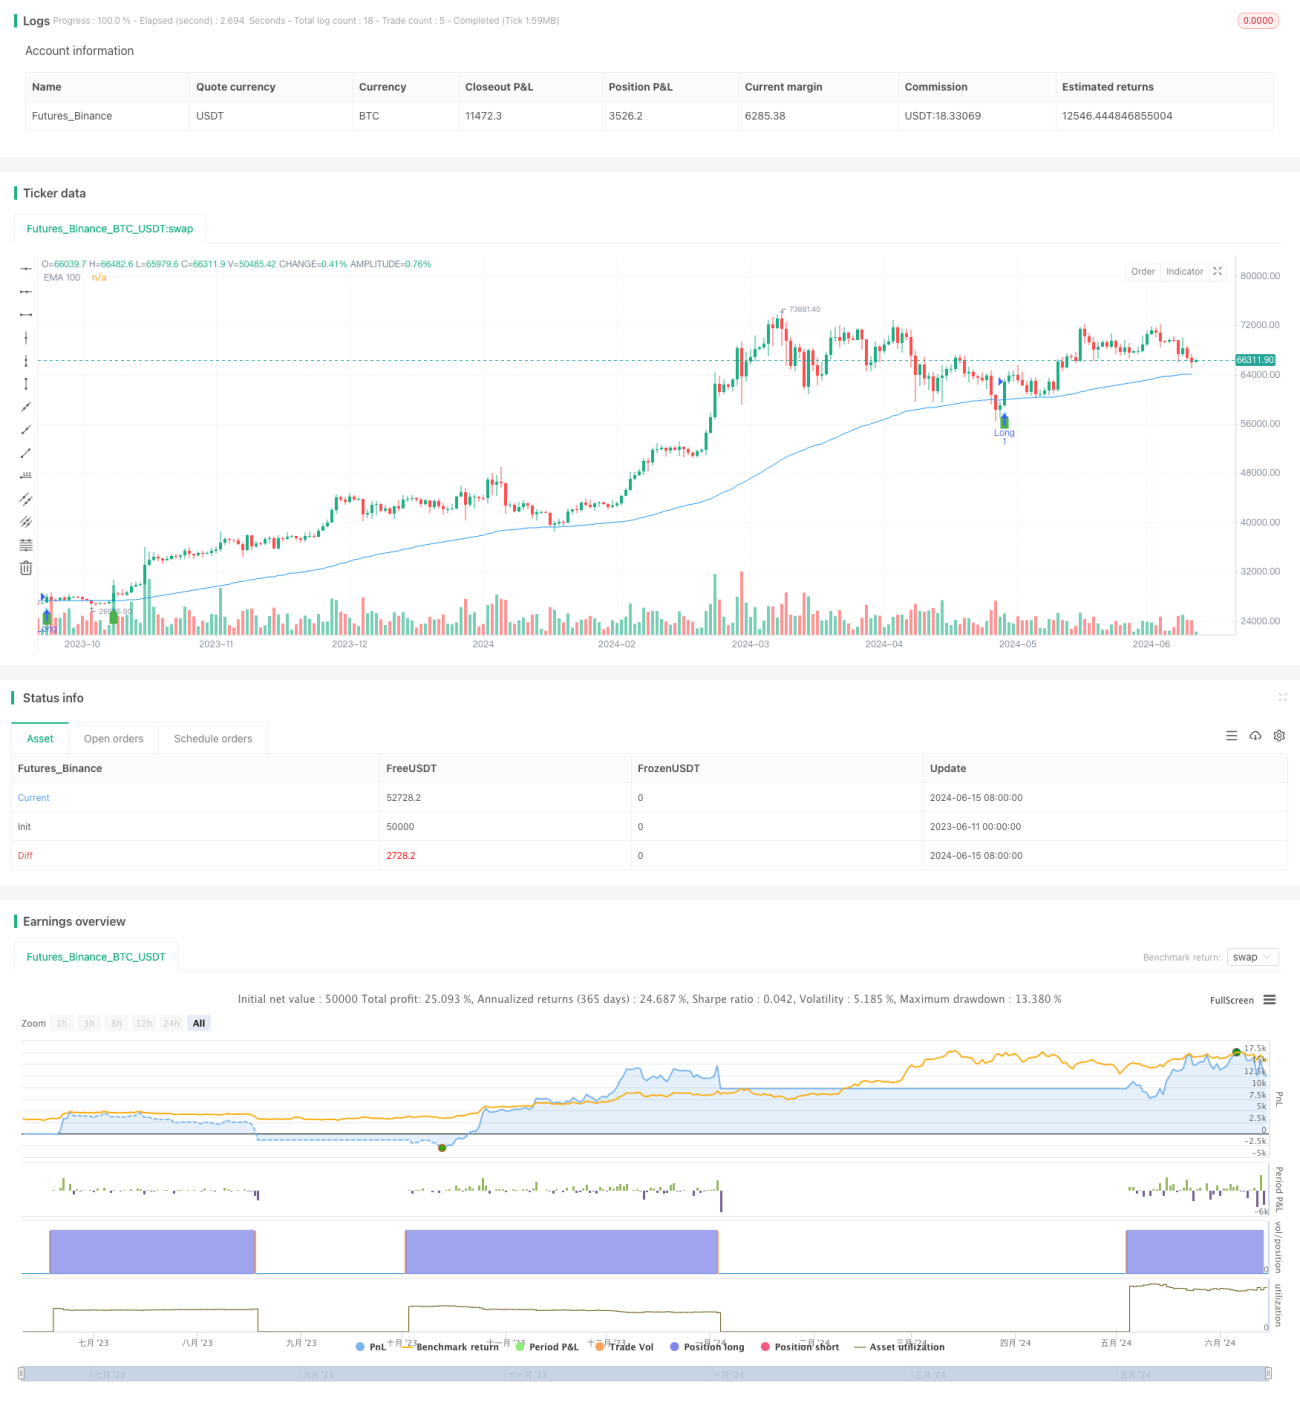
Торговая стратегия, основанная на трех показателях: 100-циклической скользящей средней индексной величины (EMA100), чистой нереализованной прибыли/убытка (NUPL) и относительно нереализованной прибыли, генерирует торговый сигнал, оценивая пересечение цены с EMA100 и положительное отрицание NUPL и относительно нереализованной прибыли. Многосигналы вызываются, когда цена пересекает EMA100, а NUPL и относительно нереализованная прибыль являются положительными; пустые сигналы вызываются, когда цена пересекает EMA100, а NUPL и относительно нереализованная прибыль являются отрицательными.
Стратегический принцип
- Вычисление 100-циклической ЭМА в качестве основного индикатора тенденции
- Использование NUPL и относительной нереализованной прибыли в качестве вспомогательных показателей для подтверждения силы и устойчивости тенденции
- В то же время, когда цена проходит через EMA100 вверх/вниз, NUPL и относительно неиспользованная прибыль одновременно генерируют сигналы о повышении/понижении при положительном/отрицательном времени
- Применение 10% фиксированной позиции и установка 10% стоп-лосса, контроль риска
- При владении позицией сверх залога, если цена опустится выше ценой остановки убытка, ликвидируется позиция сверх залога; при владении позицией сверх залога, если цена опустится выше ценой остановки убытка, ликвидируется позиция сверх залога
Анализ преимуществ
- Простая и понятная: стратегия имеет четкую логику, использует распространенные технические показатели, легко понимается и реализуется
- Тренд-трекер: с помощью EMA100 захватывает основные тренды, подходящие для использования на трендовых рынках
- Управление рисками: установка фиксированных позиций и остановок для эффективного управления рисками
- Адаптируемость: стратегия может применяться к различным рынкам и торговым показателям
Анализ рисков
- Фальшивые сигналы: в условиях волатильности рынка, частое перекрещение цены с EMA100 может привести к большему количеству фальшивых сигналов, что приводит к убыткам
- Отсталость: EMA как отсталый показатель, который может быть медленным в реакции при переходе тенденции, упуская лучший момент входа
- Оптимизация параметров: параметры стратегии (например, циклы EMA, размер позиции, коэффициент остановки) должны быть оптимизированы в зависимости от рынка, а неправильные параметры могут привести к неэффективности стратегии
Направление оптимизации
- Оптимизация параметров: оптимизация параметров, таких как циклы EMA, размер позиции и стоп-роль, для улучшения эффективности стратегии
- Фильтрационные сигналы: добавление других технических показателей или показателей рыночных настроений, фильтрация ложных сигналов
- Управление динамическими позициями: динамическая корректировка позиций в зависимости от рыночных колебаний, убытков счетов и других факторов, повышение прибыли и контроль риска
- Многофункциональный портфель: одновременное владение многоглавными и пустыми позициями, хеджирование рыночных рисков, повышение стабильности стратегии
Подвести итог
Эта торговая стратегия генерирует торговые сигналы с помощью EMA100, NUPL и трех показателей относительной нереализованной прибыли. Она обладает такими преимуществами, как логическая ясность, управляемая опасность и высокая адаптивность. В то же время существуют риски, такие как ложные сигналы, задержка и оптимизация параметров. В будущем стратегия может быть оптимизирована и улучшена с помощью оптимизации параметров, фильтрации сигналов, динамического управления позициями и многогабаритной комбинации.
- 1