
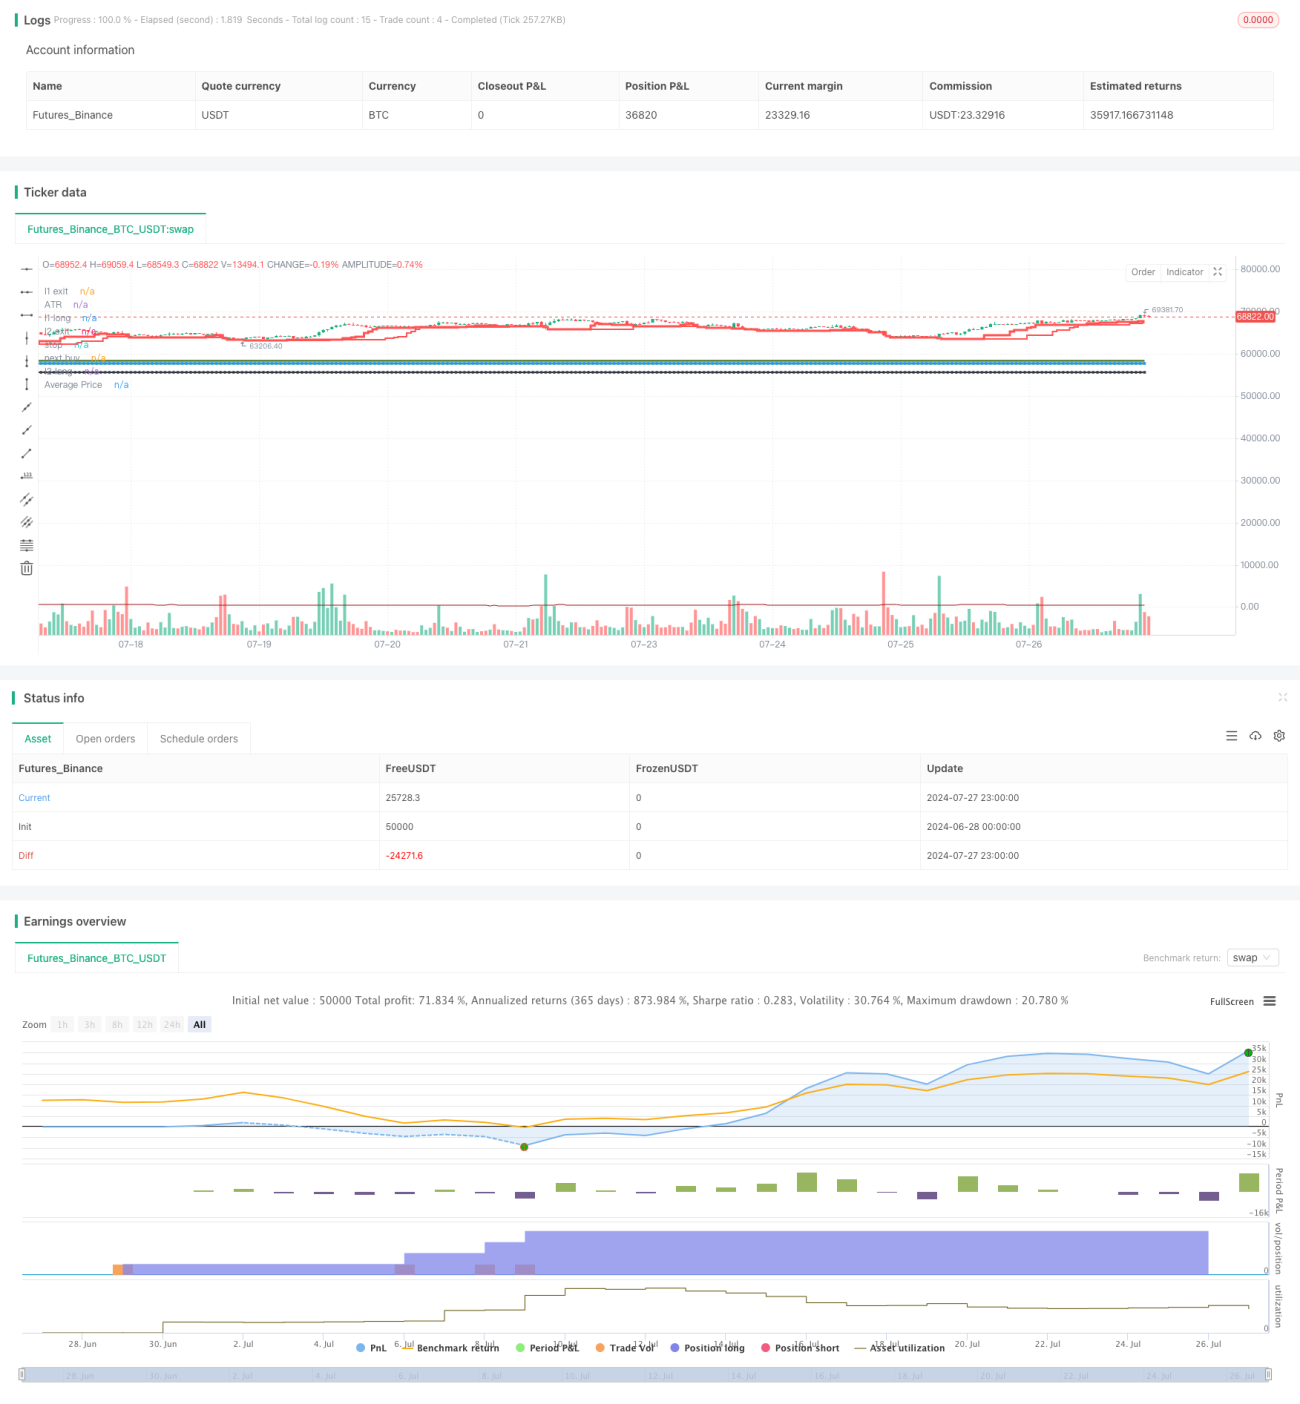
Многоуровневая динамическая система слежения за трендом - это улучшенная стратегия, основанная на законах торговли в море. Эта стратегия использует сигналы тренда в течение нескольких временных циклов, в сочетании с динамическими стопами и пирамидальными пополнениями, чтобы получить доступ к средне- и долгосрочным тенденциям. Система захватывает тенденции с разной скоростью, настраивая два цикла слежения за трендом (L1 и L2) и используя адаптированные показатели ATR для динамической корректировки позиций входа, пополнения и остановки.
Идентификация тенденций: используйте два цикла скользящих средних (L1 и L2) для идентификации тенденций с разной скоростью. L1 используется для захвата быстрых тенденций, L2 - для захвата медленных, но более надежных тенденций.
Входный сигнал: когда цена прорывает высокие точки L1 или L2, создается многосигнал. Если последняя сделка L1 была прибыльной, то пропускается следующий сигнал L1 до появления сигнала L2.
Динамический стоп: используйте кратность ATR (в 3 раза по умолчанию) в качестве начального стоп-диапазона, который постепенно повышается с увеличением времени удержания позиции.
Пирамида: в процессе продолжения тренда, каждый раз, когда цена повышается на 0,5 ATR, происходит пополнение позиций, максимум 5 раз.
Контроль риска: риск каждой сделки не превышает 2% от чистой стоимости счета, что достигается путем динамического расчета объема позиций.
Механизм выхода: закрытие позиции при падении цены до 10-дневного минимума (L1) или 20-дневного минимума (L2) или при нажатии движущейся стоп-линии.
Многоуровневое улавливание тенденций: с помощью двух циклов L1 и L2 можно улавливать как быстрые, так и долгосрочные тенденции, повышая адаптивность и стабильность стратегии.
Динамическое управление рисками: использование ATR в качестве индикатора волатильности позволяет динамично корректировать позиции входа, остановки убытков и наращивания позиций, чтобы лучше адаптироваться к изменениям рынка.
Пирамида: постепенное наращивание позиций по мере продолжения тренда, чтобы контролировать риски и максимизировать потенциал прибыли.
Гибкая параметровая настройка: несколько регулируемых параметров позволяют стратегии адаптироваться к различным рынкам и стилям торговли.
Автоматизированное исполнение: стратегия может быть полностью автоматизирована, сокращая человеческое вмешательство и эмоциональное воздействие.
Риск обратного тренда: отличная производительность на рынке с сильной тенденцией, но частота торговли может привести к убыткам на рынке с потрясением.
Скидки и расходы на торговлю: Частые пополнения и перемещение стоп-лосса могут привести к более высоким расходам на торговлю.
Риск чрезмерной оптимизации: многочисленные параметры могут привести к чрезмерному сопоставлению исторических данных.
Риск управления капиталом: если начальный капитал небольшой, то может быть неэффективно осуществить многократное пополнение запасов.
Риск ликвидности рынка: в рынках с низкой ликвидностью может быть трудно совершить сделку по идеальной цене.
Введение фильтра рыночной конъюнктуры: можно добавить индикатор интенсивности тренда (например, ADX) для оценки рыночной конъюнктуры, уменьшить частоту торговли на колеблющихся рынках.
Оптимизация стратегии повышения: можно рассматривать возможность динамического регулирования интервала и частоты повышений в зависимости от интенсивности тренда, а не фиксированного 0.5ATR и 5 раз.
Введение стоп-механизма: в долгосрочной тенденции можно установить частичный стоп-механизм для блокирования прибыли, например, при достижении прибыли в 3 раза выше ATR, чтобы погасить половину позиции.
Анализ взаимосвязи между разновидностями: при применении комбинации можно добавить анализ взаимосвязи между разновидностями для оптимизации соотношения риска и прибыли.
Включение фильтра волатильности: в период чрезвычайно высокой волатильности можно приостановить торговлю или скорректировать параметры риска в ответ на аномальные рынки.
Оптимизация механизмов выхода: можно рассмотреть возможность использования более гибких показателей выхода, таких как параболический SAR или Chandelier Exit.
Многоуровневая динамическая система слежения за трендом - это комплексная стратегия, которая сочетает в себе классические правила трейдинга в море и современные количественные технологии. Благодаря многоуровневому выявлению тенденций, динамическому управлению рисками и таким методам, как пирамида, стратегия повышает способность удерживать тенденции и потенциал прибыли, сохраняя при этом устойчивость. Хотя она сталкивается с проблемами на волатильных рынках, она может быть стабильной в различных рыночных условиях с помощью разумной оптимизации параметров и контроля риска.
/*backtest
start: 2024-06-28 00:00:00
end: 2024-07-28 00:00:00
period: 1h
basePeriod: 15m
exchanges: [{"eid":"Futures_Binance","currency":"BTC_USDT"}]
*/
//@version=5
// This is a strategy based on the famous turtle system.
// https://www.tradingblox.com/originalturtles/originalturtlerules.htm
//
// In a nutshell, it a trend trading system where you are buying on strength, selling on weakness.
// positions should be entered when the price crosses over the 20-day high (L1 high) or 55-day high (L2 high).
// positions should be exited when the prices crosses below the 10-day low (L1 low) or 20-day low (L2 low)
// you can add positions at every unit (measured by multiple of n, where n=1 ATR)
// stops should be placed at 2*n below every position entered, when the stop is hit exit your entire position.
// positions should be entered everytime price crosses over L1 or L2, with one exception:
// if the last trade was an L1 trade and it was a winning trade, skip the next trade unless the price crosses
// over L2, if that is the case, you should take it.
// L1 and L2 levels are also configurable for high and lows.
// N multiple for stops and pyramid are also configurable
// To change this from a strategy to a study:
// 1) uncomment the next line and comment out the strategy line.
// 2) at the end of the file comment out the last 2 lines
// study(title="Turtle Study", overlay=true)
strategy(title='kTF-VNI', overlay=true, initial_capital=100000000, commission_type=strategy.commission.percent, commission_value=0.0, pyramiding=100, process_orders_on_close=true, calc_on_every_tick=true)
stopInput = input.float(3, 'Stop N', step=.05)
riskPercent = input.float(.01, 'Risk % of capital', step=.005)
pyramidInput = input.float(0.5, 'Pyramid N', step=.05)
maxUnits = input.int(5, 'Max Pyramid Units', step=1)
atrPeriod = input(20, 'ATR period')
l1LongInput = 10
l2LongInput = 20
l1LongExitInput = 20
l2LongExitInput = 40
l1LongInput := input.int(20, 'L1 Long', minval=2)
l2LongInput := input.int(60, 'L2 Long', minval=2)
l1LongExitInput := input.int(10, 'L1 Long Exit', minval=2)
l2LongExitInput := input.int(20, 'L2 Long Exit', minval=2)
FromYear = input.int(1970, 'From Year', minval=1900)
FromMonth = input.int(1, 'From Month', minval=1, maxval=12)
FromDay = input.int(1, 'From Day', minval=1, maxval=31)
ToYear = input.int(9999, 'To Year', minval=1900)
ToMonth = input.int(1, 'To Month', minval=1, maxval=12)
ToDay = input.int(1, 'To Day', minval=1, maxval=31)
FromDate = timestamp(FromYear, FromMonth, FromDay, 00, 00)
ToDate = timestamp(ToYear, ToMonth, ToDay, 23, 59)
TradeDateIsAllowed() =>
time >= FromDate and time <= ToDate
l1Long = ta.highest(l1LongInput)
l1LongExit = ta.lowest(l1LongExitInput)
l2Long = ta.highest(l2LongInput)
l2LongExit = ta.lowest(l2LongExitInput)
bool win = false // tracks if last trade was winning trade of losing trade.
float buyPrice = 0.0 // tracks the buy price of the last long position.
float nextBuyPrice = 0.0 // tracks the next buy price
float stopPrice = na // tracks the stop price
int totalBuys = 0 // tracks the total # of pyramid buys
bool inBuy = false // tracks if we are in a long position or not.
float l1LongPlot = ta.highest(l1LongInput) // tracks the L1 price to display
float l2LongPlot = ta.highest(l2LongInput) // tracks the L2 price to display
float n = ta.atr(atrPeriod) // tracks the n used to calculate stops and pyramid buys
string mode = 'L1' // tracks whether we are in a L1 position or L2 position.
bool fake = na // tracks if this is a fake trade, see comments below.
string longLevel = na // tracks where long positions, stops, pyramid buys occur.
float capitalLeft = strategy.initial_capital
var shares = 0
float fakeBuyPrice = 0.0
// by default use the last value from the previous bar.
buyPrice := buyPrice[1]
totalBuys := totalBuys[1]
nextBuyPrice := nextBuyPrice[1]
stopPrice := stopPrice[1]
win := win[1]
capitalLeft := capitalLeft[1]
inBuy := inBuy[1]
n := ta.atr(atrPeriod)
fakeBuyPrice := fakeBuyPrice[1]
// State to track if we are in a long positon or not.
if not inBuy[1] and (high > l1Long[1] or high > l2Long[1])
inBuy := true
inBuy
else
inBuy := inBuy[1] and low < stopPrice[1] ? false : inBuy
inBuy := inBuy[1] and mode[1] == 'L1' and low < l1LongExit[1] ? false : inBuy
inBuy := inBuy[1] and mode[1] == 'L2' and low < l2LongExit[1] ? false : inBuy
inBuy
// State to track if we are ia a fake trade. If the last trade was a winning, we need to skip the next trade.
// We still track it though as a fake trade (not counted against us). as the outcome determines if we can
// can take the next trade.
if not inBuy[1] and high > l1Long[1] and win[1]
fake := true
fakeBuyPrice := close
fakeBuyPrice
else
fake := fake[1]
fake
if fake[1] and inBuy[1] and not inBuy
fake := false
win := close >= fakeBuyPrice
win
fake := high > l2Long[1] ? false : fake
// Series representing the l1 and l2 levels. If we break out above the l1 or l2 level, we want the
// line to stay at the breakout level, not follow it up.
l1LongPlot := not inBuy[1] or inBuy[1] and mode == 'L1' and fake[1] ? l1Long[1] : l1LongPlot[1]
l2LongPlot := not inBuy[1] or inBuy[1] and mode == 'L1' and fake[1] ? l2Long[1] : l2LongPlot[1]
// Variable in the series is only set when it happens. Possible values is L1, L2, SR
// (stopped out with a loss), SG (exited with a gain), and 'P' for pyramid buy.
longLevel := not inBuy[1] and high > l1Long[1] ? 'L1' : na
longLevel := (not inBuy[1] or inBuy[1] and fake[1]) and high > l2Long[1] ? 'L2' : longLevel
// Either 'L1' or 'L2' depending on what breakout level we are in.
mode := longLevel == na ? mode[1] : longLevel
// Variables to track calculating nextBuyPrice for pyramiding.
if longLevel == 'L1' or longLevel == 'L2'
buyPrice := close
totalBuys := 1
stopPrice := close - stopInput * n
nextBuyPrice := close + pyramidInput * n
nextBuyPrice
// Marks if we hit our next buy price, if so mark it with a 'P'
longLevel := longLevel == na and inBuy[1] and high > nextBuyPrice and TradeDateIsAllowed() and totalBuys < maxUnits ? 'P' : longLevel
if longLevel == 'P'
buyPrice := close
totalBuys := totalBuys[1] + 1
stopPrice := close - stopInput * n
nextBuyPrice := close + pyramidInput * n
nextBuyPrice
// Tracks stops and exits, marking them with SG or SR
longLevel := longLevel == na and inBuy[1] and low < stopPrice and close >= strategy.position_avg_price ? 'SG' : longLevel
longLevel := longLevel == na and inBuy[1] and low < stopPrice and close < strategy.position_avg_price ? 'SR' : longLevel
longLevel := longLevel == na and mode[1] == 'L1' and inBuy[1] and low < l1LongExit[1] and close >= strategy.position_avg_price ? 'SG' : longLevel
longLevel := longLevel == na and mode[1] == 'L2' and inBuy[1] and low < l2LongExit[1] and close >= strategy.position_avg_price ? 'SG' : longLevel
longLevel := longLevel == na and mode[1] == 'L1' and inBuy[1] and low < l1LongExit[1] and close < strategy.position_avg_price ? 'SR' : longLevel
longLevel := longLevel == na and mode[1] == 'L2' and inBuy[1] and low < l2LongExit[1] and close < strategy.position_avg_price ? 'SR' : longLevel
// Tracks if the trade was a win or loss.
win := longLevel == 'SG' ? true : win
win := longLevel == 'SR' ? false : win
// Variables used to tell strategy when to enter/exit trade.
//plotarrow(fake ? 1 : 0, colordown=color.red, colorup=color.purple, transp=40) // down arrow for winning trade
enterLong = (longLevel == 'L1' or longLevel == 'L2' or longLevel == 'P') and not fake and TradeDateIsAllowed()
exitLong = (longLevel == 'SG' or longLevel == 'SR') and not fake and TradeDateIsAllowed()
p1 = plot(l1LongPlot, title='l1 long', linewidth=3, style=plot.style_stepline, color=color.new(color.green, 0))
p2 = plot(l1LongExit[1], title='l1 exit', linewidth=3, style=plot.style_stepline, color=color.new(color.red, 0))
p3 = plot(l2LongPlot, title='l2 long', linewidth=2, style=plot.style_stepline, color=color.new(color.green, 0))
p4 = plot(l2LongExit[1], title='l2 exit', linewidth=2, style=plot.style_stepline, color=color.new(color.red, 0))
color1 = color.new(color.black, 0)
color2 = color.new(color.black, 100)
col = inBuy ? color1 : color2
p5 = plot(stopPrice, title='stop', linewidth=2, style=plot.style_circles, join=true, color=color.new(color.black, 0))
p6 = plot(nextBuyPrice, title='next buy', linewidth=2, style=plot.style_circles, join=true, color=color.new(color.blue, 0))
fill(p1, p3, color=color.new(color.green, 90))
fill(p2, p4, color=color.new(color.red, 90))
risk = (strategy.initial_capital + strategy.netprofit) * riskPercent
shares := math.floor(risk / (stopInput * n))
capitalLeft := strategy.initial_capital + strategy.netprofit - strategy.position_size * strategy.position_avg_price
if shares * close > capitalLeft
shares := math.max(0, math.floor(capitalLeft / close))
shares
shares := math.max(0, shares)
plotshape(longLevel == 'L1' and not fake and strategy.position_size == 0 ? true : false, color=color.new(color.green, 40), style=shape.triangleup, text='L1 ') // up arrow for entering L1 trade
plotshape(not fake[1] and fake and longLevel == 'L1' and strategy.position_size == 0 ? true : false, color=color.new(color.gray, 40), style=shape.triangleup, text='L1') // up arrow for entering L1 trade
plotshape(longLevel == 'L2' and strategy.position_size == 0 ? true : false, color=color.new(color.green, 40), style=shape.triangleup, text='L2') // up arrow for entering L2 trade
plotshape((mode == 'L1' or mode == 'L2') and shares > 0 and enterLong and strategy.position_size > 0 ? true : false, color=color.new(color.green, 40), style=shape.triangleup, text='P')
plotarrow(strategy.position_size == 0 and longLevel == 'L1' and enterLong ? 1 : 0, colordown=color.new(color.black, 40), colorup=color.new(color.green, 40)) // up arrow for entering L1 trade
plotarrow(strategy.position_size == 0 and longLevel == 'L2' and enterLong ? 1 : 0, colordown=color.new(color.black, 40), colorup=color.new(color.green, 40)) // up arrow for entering L2 trade
plotarrow(strategy.position_size > 0 and longLevel == 'SR' and exitLong ? -1 : 0, colordown=color.new(color.red, 40), colorup=color.new(color.purple, 40)) // down arrow for losing trade
plotarrow(strategy.position_size > 0 and longLevel == 'SG' and exitLong ? -1 : 0, colordown=color.new(color.green, 40), colorup=color.new(color.purple, 40)) // down arrow for winning trade
plotshape(longLevel == na and inBuy[1] and not inBuy, color=color.new(color.gray, 40), style=shape.triangleup, text='Exit') // up arrow for entering L1 trade
plot(ta.atr(atrPeriod), title='ATR', color=color.new(#991515, 0))
plot(strategy.position_avg_price, title='Average Price', color=color.new(#991515, 0))
alertcondition(low < stopPrice, title='crosses under stop price', message='price crossed under stop price')
alertcondition(high > l1Long, title='crosses over L1 price', message='price crossed over L1 price')
alertcondition(high > l2Long, title='crosses over L2 price', message='price crossed over L2 price')
alertcondition(low < l1LongExit, title='crosses under L1 exit price', message='price crossed under L1 exit price')
alertcondition(low < l2LongExit, title='crosses under L2 exit price', message='price crossed under L2 exit price')
strategy.entry('long', strategy.long, qty=shares, comment='long', when=enterLong)
strategy.close('long', when=exitLong)
// simulate_amount = 100000
// simulate_risk = simulate_amount*0.005
// simulate_shares = floor(simulate_risk/(n*stopInput))
// plot(simulate_shares, "Shares", color=#991515, transp=0)
// if (enterLong)
// label.new(bar_index, high, text=tostring(simulate), style=label.style_none)