
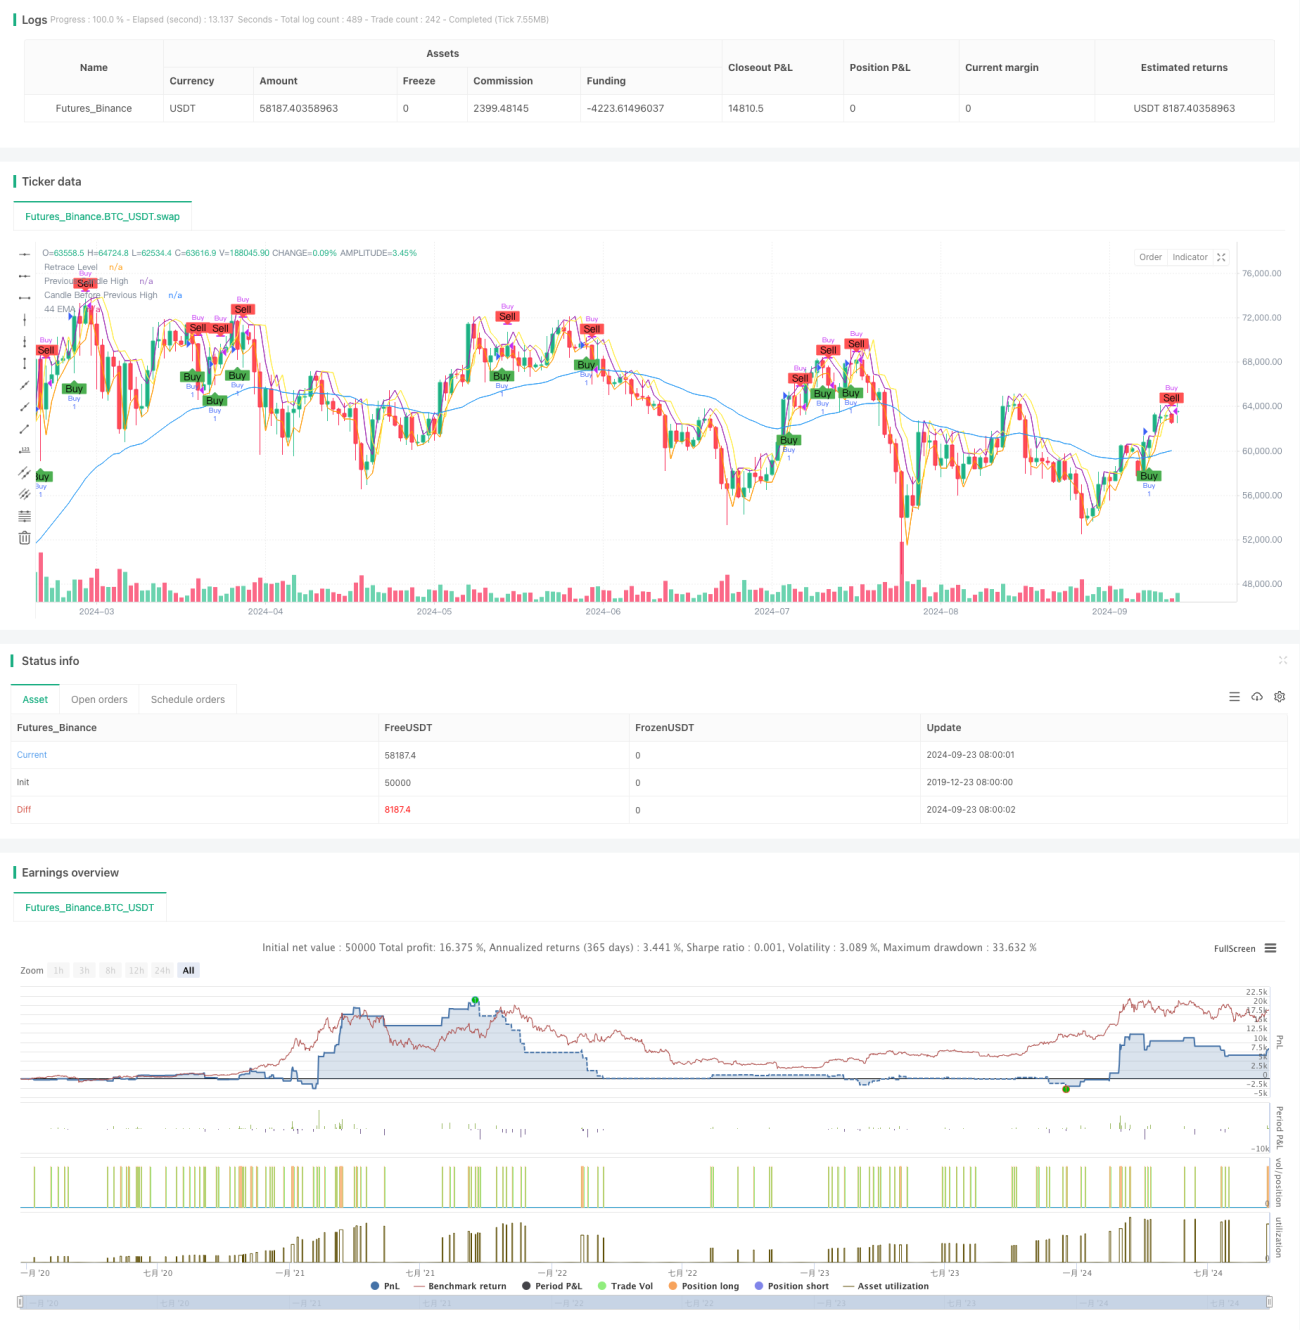
Обзор
Это стратегия для отслеживания трендов, основанная на 44-циклической скользящей средней (EMA). Эта стратегия в основном ищет возможности для покупки в восходящем тренде, чтобы определить время входа, анализируя несколько условий, таких как скольжение EMA, графическая форма и отступление цены. Стратегия разработана для более коротких периодов времени, таких как 2 минуты и 5 минут, и предназначена для захвата торговых возможностей в краткосрочных колебаниях цен.
Стратегический принцип
- Вычислите 44-циклическую ЭМА и ее скольжение, чтобы определить, достаточно ли тенденция наклонена.
- Анализ формы предыдущего столбика требует, чтобы он был солнечным и закрылся выше, чем EMA.
- Наблюдается, отступает ли текущий кристалл до 50% от предыдущего кристалльного объекта.
- Убедитесь, что цена закрытия предыдущего слитка была выше, чем максимальная цена предыдущего слитка, чтобы проверить сохранность восходящей тенденции.
- Когда все условия будут выполнены, открыть позицию на текущей позиции вывода криптовалюты.
- Условия выхода: предыдущая кривая - нижняя или текущая кривая - низкая, предыдущая кривая - низкая.
Стратегические преимущества
- Многократная фильтрация: эффективное снижение ложных сигналов в сочетании с несколькими показателями, такими как EMA, графическая форма и отступление цен.
- Следуйте тренду: используйте EMA, чтобы убедиться, что вы торгуете в явном восходящем тренде, чтобы повысить шансы на победу.
- Возвратный вход: использование ценового возврата в качестве точки входа, оптимизация цены покупки, потенциально повышение прибыли.
- Гибкость: может применяться в разных временных периодах, подходит для коротких линий и внутридневных трейдеров.
- Контроль риска: четкие условия стоп-лосса помогают контролировать риск каждой сделки.
Стратегический риск
- Задержка: EMA, как задержанный показатель, может не реагировать вовремя в условиях сильной волатильности.
- Ложный прорыв: часто может возникать ложный сигнал прорыва в диапазоне поперечного сортировки.
- Слишком много сделок: в условиях высокой волатильности рынка, это может привести к чрезмерному количеству сделок и увеличению их стоимости.
- Быстрое изменение тренда может привести к значительным потерям.
- Чувствительность параметров: эффекты стратегии более чувствительны к параметрам, таким как циклы EMA.
Направление оптимизации стратегии
- Введение дополнительных фильтров, таких как RSI или MACD, для дальнейшего подтверждения силы и направления тренда.
- Динамический стоп: используйте индикатор ATR для установки динамического стопа, чтобы лучше адаптироваться к рыночным колебаниям.
- Увеличение анализа трафика: объединение показателей трафика, повышение надежности входного сигнала.
- Оптимизация циклов EMA: выявление оптимальных комбинаций параметров путем отслеживания различных циклов EMA.
- Добавить индикатор силы тренда: например, ADX, чтобы гарантировать, что вы играете только в сильных тенденциях.
- Улучшенные механизмы выхода из игры: разработан более тонкий подход к выигрышу, такой как "трайлинг стоп".
Подвести итог
Стратегия Gaussian Cross EMA Trend Slider Tracking - это система отслеживания тенденций, объединяющая несколько технических показателей. Поскольку она использует многомерные суждения, такие как EMA, анализ графических форм и ценовое отступление, стратегия имеет большой потенциал для выявления восходящих тенденций и оптимизации времени входа в рынок. Однако пользователям необходимо обратить внимание на контроль риска чрезмерной торговли и оптимизацию параметров для различных рыночных условий.
- 1