Динамическая торговая стратегия на основе Z-счета и супертренда: система переключения длинных и коротких позиций

Обзор
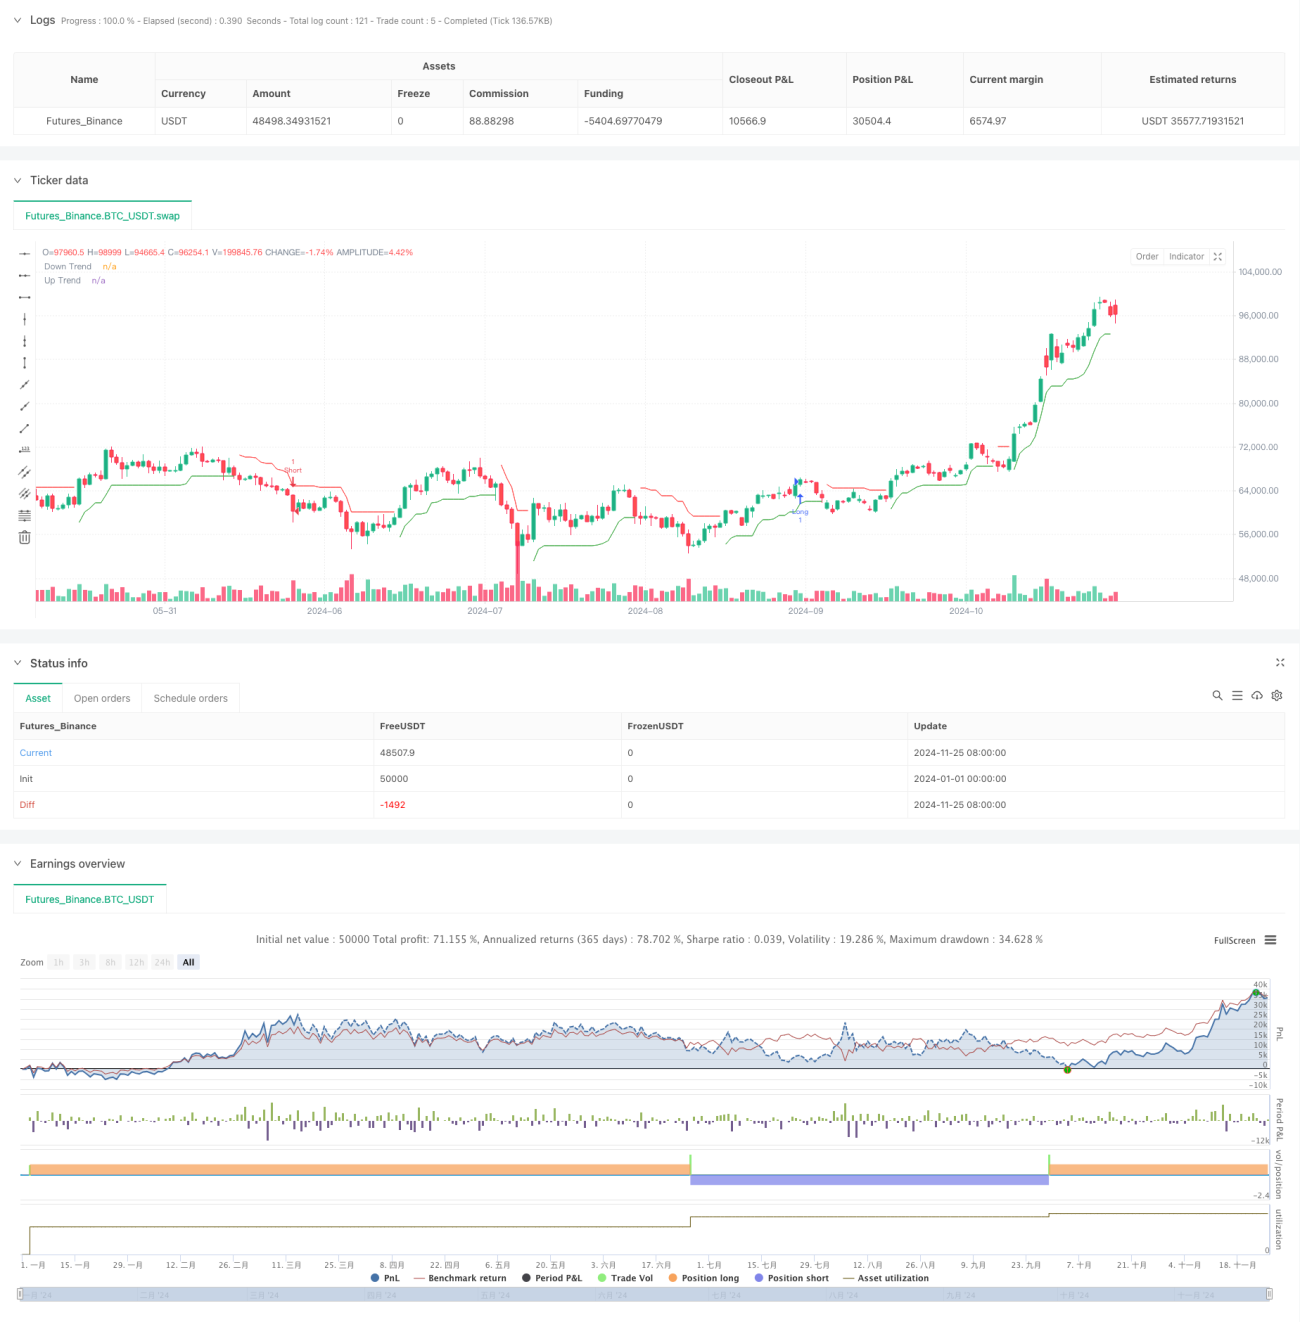
Эта стратегия является количественной торговой системой, которая сочетает в себе статистический метод Z-Score, относительно сильный индикатор RSI и индикатор Supertrend. Стратегия используется для поиска высоковероятных возможностей торговли на рынке путем мониторинга статистической отклонения цен в сочетании с динамическими показателями и подтверждением тенденций.
Стратегический принцип
Центральная логика стратегии основана на взаимодействии трех основных технических показателей: во-первых, измерение отклонения текущей цены от исторического среднего значения путем вычисления Z-скандала цены, в котором используются 75-циклические скользящие средние и стандартное расхождение. Когда Z-скандал превышает 1,1 или ниже -1,1, это указывает на значительное статистическое отклонение цены.
Стратегические преимущества
- Подтверждение множественных сигналов: значительно повышает надежность торговых сигналов, объединяя показатели в трех измерениях статистики, динамики и тенденции.
- Адаптируемость: метод расчета Z-сцены позволяет стратегии адаптироваться к различным рыночным условиям без влияния абсолютных уровней цен.
- Усовершенствованный контроль риска: индикатор супертенденций обеспечивает автоматическое отслеживание тенденций и механизм контроля риска.
- Двусторонние сделки: стратегия позволяет ловить возможности в двух направлениях, повышая эффективность использования средств.
- Сигналы ясны: стратегия использует четкие математические модели и объективные показатели, избегая субъективного суждения.
Стратегический риск
- Риск отставания: из-за использования движущихся средних с несколькими циклами, стратегия может задерживать сигнал на быстро меняющихся рынках.
- Риск ложного прорыва: в криптовалютных рынках часто могут появляться ложные сигналы прорыва.
- Чувствительность к параметрам: эффективность стратегии в значительной степени зависит от выбора параметров, в разных рыночных условиях могут потребоваться различные параметры.
- Зависимость от рыночных условий: в рынках, где тенденция не очевидна, эффективность стратегии может быть недостаточно высокой.
Направление оптимизации стратегии
- Динамическая корректировка параметров: можно ввести механизм адаптивных параметров, автоматически корректирующих параметры Z-оценочных понижений и супертенденций в зависимости от волатильности рынка.
- Добавление фильтрации рыночной среды: добавление модуля идентификации рыночной среды, использующего различные комбинации параметров в различных рыночных условиях.
- Совершенствование механизмов остановки убытков: внедрение динамических стратегий остановки убытков, таких как остановка на основе ATR или отслеживание остановки убытков.
- Оптимизация фильтрации сигналов: можно добавить подтверждение количества сделок или другие технические показатели для дальнейшей фильтрации торговых сигналов.
- Внедрение временных фильтров: рассмотрите возможность увеличения ограничений на время торгового окна и избегайте периодов с большой волатильностью.
Подвести итог
Это количественная торговая стратегия, объединяющая статистические методы и технический анализ, для повышения надежности торгов с помощью подтверждения множества сигналов. Основные преимущества стратегии заключаются в ее объективных математических моделях и совершенных механизмах контроля риска, но в то же время необходимо обратить внимание на вопросы оптимизации параметров и адаптации рынка.
- 1