Стратегия ложного прорыва поддержки множественных скользящих средних в сочетании с системой стоп-лосс ATR

Обзор
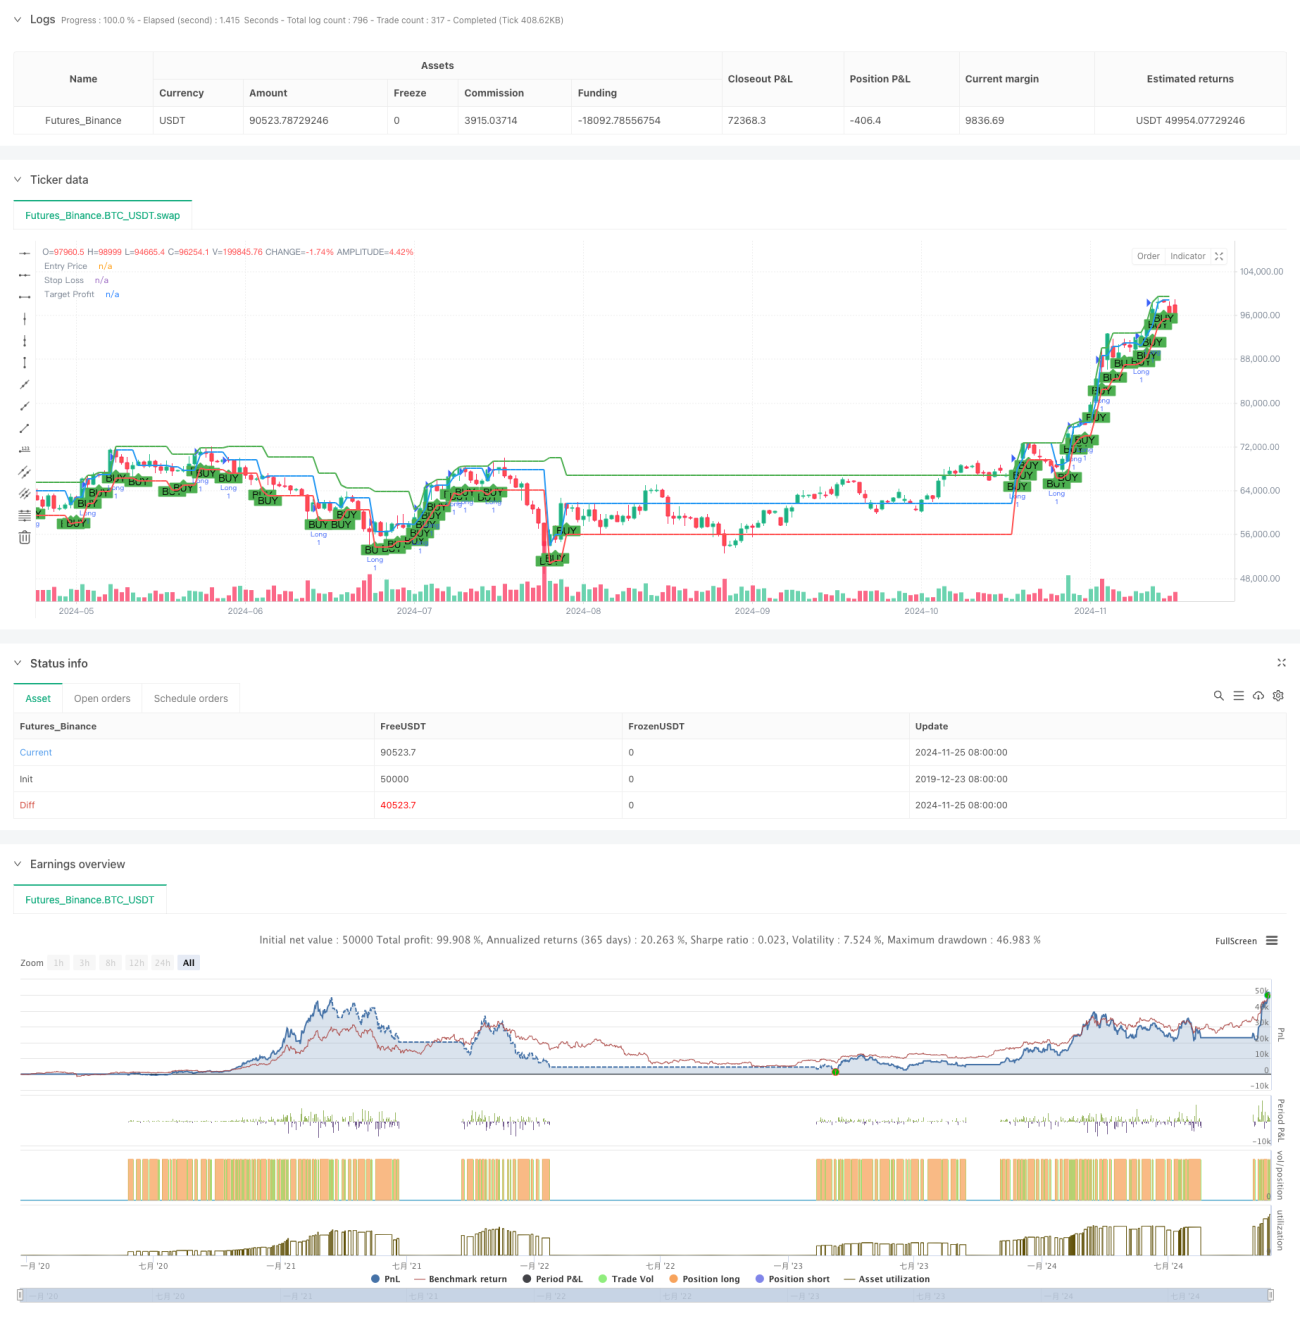
Стратегия является торговой системой, основанной на выявлении равнолинейных трендов и ложных прорывов в поддержке. Стратегия определяет рыночные тенденции с помощью 50-циклических и 200-циклических простых движущихся средних, создает торговый сигнал в сочетании с ложными форматами прорывов в поддержке и использует ATR (средняя реальная волновая amplitude) для динамического установления стоп-позиции, устанавливая цель получения прибыли в точке прорыва.
Стратегический принцип
Основная логика стратегии включает в себя следующие ключевые элементы:
- Определение тренда: использование позиционных отношений 50-циклической и 200-циклической средних линий для определения тренда рынка, подтверждение восходящего тренда, когда краткосрочная средняя линия находится над долгосрочной средней линией.
- Поддержка рассчитывается с помощью формулы опорных точек, используя средневзвешенные значения максимальных, минимальных и закрытых цен предыдущего периода.
- Ложное подтверждение прорыва: когда цена в восходящем тренде, после кратковременного падения поддержания, закрывается выше поддержания, образуется полисигнал.
- Управление рисками: используйте 14-циклический ATR для расчета динамических стоп-позиций, чтобы обеспечить расширение стоп-диапазона при усилении волатильности рынка.
- Цель прибыли: обеспечение достаточного пространства для прибыли путем расчета максимальной цены за первые 10 циклов в качестве цели прибыли.
Стратегические преимущества
- Следование тренду: стратегия, использующая систему равнолинейной торговли, чтобы обеспечить торговлю в направлении основного тренда и повысить шансы на победу.
- Динамический контроль риска: используется ATR для динамического регулирования стоп-позиции в зависимости от рыночной ситуации.
- Ясные торговые сигналы: поддержка фальшивых форм прорыва с четкими критериями суждения, уменьшение субъективного суждения.
- Разумный коэффициент риска к прибыли: обеспечить хороший коэффициент риска к прибыли, установив динамические стоп-лоры и целевые показатели прибыли на основе исторических максимумов.
- Систематизированная работа: четкая логика стратегии, простая реализация в программе и обратная проверка.
Стратегический риск
- Риск ложного сигнала: в условиях волатильности рынка может возникнуть больше ложных сигналов прорыва, увеличивающих стоимость торгов.
- Риск поворота тренда: медленная реакция среднелинейной системы в точке поворота тренда может привести к задержке времени входа.
- Риск остановки: остановка ATR может привести к большим потерям при резком увеличении колебаний.
- Риск по установлению целевой прибыли: исторические максимумы фиксированного цикла могут не точно отражать текущие рыночные условия.
Направление оптимизации стратегии
- Добавление фильтрационных условий: можно добавить индикатор подтверждения загрузки, повышая надежность сигнала.
- Оптимизация параметров средней линии: адаптация средней линии к различным рыночным характеристикам для повышения точности определения тенденций.
- Улучшенные методы остановки убытков: может быть установлена комплексная остановка в сочетании с позицией поддержки, повышая эффективность остановки убытков.
- Динамичные целевые показатели: внедрение динамичных методов расчета целевых показателей, чтобы лучше адаптироваться к изменениям рынка.
- Добавление фильтрации по времени: добавление фильтрации по временным окнам торговли, чтобы избежать торговли в неблагоприятное время.
Подвести итог
Стратегия многократного прорыва в устойчивости к устойчивости к устойчивости к устойчивости к устойчивости к устойчивости к устойчивости к устойчивости к устойчивости к устойчивости к устойчивости к устойчивости к устойчивости к устойчивости к устойчивости к устойчивости к устойчивости к устойчивости к устойчивости к устойчивости к устойчивости к устойчивости к устойчивости к устойчивости к устойчивости к устойчивости к устойчивости к устойчивости к устойчивости к устойчивости к устойчивости к устойчивости к устойчивости к устойчивости к устойчивости к устойчивости к устойчивости к устойчивости к устойчивости к устойчивости к устойчивости к устойчивости к устойчивости к устойчивости к устойчивости к устойчивости к устойчивости к устойчивости к устойчивости к у
- 1