
Обзор
Стратегия представляет собой количественную торговую систему, которая сочетает в себе Bollinger Bands, относительно сильные индикаторы RSI и динамические средние затраты DCA. Стратегия автоматически выполняет операции по созданию позиций в рыночных волатильностях путем установления правил управления капиталом, а также в сочетании с техническими показателями для определения сигналов покупки и продажи, чтобы реализовать управляемый риск. Система также включает в себя логику остановки и функцию отслеживания совокупной прибыли, которая позволяет эффективно контролировать и управлять показателями торгов.
Стратегический принцип
Стратегия в основном базируется на следующих основных компонентах:
- Индикатор Брин-Бенд используется для определения диапазона колебаний цены, когда цена касается нижней линии, рассматривается покупка, когда она касается верхней линии, рассматривается продажа
- RSI используется для подтверждения состояния перекупа и перепродажи на рынке, когда RSI ниже 25 подтверждает перепродажу, а выше 75 подтверждает перепродажу
- Модуль DCA рассчитывает сумму за каждое создание позиции в соответствии с динамикой прав и интересов счета, реализуя адаптивное управление средствами
- Модуль Stop-Loss устанавливает целевую прибыль в размере 5% для достижения цели автоматической защиты прибыли
- Модуль мониторинга состояния рынка рассчитывает 90-дневные изменения рынка, чтобы помочь определить общую тенденцию
- Модуль для отслеживания накопленной прибыли, записывающий прибыль и убытки по каждой сделке, чтобы легко оценить эффективность стратегии
Стратегические преимущества
- Повышение надежности сигнала в сочетании с перекрестной проверкой множества технических показателей
- Использование динамического управления позициями, чтобы избежать рисков, связанных с фиксированными позициями
- Установка разумных условий для блокировки прибыли
- Мониторинг рыночных тенденций, чтобы получить представление о ситуации
- Система отслеживания прибыли для анализа эффективности стратегии
- Устройство для предупреждения о возможностях торговли в режиме реального времени
Стратегический риск
- Сигналы, вызванные рыночными потрясениями, могут часто приводить к росту стоимости торгов
- RSI может отстать от трендового рынка
- Фиксированная стопроцентная остановка может привести к преждевременному выходу из рынка в условиях сильного тренда
- Стратегия DCA может привести к большому отступлению в одностороннем падении рынка
Для управления рисками рекомендуются следующие меры:
- Настройка максимального лимита
- Параметры для динамической корректировки рыночных колебаний
- Добавить фильтр тренда
- Внедрение стратегии поэтапного прекращения
Направление оптимизации стратегии
- Динамическая оптимизация параметров:
- Параметры Брин-полосы могут быть адаптированы к колебаниям
- RSI может меняться в зависимости от цикла рынка
- Доля средств DCA может быть скорректирована в зависимости от размера счета
- Сигнализация усилена:
- Подтверждение увеличения громкости
- Добавление анализа трендовых линий
- Вместе с другими техническими показателями и перекрестной проверкой
- Уровень риска:
- Осуществление динамического остановки
- Добавить максимальный контроль отмены
- Настройка лимита ежедневных потерь
Подвести итог
Стратегия создает более целостную торговую систему, используя в комплексе методы технического анализа и управления капиталом. Преимущества стратегии заключаются в признании нескольких сигналов и хорошем управлении рисками, но все же требуют полной проверки и оптимизации в реальном мире.
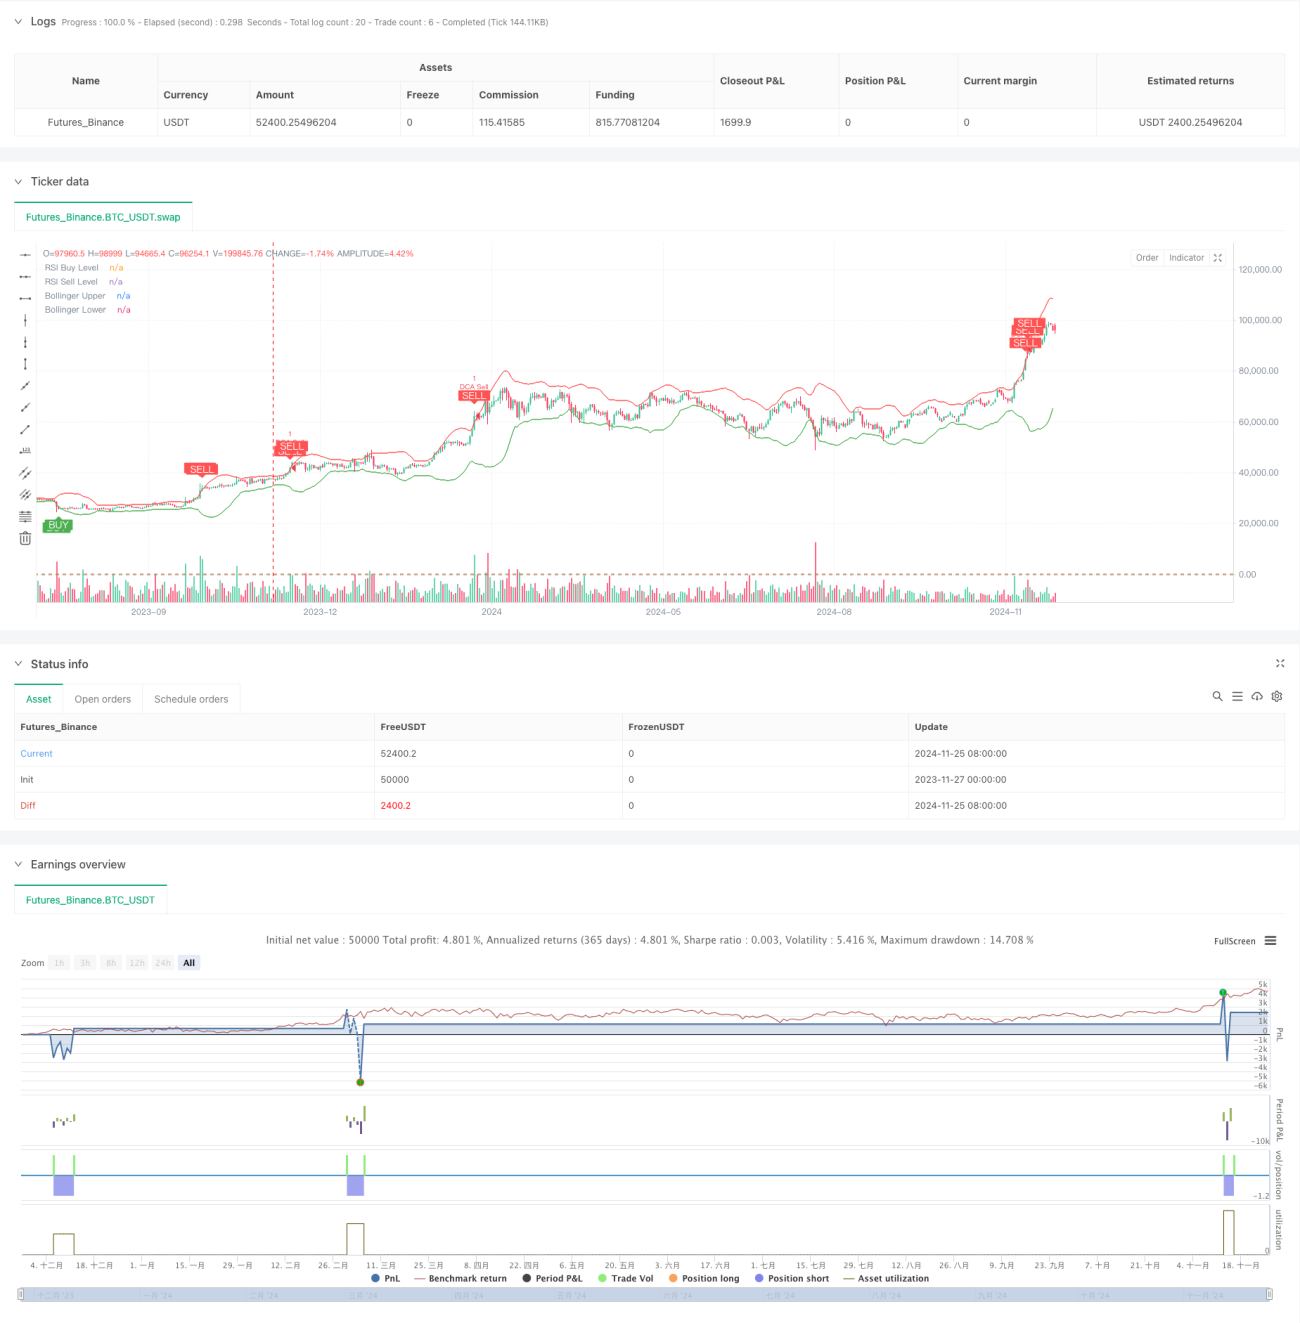
/*backtest
start: 2023-11-27 00:00:00
end: 2024-11-26 00:00:00
period: 1d
basePeriod: 1d
exchanges: [{"eid":"Futures_Binance","currency":"BTC_USDT"}]
*/

//@version=5
strategy("Combined BB RSI with Cumulative Profit, Market Change, and Futures Strategy (DCA)", shorttitle="BB RSI Combined DCA Strategy", overlay=true)

// Input Parameters- 1