Стратегия количественной торговли с отслеживанием тренда скользящей средней T3 и скользящим стоп-лоссом

Обзор
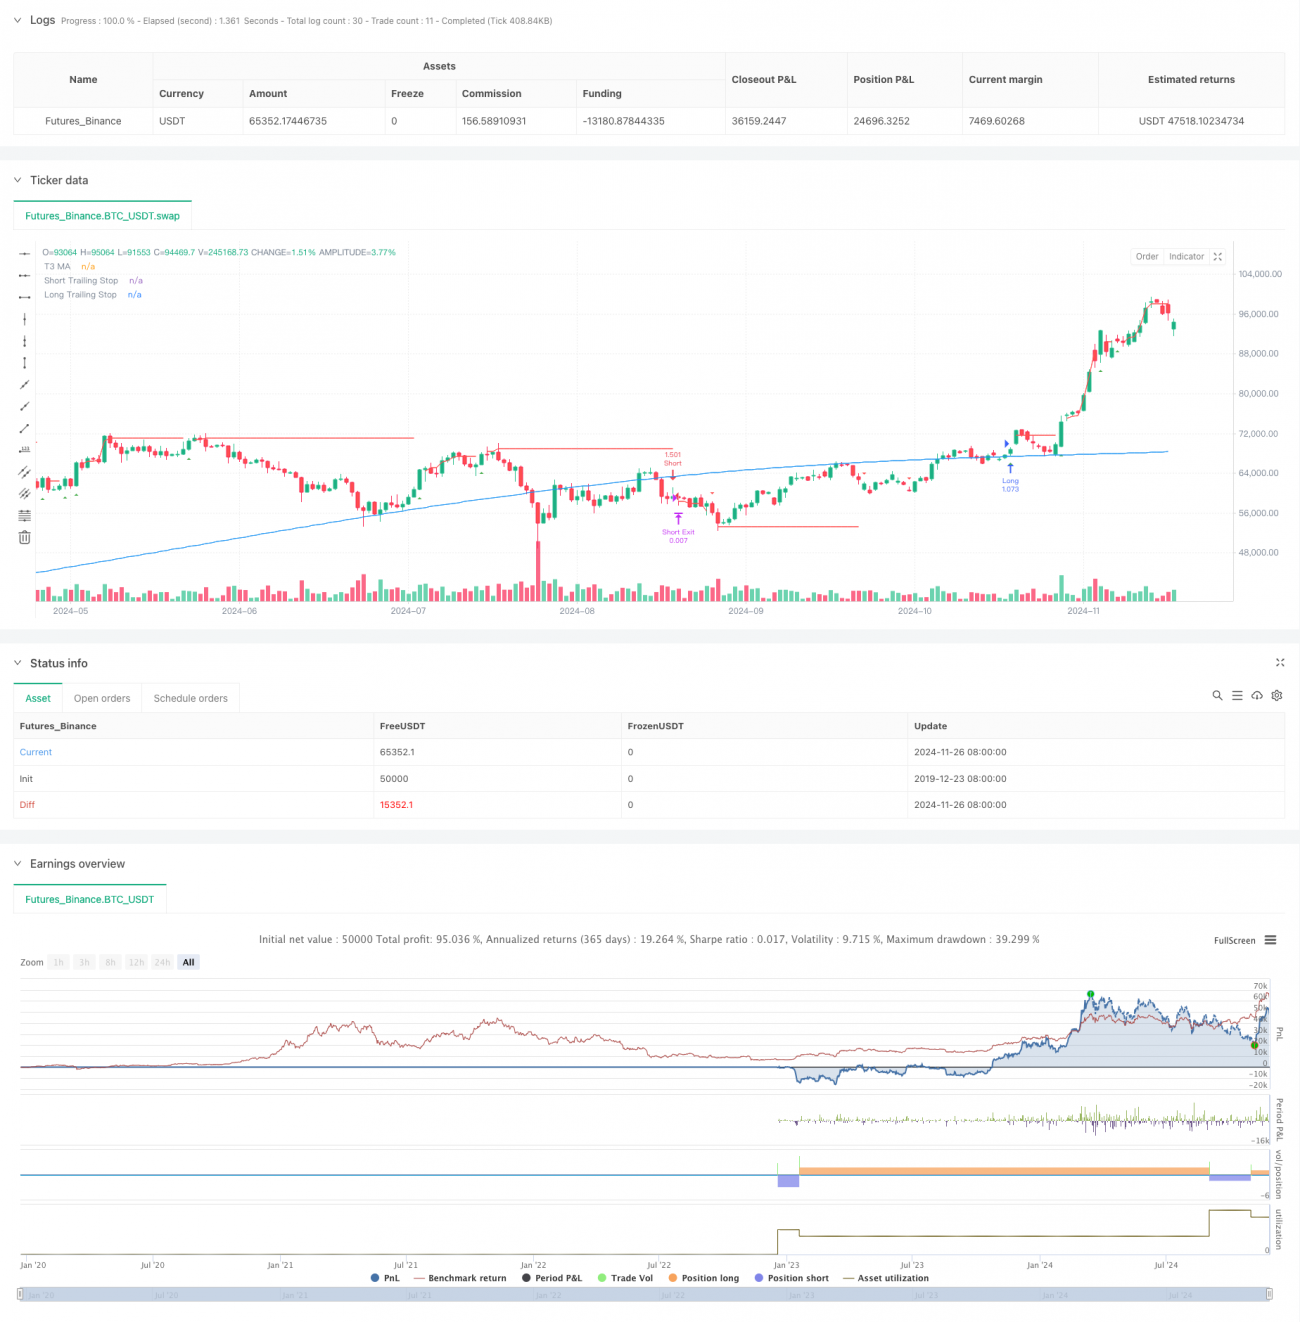
Эта стратегия является комплексной количественной торговой системой в сочетании с T3 средней линией, трендовым отслеживанием и механизмом движущихся стоп-убытков. Стратегия идентифицирует направление рыночных тенденций с помощью T3 движущихся средних, а также использует индикатор тренда Lemon и индикатор TDFI для подтверждения сигналов и совмещается с системой управления рисками в сочетании с движущимися стоп-убытками и фиксированными стоп-убытками для эффективного контроля тенденций и риска.
Стратегический принцип
В основе этой стратегии лежат три основные части: выявление тенденций, подтверждение сигналов и управление рисками. Во-первых, использование T3 Moving Average в качестве основного инструмента для выявления тенденций, T3 Average с помощью шестикратного индекса Moving Average позволяет эффективно снизить отставание и сохранить плавность. Во-вторых, с помощью показателя Lemon Trend, который рассчитывает диапазон колебаний цены, в сочетании с показателем TDFI, сигналы фильтруются, и только тогда, когда цена переходит диапазон колебаний и подтверждается показателем TDFI, появляется торговый сигнал.
Стратегические преимущества
- Механизм подтверждения множественных сигналов повышает точность транзакций
- Использование средней линии T3 уменьшает влияние ложных прорывов
- Гибкая система управления рисками, позволяющая сохранить прибыль и дать тренду достаточно места для развития
- Поддержка частичной остановки позиций, которая позволяет осуществлять поэтапное погашение прибыли
- Параметры легко регулируются и оптимизируются в зависимости от рыночной ситуации
Стратегический риск
- T3 усредненный вычисление сложно, возможно, есть задержка вычисления
- Некоторые торговые возможности могут быть упущены из-за подтверждения нескольких сигналов.
- Мобильные остановки могут быть преждевременно задействованы при сильных колебаниях
- Большие колебания цен необходимы для создания эффективного сигнала.
- Некоторые риски, связанные с ложными сигналами на рынке криптовалют
Направление оптимизации стратегии
- Введение показателя колебаний для корректировки параметров мобильного стоп-лоста
- Добавление модуля распознавания рыночных условий с использованием различных параметров в различных рыночных условиях
- Оптимизация цикла вычисления показателей TDFI, повышение своевременности сигналов
- Рассмотрение возможности добавления фактора объема транзакций для подтверждения сигнала
- Исследование механизмов установки частичной тормозной пропорции при приспособлении
Подвести итог
Это комплексная стратегия отслеживания тенденций, которая обеспечивает надежность торговых сигналов и эффективное управление рисками за счет совместного использования нескольких технических показателей. Модульная конструкция стратегии обеспечивает хорошую масштабируемость и оптимизацию, что позволяет использовать ее в качестве базовой структуры для систем отслеживания тенденций в среднесрочной и долгосрочной перспективе. В практическом применении рекомендуется оптимизировать параметры в зависимости от конкретных видов торговли и рыночной среды.
/*backtest
start: 2019-12-23 08:00:00
end: 2024-11-27 00:00:00
period: 1d
basePeriod: 1d
exchanges: [{"eid":"Futures_Binance","currency":"BTC_USDT"}]
*/

//@version=5
strategy("Lemon Trend Strategy", overlay=true, initial_capital=10000, default_qty_type=strategy.percent_of_equity, default_qty_value=100)

// Input parameters- 1