Стратегия модели оптимизации тренда ATR Fusion

ATR SMA TP BP TR SL
Дата создания: 2024-11-28 17:06:21 Последнее изменение: 2024-11-28 17:06:21
Копировать: 0 Количество просмотров: 403
1
Подписаться
1617
Подписчики

Стратегия модели оптимизации тренда ATR Fusion

Обзор

Стратегия является высокотехнологичной системой отслеживания трендов, основанной на ATR и фибоначчи. Она создает адаптивную модель торгов, которая реагирует на изменение цены в течение нескольких периодов времени.

Стратегический принцип

Стратегия использует многоуровневый подход к комбинации технических показателей: сначала рассчитывается реальный диапазон колебаний (TR) и давление на покупку (BP), затем рассчитывается соотношение давления для каждой из циклов на основе циклов временных рядов Фибоначчи (8,13,21,34,55). Построение взвешенного среднего значения путем наложения различных весов на различные циклы (5,4,3,2,1) и дальнейшее применение 3-циклической обработки SMA.

Стратегические преимущества

  1. Многомерный анализ: объединение данных за несколько временных периодов для более полного представления о рынке
  2. Динамическая адаптация: адаптация к рыночным колебаниям с помощью ATR для повышения стабильности стратегии
  3. Умная прибыль: четырехступенчатый механизм прибыли может быть гибко адаптирован к различным рыночным условиям
  4. Управляемый риск: четкие условия входа и выхода, снижающие риск субъективного суждения
  5. Систематизированные операции: четкая логика стратегии, легкость количественной реализации и обратная проверка

Стратегический риск

  1. Чувствительность параметров: несколько параметров значений и весов требуют тщательной настройки
  2. Риск отставания: Сглаживание SMA может привести к задержке сигнала
  3. Зависимость от рыночной конъюнктуры: возможные ложные сигналы на рынке во время колебаний
  4. Параметры адаптируются: параметры требуют переоптимизации в разных рыночных условиях Решение: Рекомендуется провести полное оптимизацию и обратную проверку параметров и динамически адаптировать параметры в зависимости от различных рыночных этапов.

Направление оптимизации стратегии

  1. Адаптация параметров: разработка механизмов адаптации параметров для повышения адаптивности стратегии
  2. Отбор рынка: добавление модуля идентификации рыночной среды для выполнения сделок в соответствующих рыночных условиях
  3. Оптимизация сигнала: введение вспомогательных подтверждающих показателей, повышение надежности сигнала
  4. Улучшение управления ветром: добавление модуля динамического стоп-лоста и управления позицией
  5. Контроль вывода: добавление максимального ограничения вывода для повышения стабильности стратегии

Подвести итог

Стратегия, объединяя технологии ATR и Fibonacci weighted average, создает всеобъемлющую систему отслеживания тенденций. Ее преимущества заключаются в многомерном анализе и динамической адаптации, но также требует внимания к оптимизации параметров и фильтрации рыночных условий.
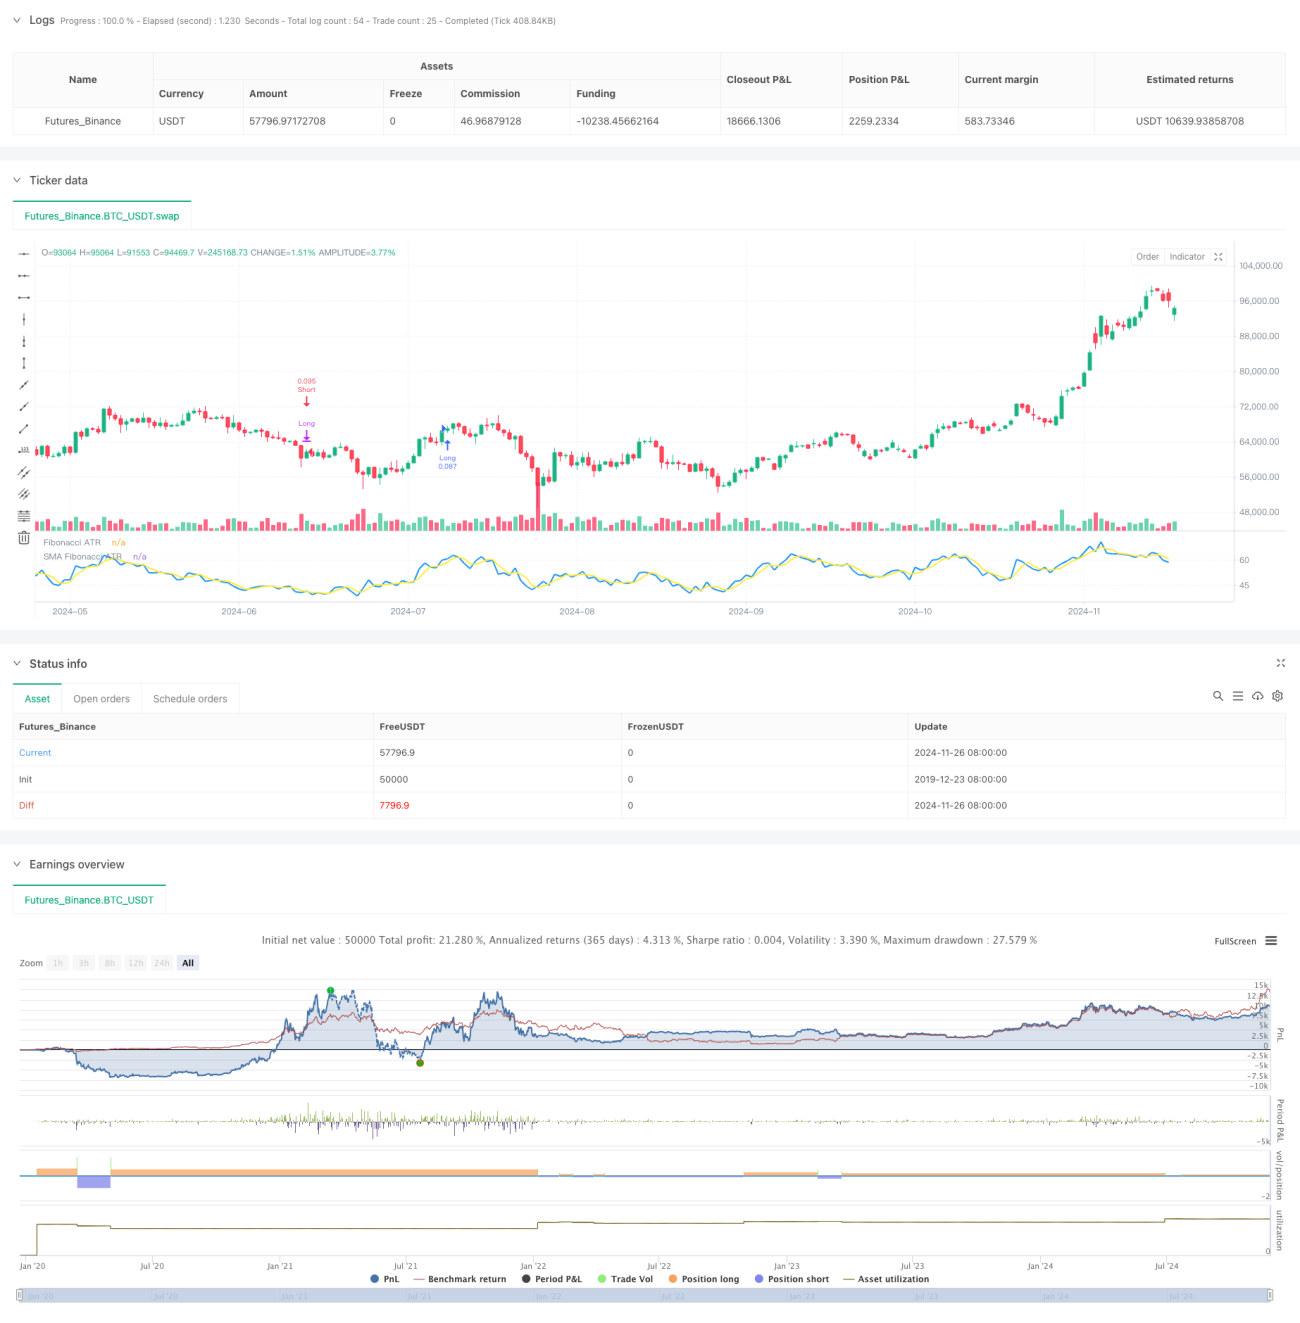
Исходный код стратегии
/*backtest
start: 2019-12-23 08:00:00
end: 2024-11-27 00:00:00
period: 1d
basePeriod: 1d
exchanges: [{"eid":"Futures_Binance","currency":"BTC_USDT"}]
*/

// This Pine Script™ code is subject to the terms of the Mozilla Public License 2.0 at https://mozilla.org/MPL/2.0/
// © PresentTrading

// The Fibonacci ATR Fusion Strategy is an advanced trading methodology that uniquely integrates Fibonacci-based weighted averages with the Average True Range (ATR) to 
// identify and exploit significant market trends. Unlike traditional strategies that rely on single indicators or fixed parameters, this approach leverages multiple timeframes and 
// dynamic volatility measurements to enhance accuracy and adaptability. 

//@version=5
strategy("Fibonacci ATR Fusion - Strategy [presentTrading]", overlay=false, precision=3, commission_value= 0.1, commission_type=strategy.commission.percent, slippage= 1, currency=currency.USD, default_qty_type = strategy.percent_of_equity, default_qty_value = 10, initial_capital=10000)

// Calculate True High and True Low
tradingDirection = input.string(title="Trading Direction", defval="Both", options=["Long", "Short", "Both"])

// Trading Condition Thresholds
long_entry_threshold = input.float(58.0, title="Long Entry Threshold")
short_entry_threshold = input.float(42.0, title="Short Entry Threshold")
long_exit_threshold = input.float(42.0, title="Long Exit Threshold")
short_exit_threshold = input.float(58.0, title="Short Exit Threshold")

// Enable or Disable 4-Step Take Profit
useTakeProfit = input.bool(false, title="Enable 4-Step Take Profit")

// Take Profit Levels (as multiples of ATR)
tp1ATR = input.float(3.0, title="Take Profit Level 1 ATR Multiplier")
tp2ATR = input.float(8.0, title="Take Profit Level 2 ATR Multiplier")
tp3ATR = input.float(14.0, title="Take Profit Level 3 ATR Multiplier")

// Take Profit Percentages
tp1_percent = input.float(12.0, title="TP Level 1 Percentage", minval=0.0, maxval=100.0)
tp2_percent = input.float(12.0, title="TP Level 2 Percentage", minval=0.0, maxval=100.0)
tp3_percent = input.float(12.0, title="TP Level 3 Percentage", minval=0.0, maxval=100.0)

true_low = math.min(low, close[1])
true_high = math.max(high, close[1])

// Calculate True Range
true_range = true_high - true_low

// Calculate BP (Buying Pressure)
bp = close - true_low

// Calculate ratios for different periods
calc_ratio(len) =>
    sum_bp = math.sum(bp, len)
    sum_tr = math.sum(true_range, len)
    100 * sum_bp / sum_tr

// Calculate weighted average of different timeframes
weighted_avg = (5 * calc_ratio(8) + 4 * calc_ratio(13) + 3 * calc_ratio(21) + 2 * calc_ratio(34) + calc_ratio(55)) / (5 + 4 + 3 + 2 + 1)
weighted_avg_sma = ta.sma(weighted_avg,3)

// Plot the indicator
plot(weighted_avg, "Fibonacci ATR", color=color.blue, linewidth=2)
plot(weighted_avg_sma, "SMA Fibonacci ATR", color=color.yellow, linewidth=2)

// Define trading conditions
longCondition = ta.crossover(weighted_avg_sma, long_entry_threshold)  // Enter long when weighted average crosses above threshold
shortCondition = ta.crossunder(weighted_avg_sma, short_entry_threshold) // Enter short when weighted average crosses below threshold
longExit = ta.crossunder(weighted_avg_sma, long_exit_threshold)
shortExit = ta.crossover(weighted_avg_sma, short_exit_threshold)


atrPeriod = 14
atrValue = ta.atr(atrPeriod)

if (tradingDirection == "Long" or tradingDirection == "Both")
    if (longCondition)
        strategy.entry("Long", strategy.long)
        // Set Take Profit levels for Long positions
        if useTakeProfit
            tpPrice1 = strategy.position_avg_price + tp1ATR * atrValue
            tpPrice2 = strategy.position_avg_price + tp2ATR * atrValue
            tpPrice3 = strategy.position_avg_price + tp3ATR * atrValue
            // Close partial positions at each Take Profit level
            strategy.exit("TP1 Long", from_entry="Long", qty_percent=tp1_percent, limit=tpPrice1)
            strategy.exit("TP2 Long", from_entry="Long", qty_percent=tp2_percent, limit=tpPrice2)
            strategy.exit("TP3 Long", from_entry="Long", qty_percent=tp3_percent, limit=tpPrice3)
    if (longExit)
        strategy.close("Long")

if (tradingDirection == "Short" or tradingDirection == "Both")
    if (shortCondition)
        strategy.entry("Short", strategy.short)
        // Set Take Profit levels for Short positions
        if useTakeProfit
            tpPrice1 = strategy.position_avg_price - tp1ATR * atrValue
            tpPrice2 = strategy.position_avg_price - tp2ATR * atrValue
            tpPrice3 = strategy.position_avg_price - tp3ATR * atrValue
            // Close partial positions at each Take Profit level
            strategy.exit("TP1 Short", from_entry="Short", qty_percent=tp1_percent, limit=tpPrice1)
            strategy.exit("TP2 Short", from_entry="Short", qty_percent=tp2_percent, limit=tpPrice2)
            strategy.exit("TP3 Short", from_entry="Short", qty_percent=tp3_percent, limit=tpPrice3)
    if (shortExit)
        strategy.close("Short")