
Обзор
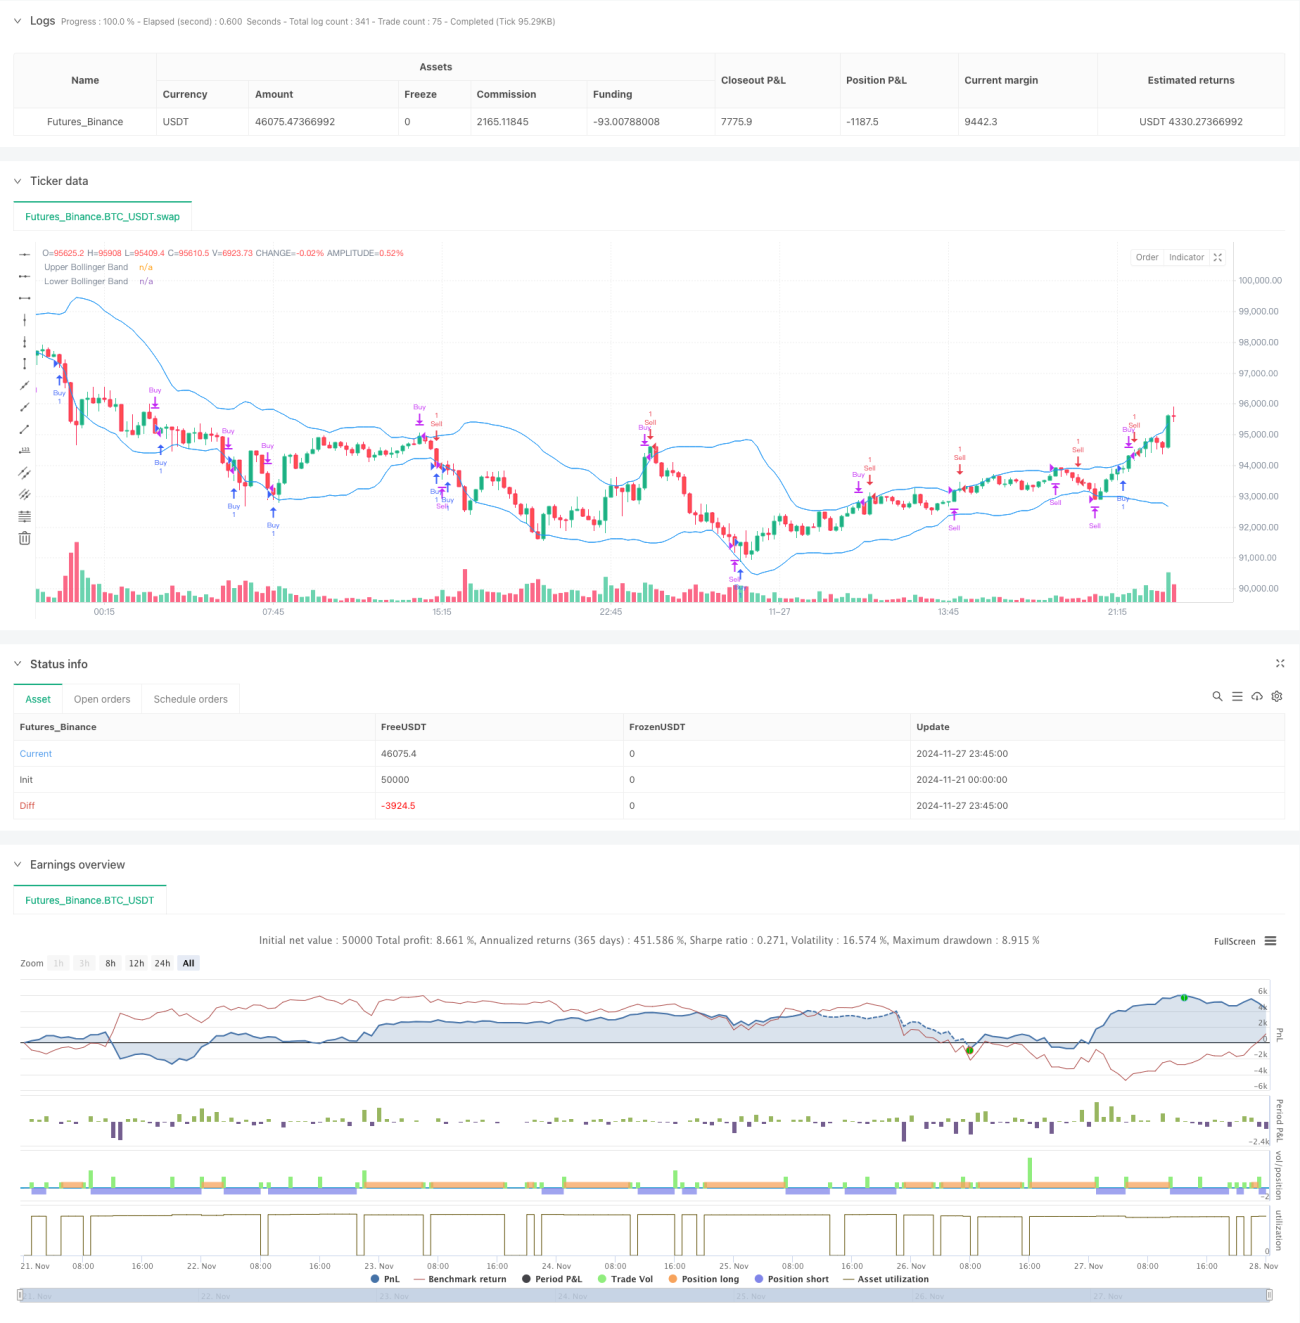
Стратегия представляет собой комплексную торговую систему, основанную на нескольких технических показателях, позволяющую уловить рыночные тенденции и возможности для обратного пути путем объединения нескольких технических показателей, таких как MACD, RSI, BRI и ATR. Стратегия использует динамическую схему остановок и прибылей, позволяющую адаптировать торговые параметры в зависимости от волатильности рынка и эффективно контролировать риск, гарантируя прибыль. Результаты обратной проверки показывают, что стратегия достигла 676,27% прибыли в течение тестирования за последние три месяца, демонстрируя хорошую рыночную адаптивность.
Стратегический принцип
Стратегия включает в себя многоуровневую систему проверки технических показателей, включая:
- MACD ((12,26,9) используется для захвата сигнала конвертации динамики, когда MACD-линия генерирует сигнал покупки при прохождении линии сигнала и генерирует сигнал продажи при прохождении
- RSI ((14) в качестве вторичного фильтра, ниже 35 считается зоной перепродажи, выше 65 считается зоной перекупа
- Брин-полоса ((20, 2) используется для идентификации диапазона колебаний цены, когда цена касается нижнего трека, чтобы рассмотреть покупку, когда она касается верхнего трека, чтобы рассмотреть продажу
- ATR используется для динамического настройки уровней стоп-лосса и прибыли, стоп-лосса устанавливается в 3 раза ATR, а прибыль - в 5 раз ATR
Торговая логика объединяет две стратегии: отслеживание тенденций и обратная торговля, повышает точность сделок с помощью многократной проверки. Система автоматически корректирует уровень остановки убытков и прибыли в зависимости от волатильности рынка в реальном времени, что позволяет оптимизировать динамику управления рисками.
Стратегические преимущества
- Система многомерной проверки сигналов повышает надежность транзакций
- Динамическая стоп-прибыль адаптируется к различным рыночным условиям
- Интеграция тренинговых и реверсивных идей для увеличения возможностей торговли
- Автоматизированная система управления рисками снижает ошибки в человеческом суждении
- 53.99% выигрыш и коэффициент прибыли 1.44 показывают стабильность стратегии
- Стратегия поддерживает напоминания о сделках в режиме реального времени для удобства трейдеров
Стратегический риск
- Многочисленные показатели могут привести к задержке сигналов и упущенным возможностям в быстром рынке
- Максимальная вероятность вывода на 56.33% требует большей рискованности.
- Частые транзакции могут привести к более высоким транзакционным затратам
- Стратегии могут быть более рискованными в условиях резкого колебания рынка
Предложения по контролю рисков:
- Строгое выполнение плана управления деньгами
- Регулярно проверяйте и корректируйте параметры
- Приостановка торговли во время важных данных
- Установите максимальный лимит потерь в день
Направление оптимизации стратегии
-
Параметры оптимизации:
- Параметры показателя, которые следует учитывать при использовании адаптационного цикла
- Оптимизация множителей ATR для повышения риско-прибыльности
-
Улучшение системы сигнализации:
- Добавление проверки показателей транзакций
- Введение показателей рыночных настроений
-
Оптимизация управления рисками:
- Реализовать динамическое управление позициями
- Добавить фильтр времени
-
Технические улучшения:
- Добавление фильтра рыночных колебаний
- Оптимизируйте время входа в игру
Подвести итог
Стратегия обеспечивает лучшую эффективность торговли благодаря комбинации многочисленных технических показателей и динамичной системе управления рисками. Хотя существует определенный риск отступления, стратегия демонстрирует хорошую рыночную адаптацию и стабильность благодаря строгому контролю риска и постоянной оптимизации.
- 1