Обзор
Стратегия представляет собой трендовую торговую систему, основанную на уровне фибоначевых отступлений и формате K-линии. Она работает в течение нескольких временных циклов и сочетает в себе принципы технического анализа и управления рисками.
Стратегический принцип
Основная логика стратегии основана на следующих ключевых элементах:
- Выбор временных циклов: стратегия позволяет работать на нескольких временных циклах, таких как 4-часовой, дневный, круговой и лунный, чтобы адаптироваться к различным стилям торговли.
- Вычисление уровня Фибоначчи: используются два ключевых уровня отступления 0,618 и 0,786 для вычисления максимальных и минимальных цен за 50 циклов.
- Появление входного сигнала: когда цена на закрытие в определенных условиях превышает уровень Фибоначчи, система генерирует сигнал о покупке или продаже. Сигнал о покупке требует, чтобы цена на закрытие была выше цены на открытие и находилась выше уровня 0,618. Сигнал о продаже требует, чтобы цена на закрытие была ниже цены на открытие и находилась ниже уровня 0,786.
- Управление рисками: стратегия использует фиксированный процент стоп-лоста и определяет целевую прибыль с помощью заранее заданного риска-прибыли.
Стратегические преимущества
- Многоциклическая адаптивность: стратегия может адаптироваться к различным рыночным условиям и стилям торговли, работая в разных временных циклах.
- Систематическое управление рисками: обеспечение четкого контроля риска для каждой сделки с помощью заранее заданных целей по остановке и прибыли.
- Интеграция технических индикаторов: в сочетании с отступлением Фибоначчи и анализом формы K-линии, обеспечивает более надежный торговый сигнал.
- Высокая настраиваемость: ключевые параметры, такие как уровень Фибоначчи, коэффициент риска к прибыли и стоп-процент, могут быть изменены в соответствии с личными предпочтениями.
Стратегический риск
- Риск рыночных колебаний: в период высокой волатильности цены могут быстро преодолеть предел убытков, что приводит к убыткам.
- Риск ложного прорыва: рынок может получить ложный сигнал прорыва на уровне Фибоначчи.
- Риск оптимизации параметров: чрезмерная оптимизация параметров может привести к тому, что стратегия будет плохо работать в реальном мире.
- Риск ликвидности: в некоторых периодах времени или при определенных рыночных условиях может возникнуть проблема недостаточной ликвидности.
Направление оптимизации стратегии
- Добавление фильтра рыночных тенденций: можно добавить движущиеся средние или другие трендовые индикаторы, чтобы отфильтровать обратные сигналы.
- Оптимизируйте время поступления: подумайте о том, чтобы увеличить количество подтверждений или динамических показателей для повышения точности поступления.
- Динамическое управление остановками: реализация динамических остановок, основанных на волатильности, для адаптации к различным рыночным условиям.
- Добавление фильтров по времени: добавление ограничений на время торгового окна, чтобы избежать торговли в неблагоприятные рыночные часы.
- Многомерное подтверждение сигнала: интеграция других технических показателей для предоставления дополнительного подтверждения сигнала.
Подвести итог
Это хорошо структурированная стратегия отслеживания тенденций, которая предоставляет трейдерам систематизированный метод торговли путем сочетания фибоначевых отступлений, K-линейных форм и принципов управления рисками. Несмотря на определенные риски, стабильность и надежность стратегии могут быть дополнительно повышены с помощью рекомендованного направления оптимизации. Многоцикличность стратегии и ее настраиваемые параметры делают ее подходящей для различных типов трейдеров.
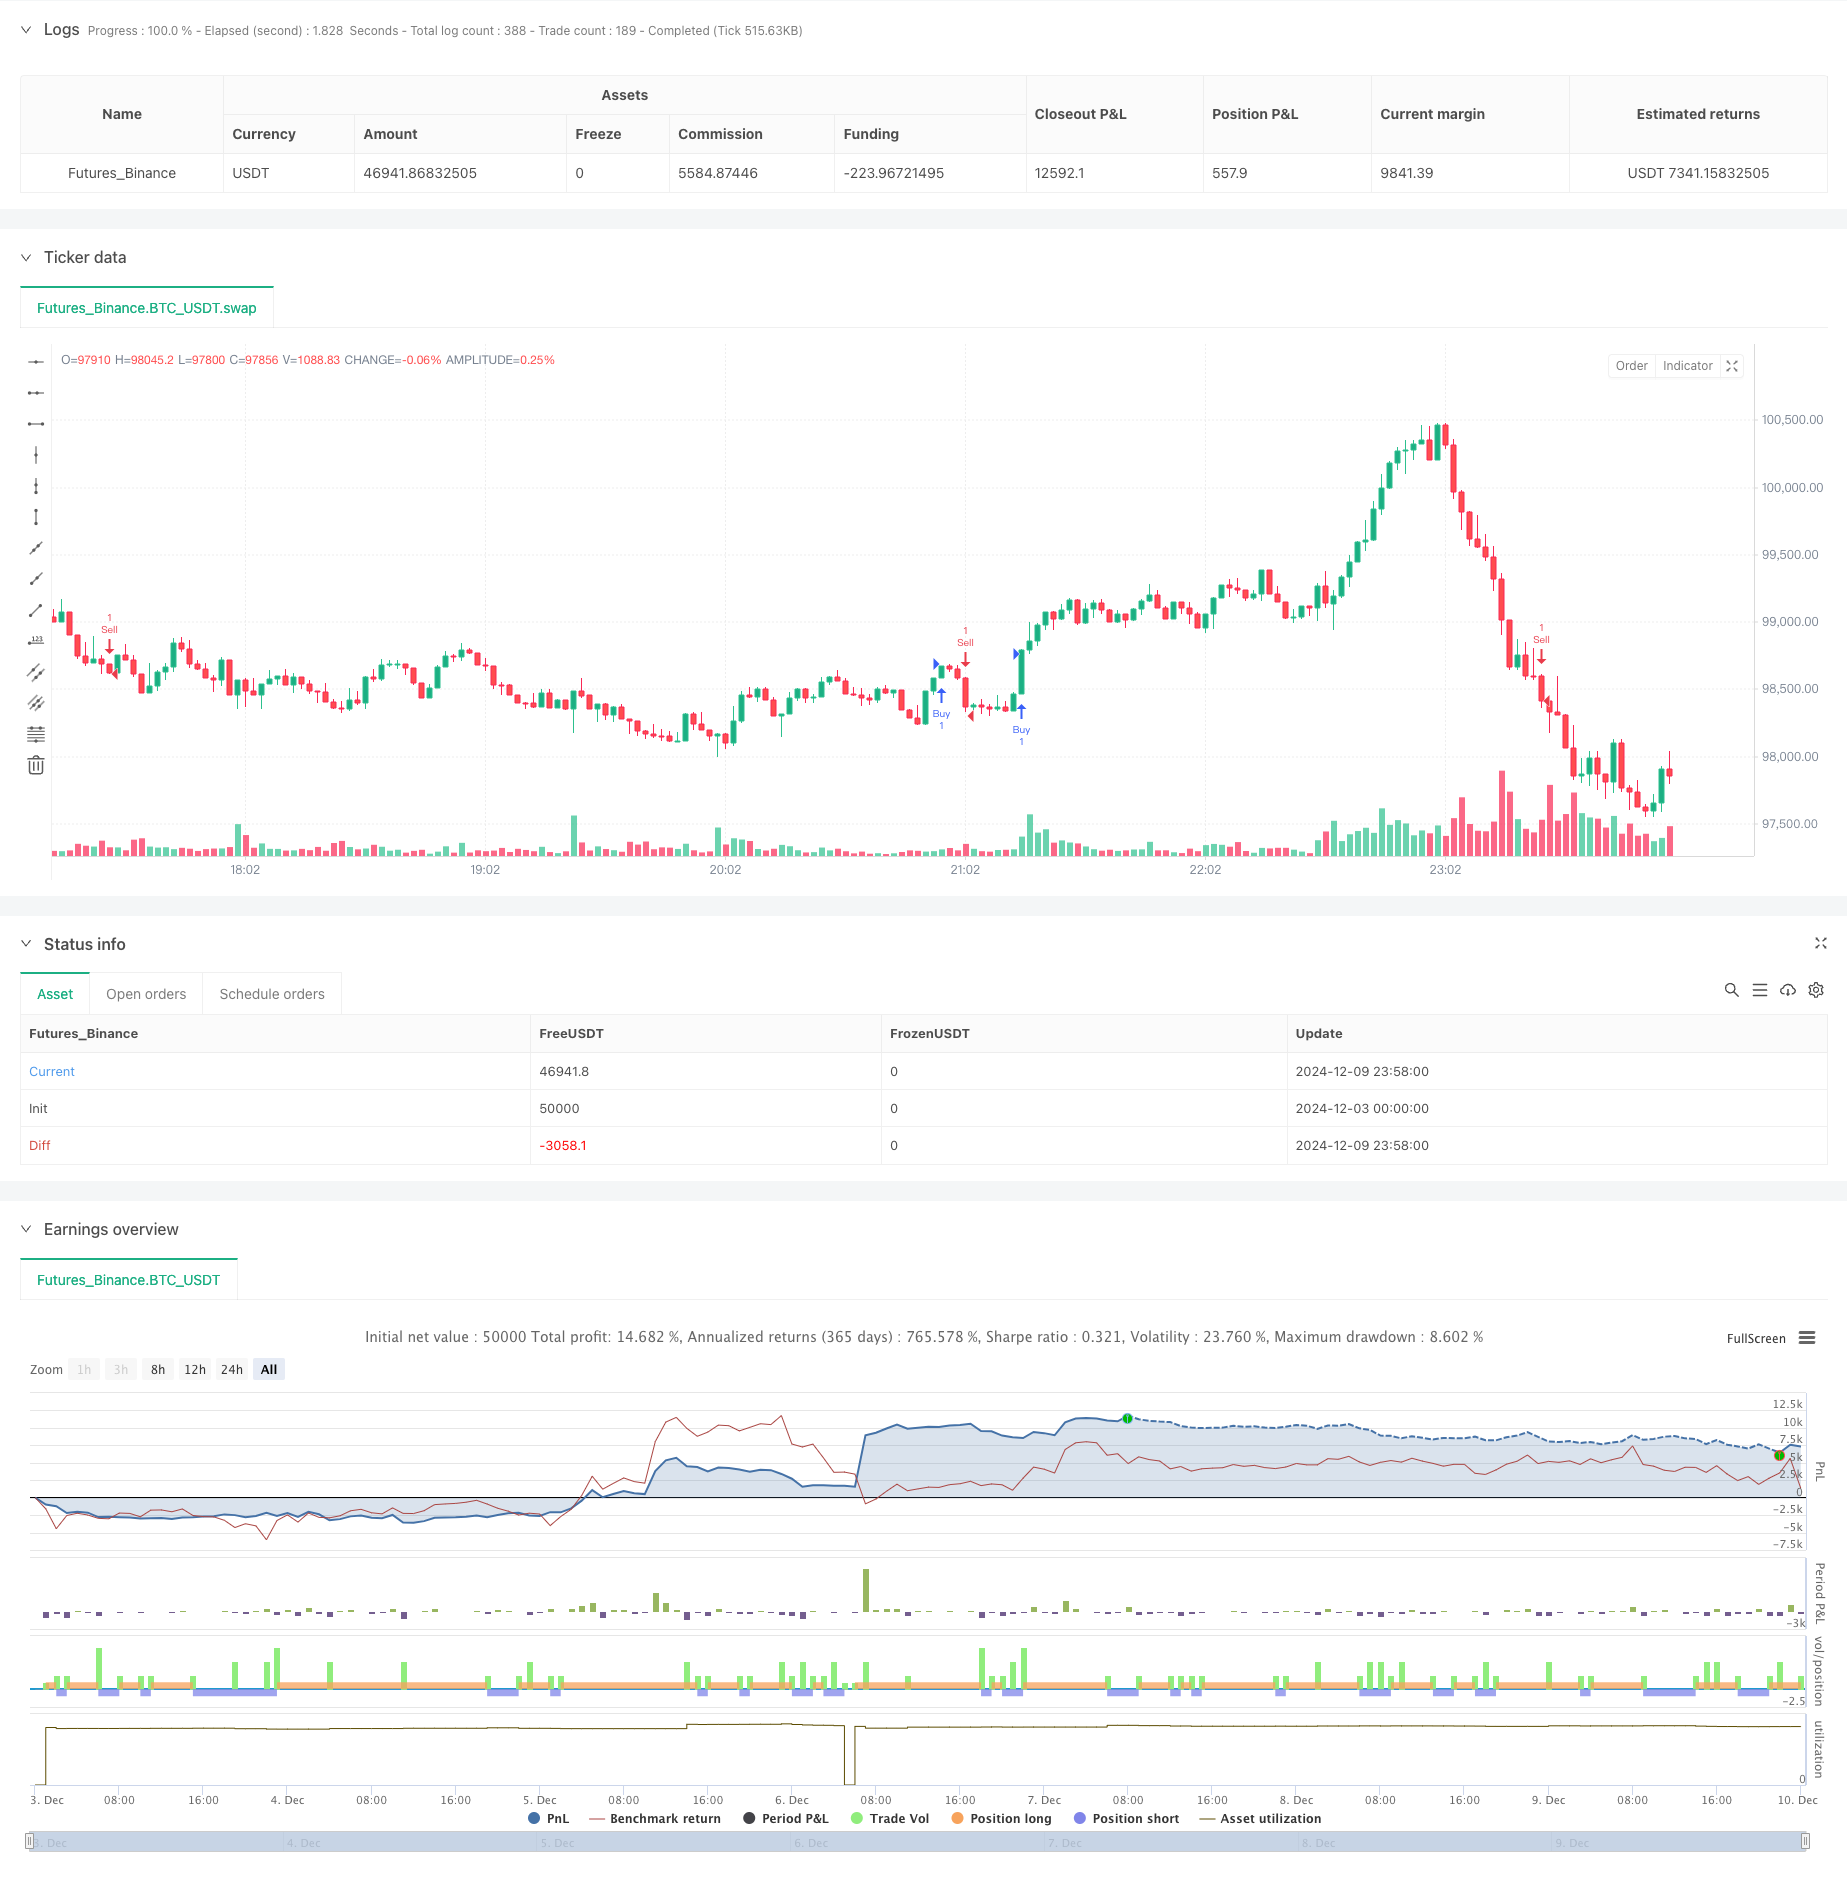
/*backtest
start: 2024-12-03 00:00:00
end: 2024-12-10 00:00:00
period: 2m
basePeriod: 2m
exchanges: [{"eid":"Futures_Binance","currency":"BTC_USDT"}]
*/

// This Pine Script™ code is subject to the terms of the Mozilla Public License 2.0 at https://mozilla.org/MPL/2.0/
// © jontucklogic7467

//@version=5
strategy("Fibonacci Swing Trading Bot", overlay=true)

// Input parameters
fiboLevel1 = input.float(0.618, title="Fibonacci Retracement Level 1")
fiboLevel2 = input.float(0.786, title="Fibonacci Retracement Level 2")
riskRewardRatio = input.float(2.0, title="Risk/Reward Ratio")
stopLossPerc = input.float(1.0, title="Stop Loss Percentage") / 100

// Timeframe selection
useTimeframe = input.timeframe("240", title="Timeframe for Analysis", options=["240", "D", "W", "M"])

// Request data from selected timeframe
highTF = request.security(syminfo.tickerid, useTimeframe, high)
lowTF = request.security(syminfo.tickerid, useTimeframe, low)

// Swing high and low calculation over the last 50 bars in the selected timeframe
highestHigh = ta.highest(highTF, 50)
lowestLow = ta.lowest(lowTF, 50)

// Fibonacci retracement levels
fib618 = highestHigh - (highestHigh - lowestLow) * fiboLevel1
fib786 = highestHigh - (highestHigh - lowestLow) * fiboLevel2

// Plot Fibonacci levels
// line.new(bar_index[1], fib618, bar_index, fib618, color=color.red, width=2, style=line.style_dashed)
// line.new(bar_index[1], fib786, bar_index, fib786, color=color.orange, width=2, style=line.style_dashed)

// Entry signals based on candlestick patterns and Fibonacci levels
bullishCandle = close > open and close > fib618 and close < highestHigh
bearishCandle = close < open and close < fib786 and close > lowestLow

// Stop loss and take profit calculation
stopLoss = bullishCandle ? close * (1 - stopLossPerc) : close * (1 + stopLossPerc)
takeProfit = bullishCandle ? close + (close - stopLoss) * riskRewardRatio : close - (stopLoss - close) * riskRewardRatio

// Plot buy and sell signals
if bullishCandle
    strategy.entry("Buy", strategy.long)
    strategy.exit("Take Profit", "Buy", limit=takeProfit, stop=stopLoss)

if bearishCandle
    strategy.entry("Sell", strategy.short)
    strategy.exit("Take Profit", "Sell", limit=takeProfit, stop=stopLoss)