Стратегия усреднения стоимости доллара по полосе Боллинджера Mean Reversion

BB DCA EMA SMA
Дата создания: 2024-12-12 17:17:15 Последнее изменение: 2024-12-12 17:17:15
Копировать: 2 Количество просмотров: 447
1
Подписаться
1617
Подписчики

Стратегия усреднения стоимости доллара по полосе Боллинджера Mean Reversion

Обзор

Стратегия является умной инвестиционной стратегией, которая сочетает в себе доллар, среднюю стоимость (DCA) и технические показатели по буринской полосе. Она инвестирует в систематическую постройку позиций во время ценовых сдвигов с использованием принципа среднезначной регрессии.

Стратегический принцип

Основные принципы стратегии основаны на трёх основах: 1) среднедолларовой стоимости, которая снижает риски при выборе курса путем регулярного вложения фиксированной суммы; 2) средневзвешенной теории возврата, которая предполагает, что цена в конечном итоге вернется к своему историческому среднему уровню; 3) индикатор Брин-пояса, используемый для идентификации зоны перепродажи.

Стратегические преимущества

  1. Снижение риска при выборе - снижение человеческой ошибки путем систематического приобретения, а не субъективного суждения
  2. Использование возможности обратной коррекции - автоматическое выполнение покупки при перепаде цены
  3. Гибкая настройка параметров - можно корректировать параметры и сумму инвестиций в Брин-Бенде в зависимости от различных рыночных условий
  4. Четкие правила входа и выхода - объективные сигналы на основе технических показателей
  5. Автоматизированное исполнение - без человеческого вмешательства, избегая эмоциональных сделок

Стратегический риск

  1. Риск неудачи среднемесячного регресса - более вероятные ложные сигналы в трендовых рынках
  2. Управление рисками - необходимость резервирования достаточного количества средств для удовлетворения последовательных сигналов покупки
  3. Риски оптимизации параметров - чрезмерная оптимизация может привести к неэффективности стратегии
  4. Зависимость от рыночных условий - возможна неудачная работа в условиях резкой волатильности рынка Для управления этими рисками рекомендуется применять строгие системы управления капиталом и регулярно оценивать эффективность стратегии.

Направление оптимизации стратегии

  1. Введение фильтра тренда, чтобы избежать обратной операции в сильных тенденциях
  2. Добавление механизма подтверждения множественных временных циклов
  3. Оптимизация системы управления капиталом, изменение сумм инвестиций в зависимости от динамики волатильности
  4. Присоединение к механизму прибыли, прибыль при возвращении цены к средней стоимости
  5. Повышение надежности сигнала в сочетании с другими техническими показателями

Подвести итог

Это стабильная стратегия, объединяющая технический анализ и систематизированный инвестиционный подход. Снижение риска осуществляется с помощью идентификации возможностей для перепадов, в сочетании с долларовой средней стоимостью. Ключ к успеху стратегии заключается в рациональной установке параметров и строгой дисциплине в выполнении.
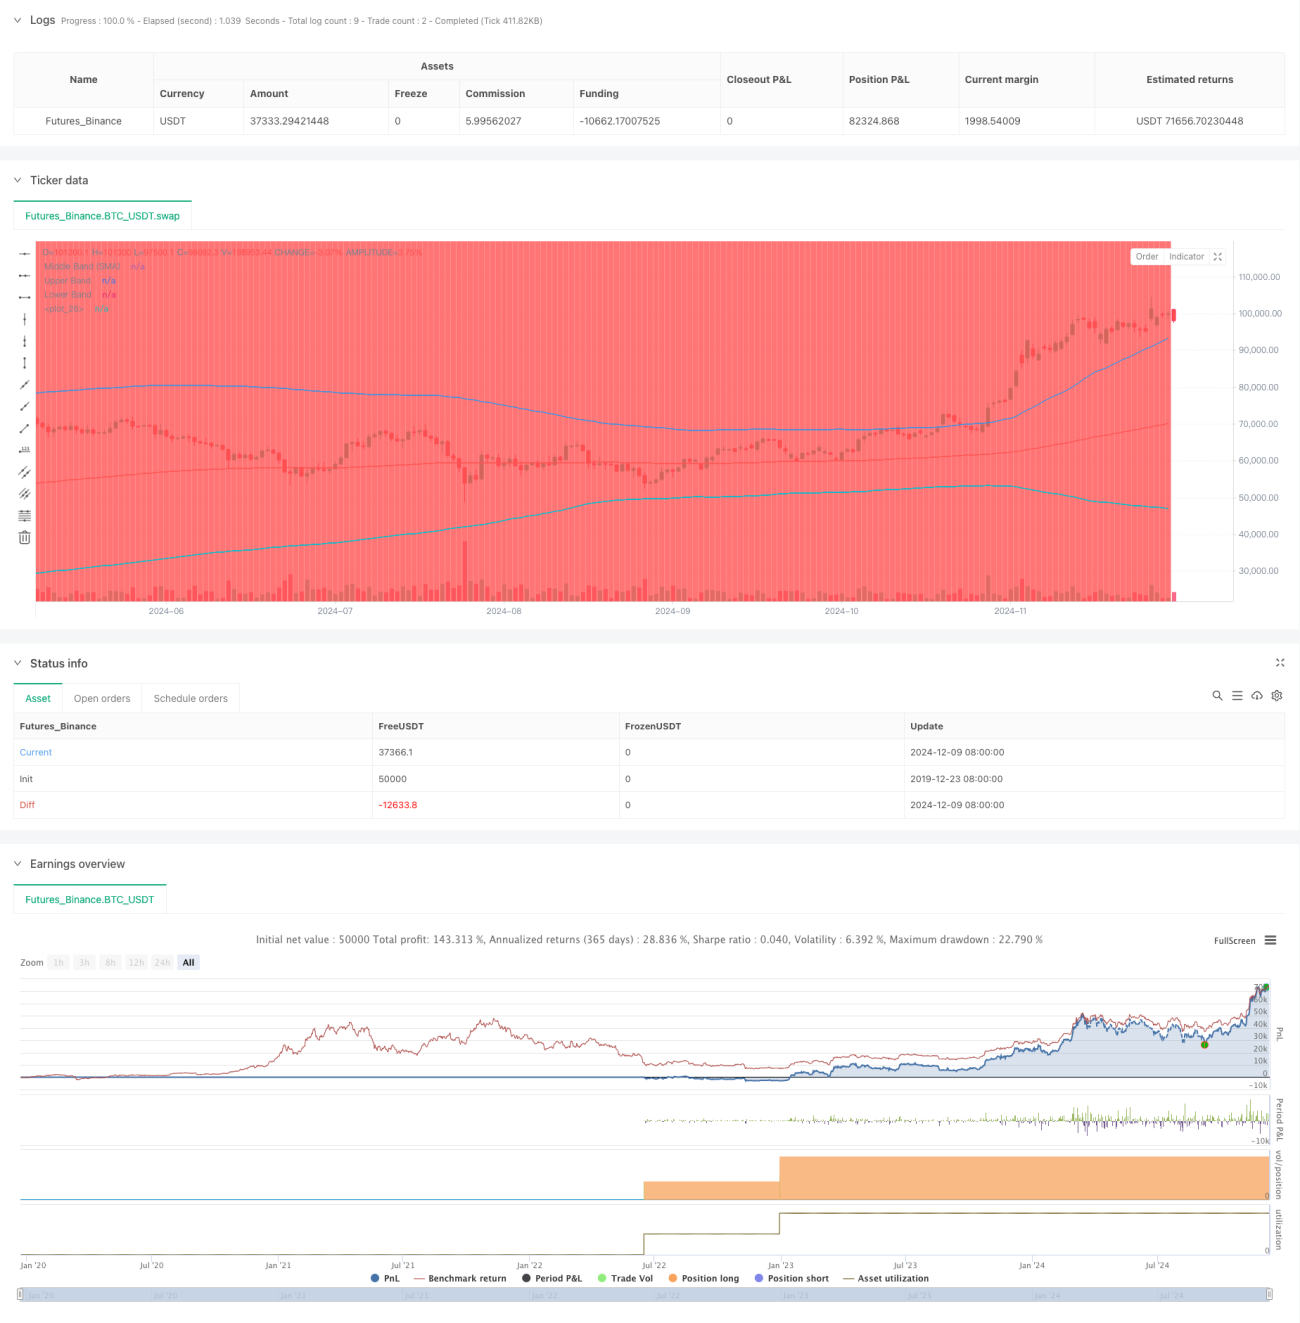
Исходный код стратегии
/*backtest
start: 2019-12-23 08:00:00
end: 2024-12-10 08:00:00
period: 1d
basePeriod: 1d
exchanges: [{"eid":"Futures_Binance","currency":"BTC_USDT"}]
*/

//@version=5
strategy("DCA Strategy with Mean Reversion and Bollinger Band", overlay=true) // Define the strategy name and set overlay=true to display on the main chart

// Inputs for investment amount and dates
investment_amount = input.float(10000, title="Investment Amount (USD)", tooltip="Amount to be invested in each buy order (in USD)") // Amount to invest in each buy order
open_date = input(timestamp("2024-01-01 00:00:00"), title="Open All Positions On", tooltip="Date when to start opening positions for DCA strategy") // Date to start opening positions
close_date = input(timestamp("2024-08-04 00:00:00"), title="Close All Positions On", tooltip="Date when to close all open positions for DCA strategy") // Date to close all positions

// Bollinger Band parameters
source = input.source(title="Source", defval=close, group="Bollinger Band Parameter", tooltip="The price source to calculate the Bollinger Bands (e.g., closing price)") // Source of price for calculating Bollinger Bands (e.g., closing price)
length = input.int(200, minval=1, title='Period', group="Bollinger Band Parameter", tooltip="Period for the Bollinger Band calculation (e.g., 200-period moving average)") // Period for calculating the Bollinger Bands (e.g., 200-period moving average)
mult = input.float(2, minval=0.1, maxval=50, step=0.1, title='Standard Deviation', group="Bollinger Band Parameter", tooltip="Multiplier for the standard deviation to define the upper and lower bands") // Multiplier for the standard deviation to calculate the upper and lower bands

// Timeframe selection for Bollinger Bands
tf = input.timeframe(title="Bollinger Band Timeframe", defval="240", group="Bollinger Band Parameter", tooltip="The timeframe used to calculate the Bollinger Bands (e.g., 4-hour chart)") // Timeframe for calculating the Bollinger Bands (e.g., 4-hour chart)

// Calculate BB for the chosen timeframe using security
[basis, bb_dev] = request.security(syminfo.tickerid, tf, [ta.ema(source, length), mult * ta.stdev(source, length)]) // Calculate Basis (EMA) and standard deviation for the chosen timeframe
upper = basis + bb_dev // Calculate the Upper Band by adding the standard deviation to the Basis
lower = basis - bb_dev // Calculate the Lower Band by subtracting the standard deviation from the Basis

// Plot Bollinger Bands
plot(basis, color=color.red, title="Middle Band (SMA)") // Plot the middle band (Basis, EMA) in red
plot(upper, color=color.blue, title="Upper Band") // Plot the Upper Band in blue
plot(lower, color=color.blue, title="Lower Band") // Plot the Lower Band in blue
fill(plot(upper), plot(lower), color=color.blue, transp=90) // Fill the area between Upper and Lower Bands with blue color at 90% transparency

// Define buy condition based on Bollinger Band 
buy_condition = ta.crossunder(source, lower) // Define the buy condition when the price crosses under the Lower Band (Mean Reversion strategy)

// Execute buy orders on the Bollinger Band Mean Reversion condition
if (buy_condition ) // Check if the buy condition is true and time is within the open and close date range
    strategy.order("DCA Buy", strategy.long, qty=investment_amount / close) // Execute the buy order with the specified investment amount

// Close all positions on the specified date
if (time >= close_date) // Check if the current time is after the close date
    strategy.close_all() // Close all open positions

// Track the background color state
var color bgColor = na // Initialize a variable to store the background color (set to 'na' initially)

// Update background color based on conditions
if close > upper // If the close price is above the Upper Band
    bgColor := color.red // Set the background color to red
else if close < lower // If the close price is below the Lower Band
    bgColor := color.green // Set the background color to green

// Apply the background color
bgcolor(bgColor, transp=90, title="Background Color Based on Bollinger Bands") // Set the background color based on the determined condition with 90% transparency

// Postscript:
// 1. Once you have set the "Investment Amount (USD)" in the input box, proceed with additional configuration. 
// Go to "Properties" and adjust the "Initial Capital" value by calculating it as "Total Closed Trades" multiplied by "Investment Amount (USD)" 
// to ensure the backtest results are aligned correctly with the actual investment values.
//
// Example:
// Investment Amount (USD) = 100 USD
// Total Closed Trades = 10 
// Initial Capital = 10 x 100 = 1,000 USD

// Investment Amount (USD) = 200 USD
// Total Closed Trades = 24 
// Initial Capital = 24 x 200 = 4,800 USD