
Обзор
Стратегия представляет собой передовую количественную торговую систему, которая сочетает в себе движущиеся средние и динамические диапазоны фильтров. Она в основном идентифицирует рыночные тенденции, анализируя связь между изменениями цен и объемом сделок, а также использует диапазоны фильтров, чтобы отфильтровать ложные сигналы и повысить точность торгов.
Стратегический принцип
Основная логика стратегии основана на следующих ключевых расчетах:
- Анализ ликвидности: оценка ликвидности рынка путем расчета соотношения объема сбыта к ценовым изменениям и установление динамических границ ликвидности.
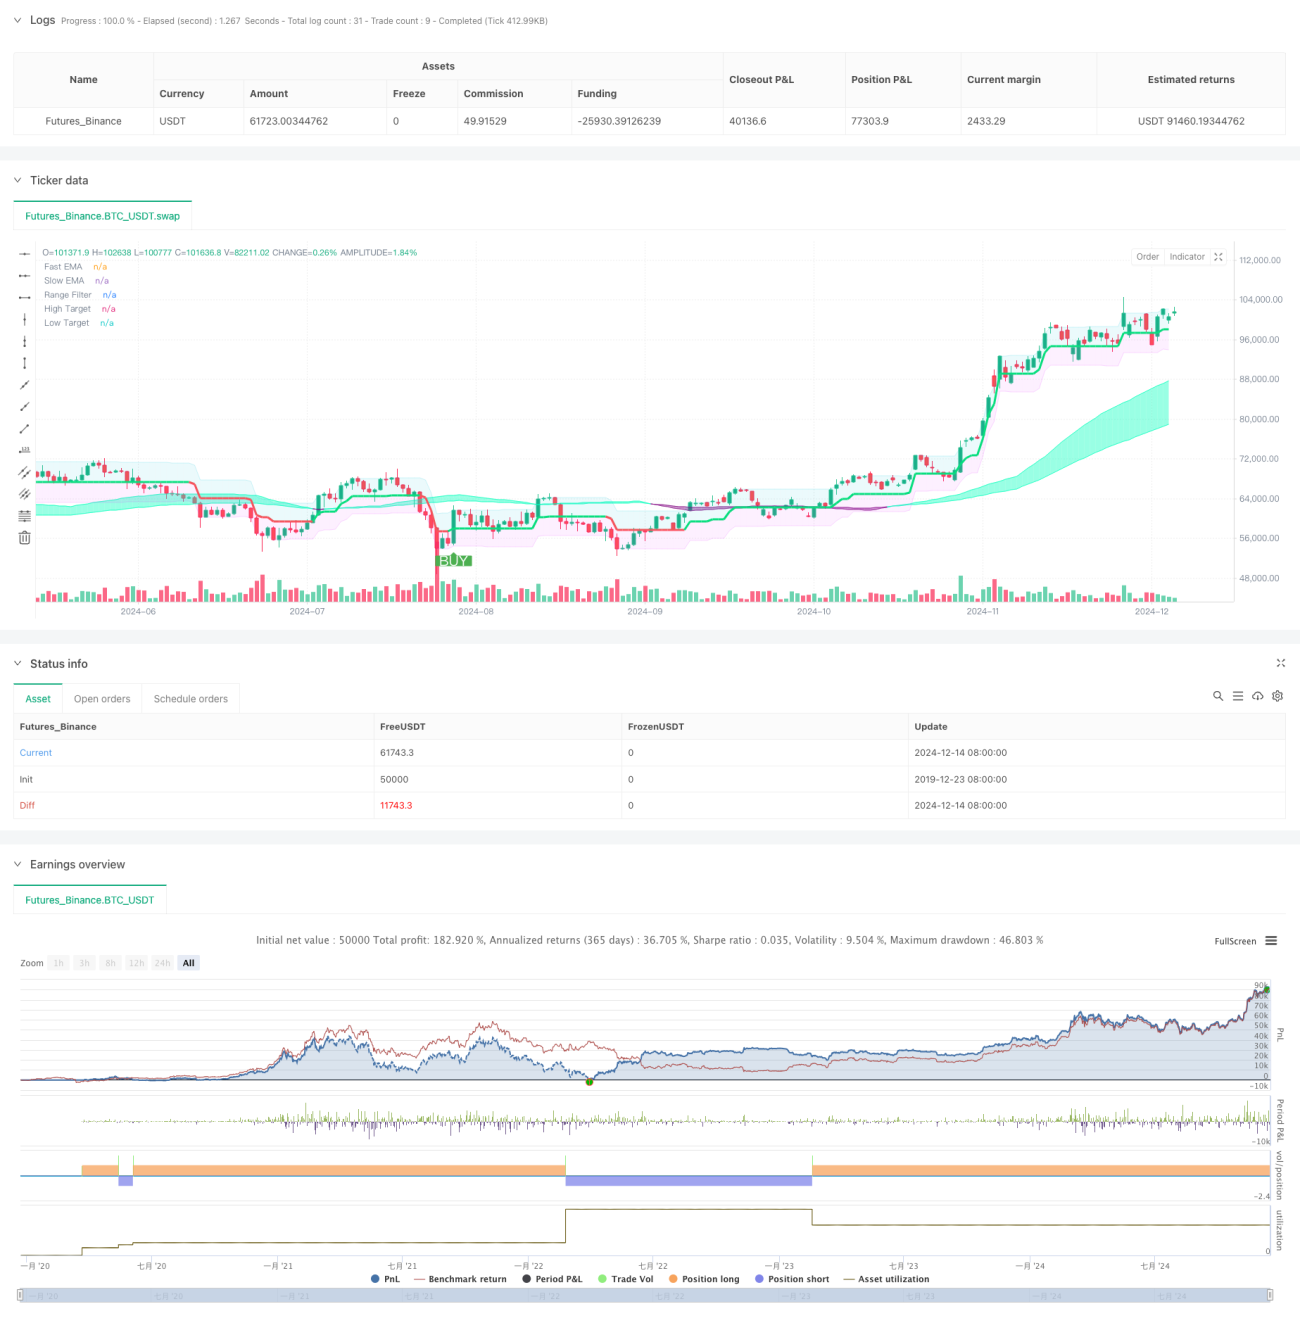
- Подтверждение тренда: Используйте индикаторную скользящую среднюю ((EMA) на 50 и 100 циклов для подтверждения направления тренда.
- Фильтрация диапазона: для построения динамического диапазона сделок используются 50-циклические циклы выборки и 3-кратный разряд диапазона.
- Сигнальное генерирование: генерирование торгового сигнала, когда цена прорывает диапазон фильтра и индикатор EMA показывает согласованную тенденцию
Стратегические преимущества
- Самостоятельная адаптация: стратегия может динамически корректировать параметры в зависимости от рыночных условий и адаптироваться к различным рыночным условиям.
- Надежность сигнала: эффективное снижение ложного сигнала путем объединения нескольких технических показателей и фильтров.
- Управление рисками: автоматический расчет стоп-позиций, позволяющий эффективно контролировать риски.
- Полная функция обратной связи: содержит подробные настройки обратной связи для оптимизации стратегии.
Стратегический риск
- Чувствительность параметров: несколько параметров стратегии требуют тщательной настройки и легко переоптимизируются.
- Влияние скольжения: в условиях высокой волатильности рынка может возникнуть риск скольжения.
- Рыночная адаптивность: частое возникновение ложных сигналов на горизонтальном рынке.
- Управление капиталом: распределение фиксированных средств может не подходить для всех рыночных условий.
Направление оптимизации стратегии
- Параметры адаптируются: может быть введен механизм адаптации параметров, позволяющий автоматически корректировать параметры в соответствии с состоянием рынка.
- Идентификация состояния рынка: добавление модуля оценки состояния рынка, применение различных торговых стратегий в разных рыночных условиях.
- Оптимизация управления капиталом: внедрение динамического управления позициями, корректировка размеров сделок в соответствии с волатильностью рынка.
- Улучшение фильтрации сигналов: можно добавить дополнительные технические показатели для фильтрации фальшивых сигналов.
Подвести итог
Эта стратегия, в сочетании с анализом ликвидности, отслеживанием тенденций и фильтрами диапазона, создает целостную систему количественных торгов. Ее преимущество заключается в том, что она может адаптироваться к изменениям рынка и предоставлять надежные торговые сигналы, но в то же время требует внимания к оптимизации параметров и управлению рисками.
- 1