Количественная стратегия прорыва множественных линий тренда

Обзор стратегии
Эта стратегия является интеллектуальной торговой системой, основанной на многократных прорывах трендовых линий. Она динамически идентифицирует ключевые поддерживающие устойчивые позиции, в сочетании с различными техническими показателями вычисляет наклон трендовых линий и совершает сделки, когда цена прорывает трендовые линии. Эта стратегия не только может улавливать переломные моменты в рыночных тенденциях, но и может оптимизировать параметры для адаптации к различным рыночным условиям.
Стратегический принцип
Центральная логика стратегии состоит из трех основных частей: во-первых, выявление ключевых высоких и низких точек, формирующих первоначальную поддержку и сопротивление, с помощью периода обратного обзора; во-вторых, динамический расчет наклонности трендовых линий в зависимости от выбранного метода расчетов (ATR, стандартная разница или линейная регрессия), позволяя трендовым линиям лучше адаптироваться к рыночным колебаниям; и, наконец, запуск торговых сигналов при появлении прорывов, путем мониторинга отношений цены и трендовых линий. Система также включает механизмы, предотвращающие чрезмерную адаптацию обратного измерения, для моделирования реальной торговой среды с помощью параметров бэкпаинтинга.
Стратегические преимущества
- Адаптируемость: стратегии могут адаптироваться к различным рыночным условиям с помощью различных методов расчета наклонности и регулируемых параметров
- Улучшенный контроль риска: способность динамически корректировать линию тренда помогает своевременно идентифицировать изменения тренда и уменьшить убытки от ложных прорывов
- Хорошая визуализация: стратегия обеспечивает четкую визуальную обратную связь, включая расширение трендовых линий и прорывные маркеры
- Механизм подтверждения сигнала: гарантирует надежность торгового сигнала с помощью многоусловной проверки
Стратегический риск
- При резких рыночных колебаниях могут появляться ложные сигналы
- Задержка в расчете трендовых линий может привести к небольшому задержке входа
- Неправильный выбор параметров может привести к чрезмерной торговле или упущению важных возможностей
- Частые ложные сигналы прорыва могут возникать на рынках с горизонтальной систематизацией
Направление оптимизации стратегии
- Введение показателей по объему перевозок для проверки эффективности прорыва
- Добавление фильтра рыночной волатильности для корректировки параметров во время высокой волатильности
- Интеграция других технических показателей для повышения точности сигналов
- Разработка механизмов адаптивной коррекции параметров
- Интеллектуальные методы для увеличения стоп-лосса и прибыли
Подвести итог
Стратегия, используя в совокупности несколько методов технического анализа, создает надежную систему торговли, которая преодолевает линию тренда. Ее преимущество заключается в том, что она может динамично адаптироваться к изменениям рынка, а также предоставлять четкие торговые сигналы. Хотя существуют некоторые присущие риски, стабильность и рентабельность стратегии могут быть значительно повышены с помощью разумной параметровой настройки и постоянной оптимизации.
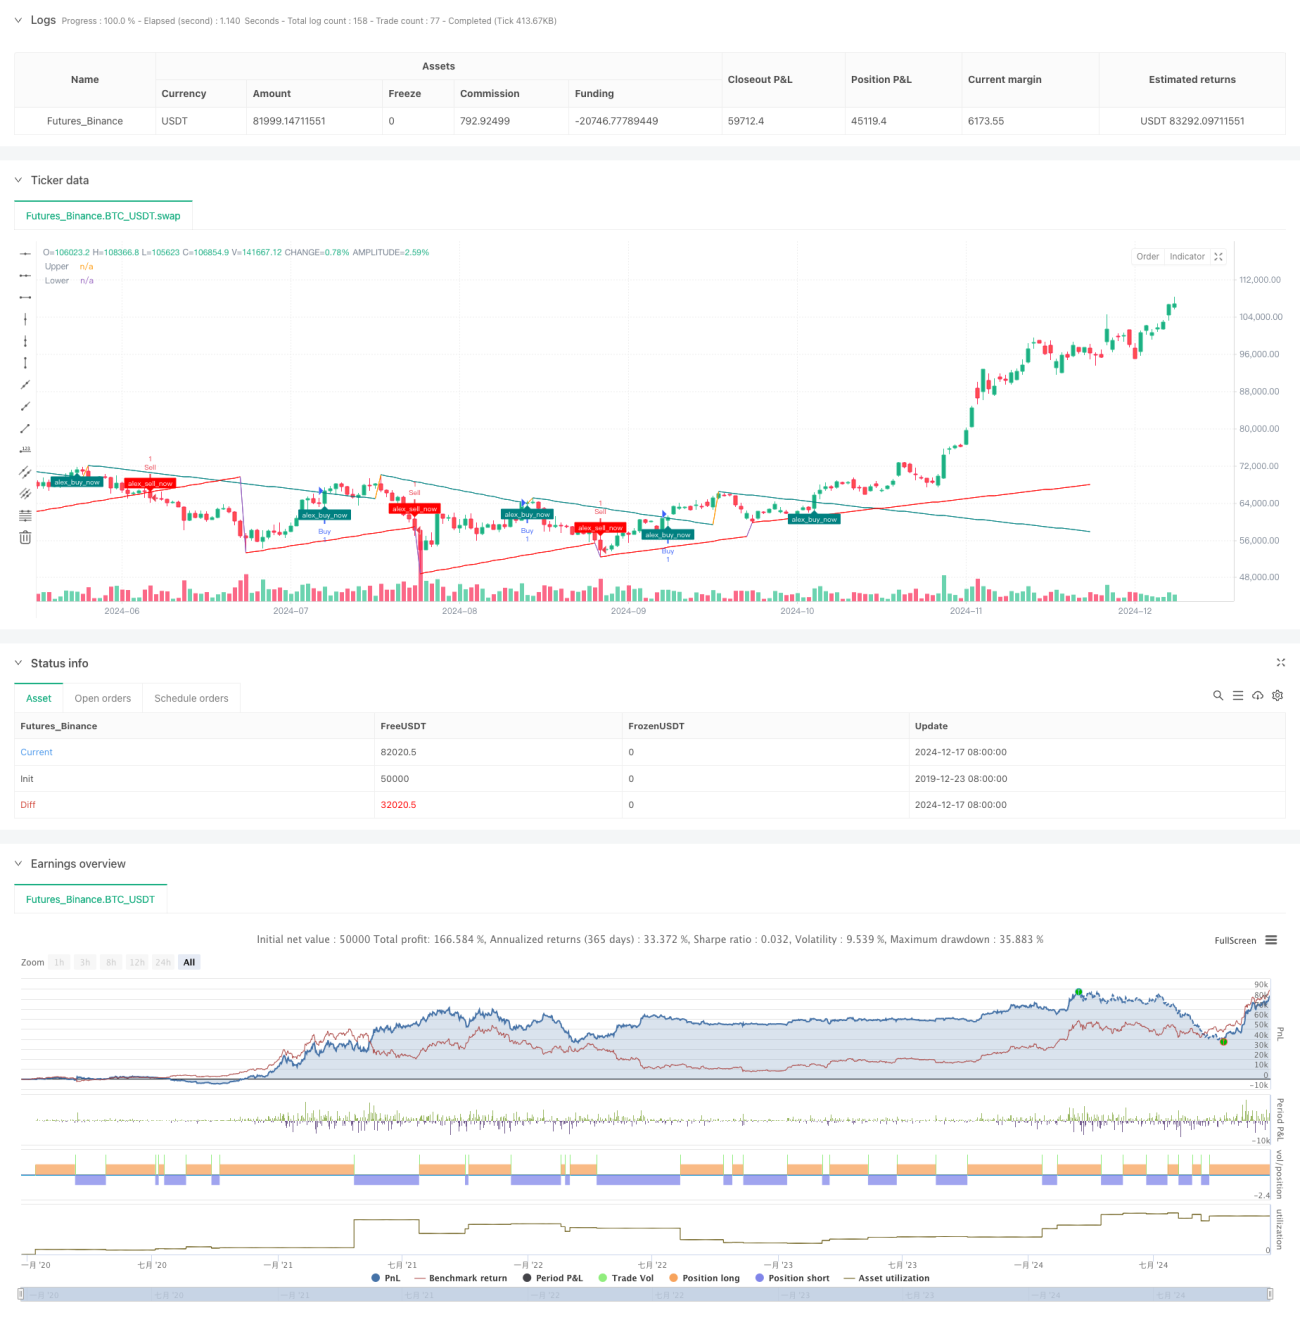
/*backtest
start: 2019-12-23 08:00:00
end: 2024-12-18 08:00:00
period: 1d
basePeriod: 1d
exchanges: [{"eid":"Futures_Binance","currency":"BTC_USDT"}]
*/

// This Pine Script™ code is subject to the terms of the Mozilla Public License 2.0 at https://mozilla.org/MPL/2.0/
// © Alexgoldhunter

//@version=5- 1