Стратегия отслеживания перекрестного тренда с несколькими техническими индикаторами: совместная торговая система RSI и стохастического RSI

Обзор
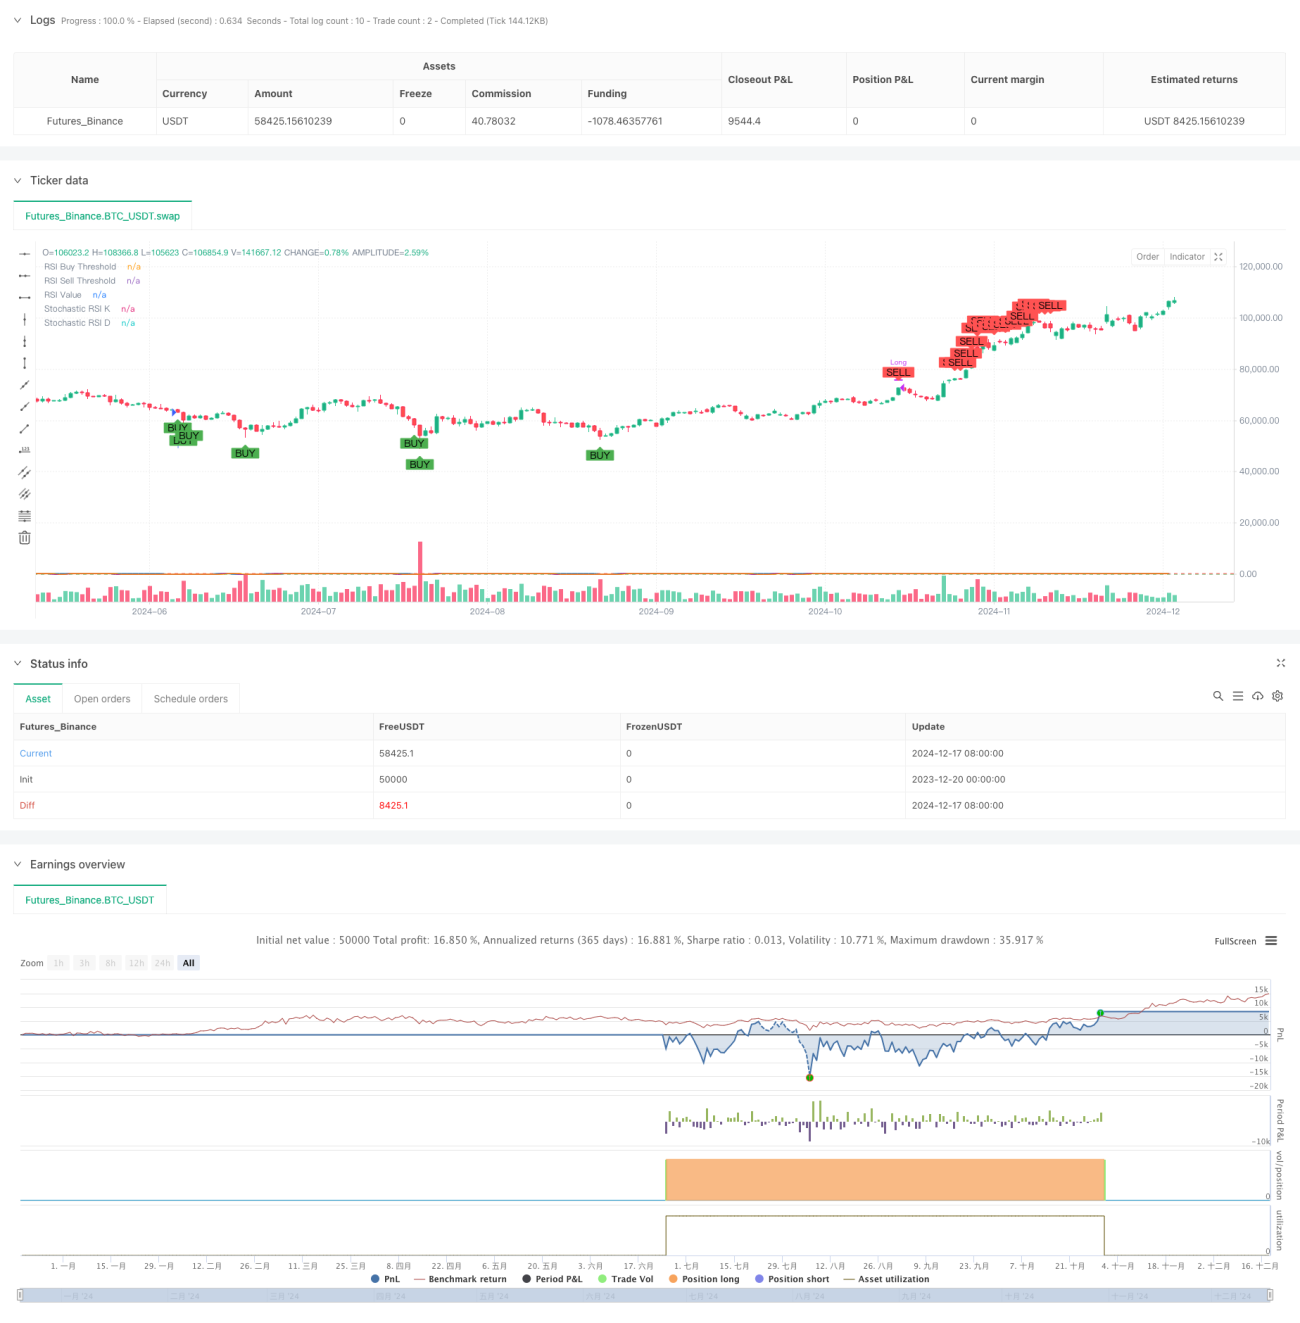
Стратегия является системой торговли, которая отслеживает тенденции, основанные на относительно сильных и слабых показателях (RSI) и случайных относительно сильных показателей (Стохастический RSI). Стратегия осуществляет торговлю, когда на рынке появляются сигналы о перекупке или перепродаже, путем мониторинга уровня RSI и Stochastic RSI.
Стратегический принцип
Стратегия основана на двух технических показателях: RSI и Stochastic RSI. RSI используется для измерения скорости и величины изменения цен, а Stochastic RSI, используя случайные показатели для расчета значения RSI, предоставляет более чувствительный сигнал о перекупе и перепродаже.
Стратегические преимущества
- Двойной механизм подтверждения: снижает влияние ложных сигналов путем объединения RSI и Stochastic RSI.
- Гибкий временной цикл: поддержка работы на дневном и круговом временных периодах, адаптация к различным стилям торговли.
- Настройка параметров: трейдер может корректировать параметры RSI и Stochastic RSI в зависимости от ситуации на рынке.
- Хорошая визуализация: стратегия обеспечивает четкое визуальное отображение маркеров сигналов покупки и продажи и линий показателей.
- Сильная системность: четкая логика стратегии, четкие правила входа и выхода.
Стратегический риск
- Риск рыночных потрясений: частое появление торговых сигналов на рынках с горизонтальными колебаниями может привести к увеличению стоимости торгов.
- Риск обратного тренда: в условиях сильного тренда стратегия может быть скорректирована из-за сигнала перепродажи из-за перекупа, что приводит к пропусканию большого рынка.
- Чувствительность параметров: различные параметры могут привести к значительно различным результатам сделки.
- Риск отставания: технические показатели, по своей сути, отстают, что может привести к небольшим задержкам во время входа и выхода.
Направление оптимизации стратегии
- Введение фильтра тренда: можно добавить индикаторы тренда, такие как движущиеся средние, и выполнять торговые сигналы только тогда, когда тренд ясен.
- Оптимизация параметров: разработка механизмов динамического регулирования параметров, позволяющих автоматически корректировать параметры в соответствии с волатильностью рынка.
- Увеличение механизма остановки убытков: установка условий остановки на основе ATR или фиксированного процента, контроль риска.
- Добавление подтверждения загрузки: объединение загрузки в качестве индикатора повышает надежность сигнала.
- Разработка рейтинга силы сигнала: создание системы рейтинга силы сигнала, при которой размер позиции может быть изменен в зависимости от силы сигнала.
Подвести итог
Стратегия создает относительно надежную торговую систему, объединяя преимущества RSI и Stochastic RSI. Несмотря на определенные ограничения, стратегия имеет хорошую практическую ценность с разумным управлением риском и постоянной оптимизацией.
- 1