Стратегия торговли на развороте тренда RSI, основанная на стоп-лоссах ATR и контроле торгового диапазона

Обзор
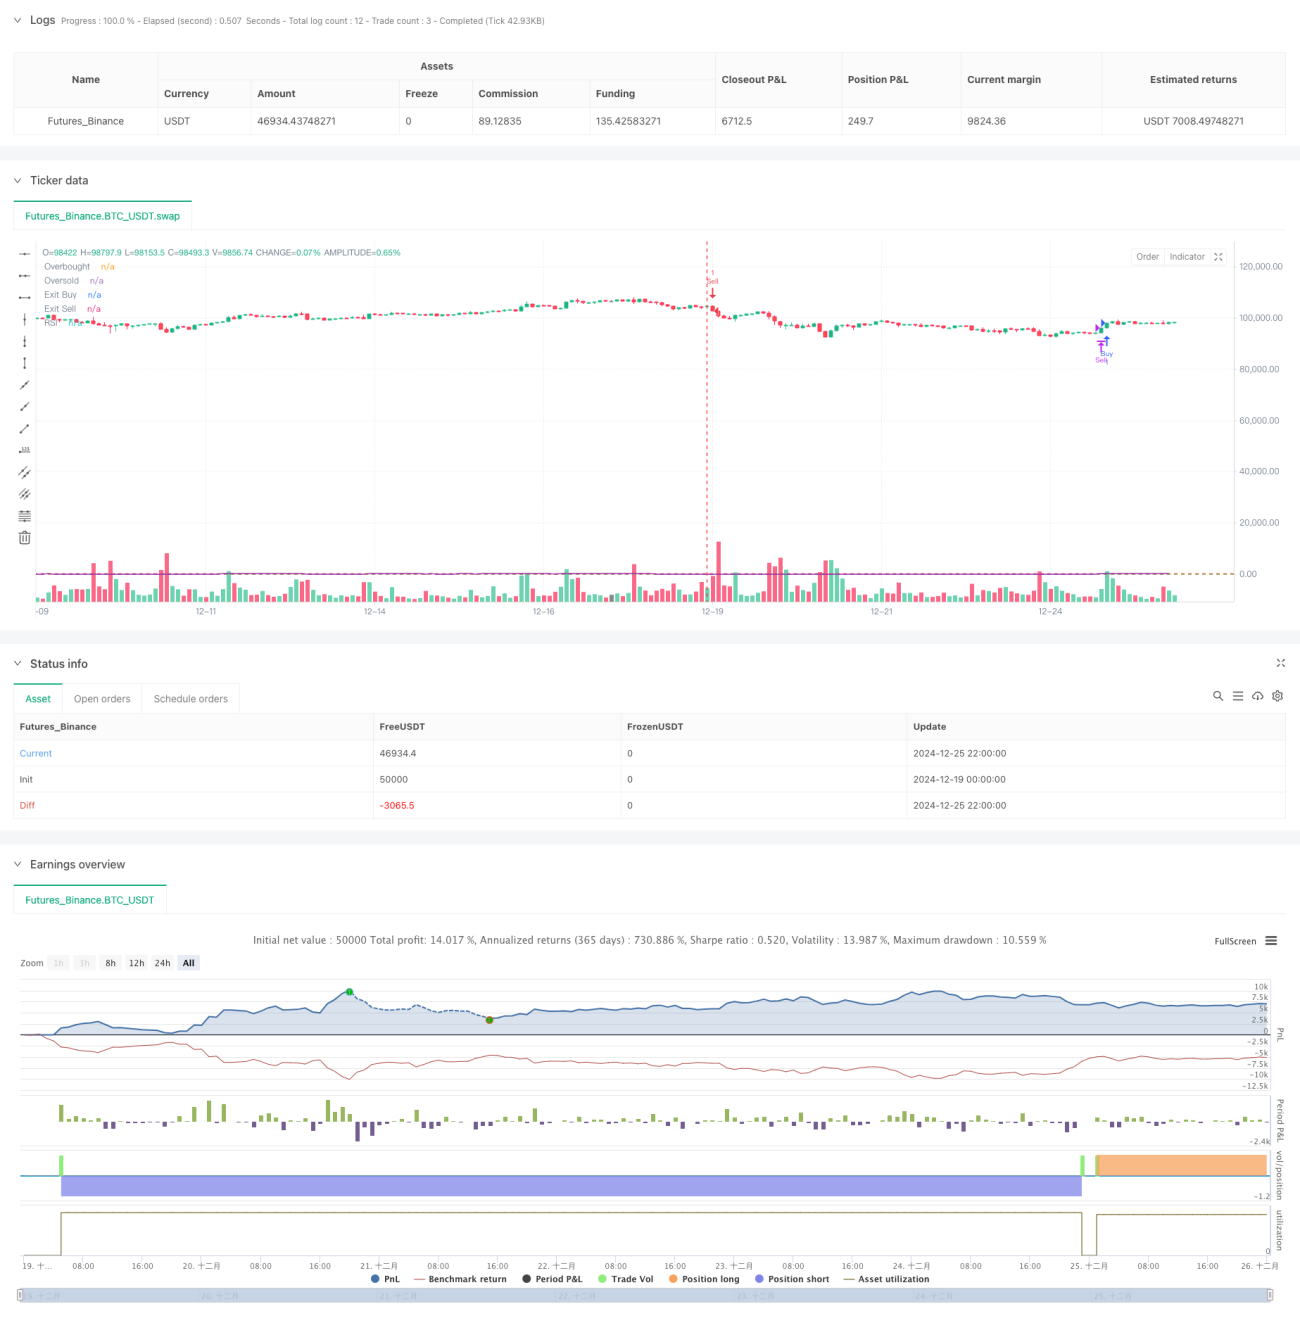
Эта стратегия представляет собой систему торговли на развороте тренда, основанную на индексе относительной силы (RSI). Она фиксирует поворотные моменты рынка, устанавливая диапазоны перекупленности и перепроданности, и сочетает динамический стоп-лосс ATR для контроля риска. Уникальность стратегии заключается во введении понятия «запрещенного торгового диапазона», что позволяет эффективно избегать частой торговли на волатильном рынке. Эта стратегия подходит для рыночных сред с повышенной волатильностью, особенно для торговли продуктами с явно выраженными трендовыми характеристиками.
Стратегический принцип
Стратегия в основном реализуется на основе следующей базовой логики:
- Использование 14-периодного индикатора RSI для определения состояний перекупленности и перепроданности рынка
- Когда RSI пробивает уровень 60 и цена закрытия оказывается выше предыдущего максимума, срабатывает длинный сигнал.
- Когда RSI падает ниже уровня 40, а цена закрытия ниже предыдущего минимума, срабатывает сигнал на короткую позицию.
- Когда RSI находится в диапазоне 45–55, он устанавливается как запрещенная торговая зона, чтобы предотвратить частую торговлю во время фазы консолидации.
- Установите динамический стоп-лосс на основе 1,5-кратного ATR для обеспечения механизма контроля риска
- Закрывайте длинные и короткие позиции, когда RSI ниже 45 и выше 55 соответственно.
Стратегические преимущества
- Сочетание характеристик разворота тренда и импульса для принятия торговых решений
- Эффективно избегайте ложных сигналов на нестабильных рынках, запрещая торговые диапазоны
- Принять динамический стоп-лосс ATR и адаптивно корректировать позицию стоп-лосса в соответствии с волатильностью рынка
- Четкие условия входа и выхода, чтобы избежать субъективных суждений
- Логика стратегии проста и понятна, ее легко понять и поддерживать.
- Иметь хороший механизм контроля рисков
Стратегический риск
- Могут быть пропущены некоторые движения на быстро меняющихся рынках
- Индикатор RSI имеет задержку, что может привести к небольшой задержке во времени входа.
- Запрет на торговые диапазоны может привести к упущению некоторых важных торговых возможностей.
- Стоп-лосс ATR может привести к тому, что стоп-лосс будет слишком широким в периоды волатильности.
- Необходимо установить разумные параметры для адаптации к различным рыночным условиям.
Направление оптимизации стратегии
- Внедрение многопериодных сигналов подтверждения RSI для повышения надежности транзакций
- Добавить индикаторы объема в качестве вспомогательных условий суждения
- Оптимизировать механизм динамической корректировки запрещенного торгового диапазона
- Рассмотрите возможность добавления функции скрининга тенденций для корректировки параметров стратегии в условиях сильных тенденций.
- Разработать адаптивные механизмы оптимизации параметров для улучшения адаптивности стратегии
- Добавить механизм получения прибыли для повышения эффективности использования капитала
Подвести итог
Эта стратегия решает проблему выбора времени в трендовой торговле посредством инновационного сочетания сигналов разворота RSI и запрещенных торговых диапазонов. Внедрение динамического стоп-лосса ATR обеспечивает надежный механизм контроля рисков для стратегии. Хотя стратегия все еще несет в себе некоторые потенциальные риски, ее стабильность и прибыльность можно дополнительно повысить за счет рекомендуемых направлений оптимизации. В целом, это торговая стратегия разворота тренда с четкой логикой и большой практичностью.
- 1