
Обзор
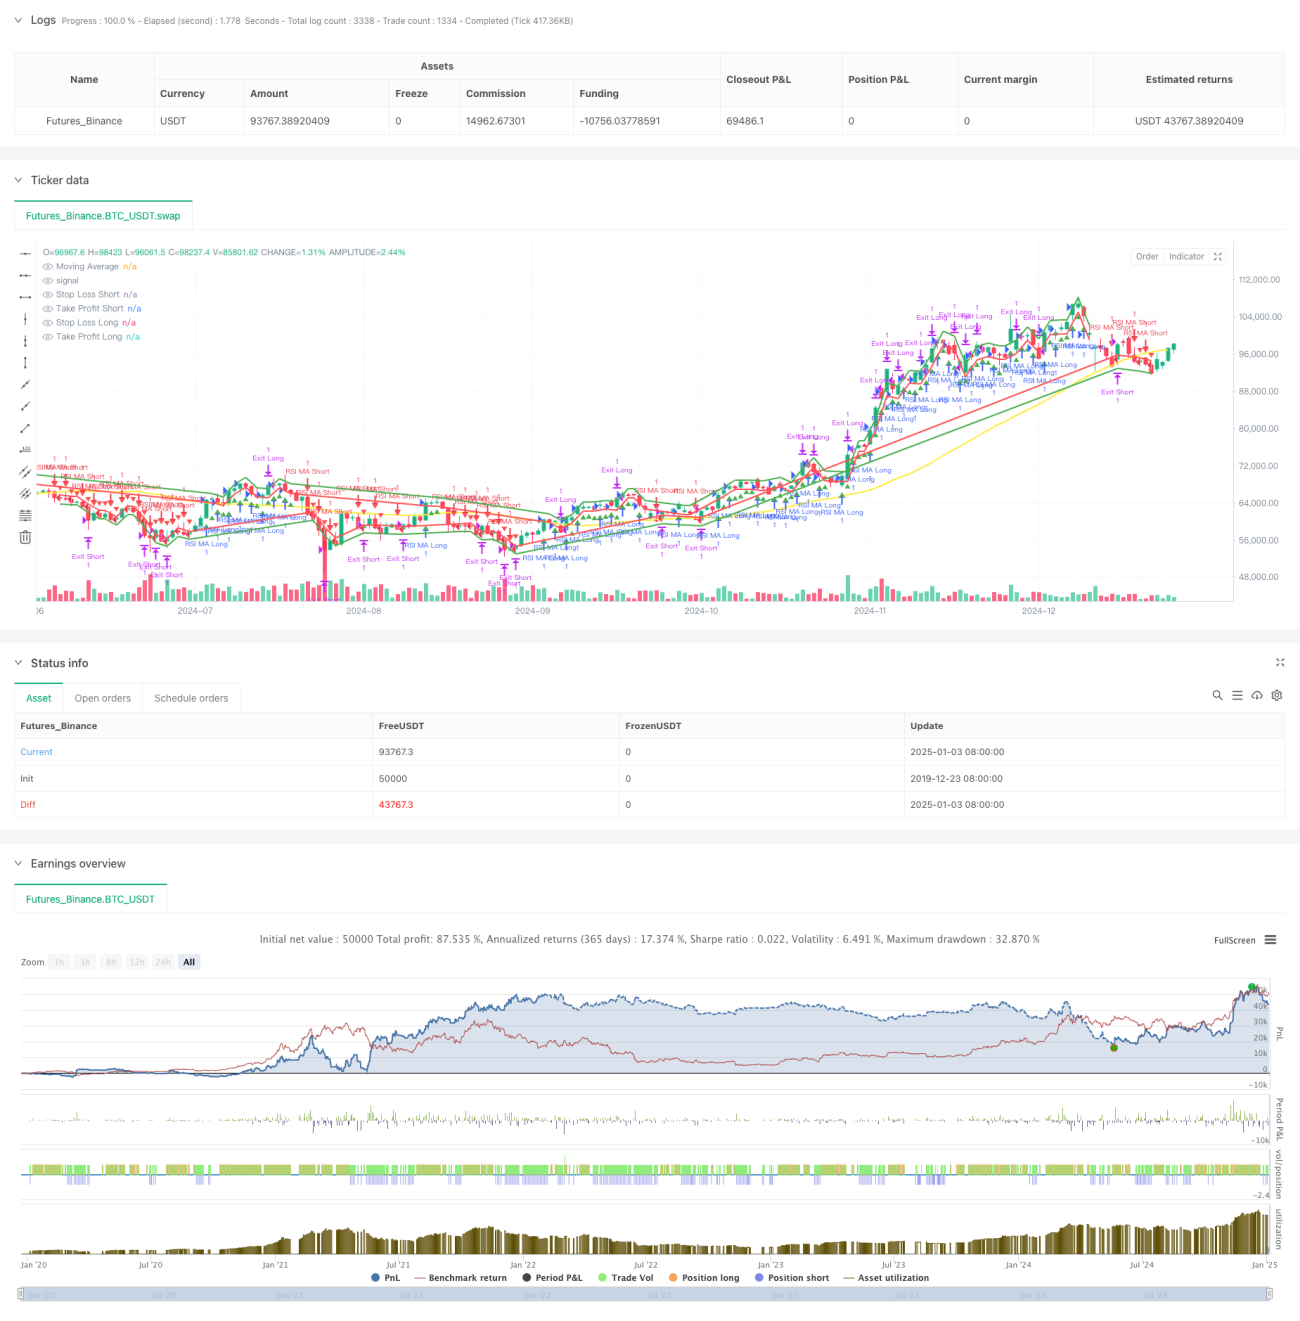
Эта стратегия представляет собой торговую систему, основанную на тренде, которая объединяет индекс относительной силы (RSI) и простую скользящую среднюю (SMA). Эта стратегия использует скользящую среднюю для определения направления рыночного тренда и индикатор RSI для подтверждения импульса, чтобы торговать, когда тренд и импульс совпадают. Стратегия разработала полноценный механизм стоп-профита и стоп-лосса, который позволяет эффективно контролировать риски.
Стратегический принцип
Основная логика стратегии основана на комбинированном использовании двух технических индикаторов:
- Скользящая средняя (MA): используется для определения общей тенденции. Когда цена находится выше скользящей средней, это считается восходящим трендом, в противном случае — нисходящим.
- Индекс относительной силы (RSI): используется для подтверждения ценовой динамики. Когда RSI выше установленного порогового значения (например, 55), это подтверждает восходящий импульс, а когда он ниже порогового значения (например, 45), это подтверждает нисходящий импульс.
Логика генерации торгового сигнала:
- Условия длинной позиции: цена выше МА, а RSI больше порога покупки
- Условия короткой продажи: цена ниже МА и RSI ниже порога продажи
Контроль рисков использует методы процентного стоп-лосса и тейк-профита, которые устанавливаются как фиксированные проценты от цены входа соответственно.
Стратегические преимущества
- Стабильность сигнала: Объединяя двойное подтверждение тренда и импульса, можно эффективно сократить количество ложных сигналов.
- Идеальное управление рисками: фиксированные процентные стоп-лосс и тейк-профит устанавливаются для эффективного контроля риска каждой сделки.
- Гибкость параметров: ключевые параметры, такие как период MA, порог RSI и т. д., можно оптимизировать в соответствии с различными характеристиками рынка.
- Логика стратегии ясна: правила торговли просты и интуитивно понятны, их легко понять и выполнить.
- Высокая адаптивность: может применяться к транзакциям в различные периоды времени.
Стратегический риск
- Риск разворота тренда: в точках разворота тренда могут возникать непрерывные стоп-лоссы.
- Риск волатильности рынка: частая торговля может привести к убыткам в условиях ограниченного диапазона рынка.
- Зависимость от параметров: Оптимальные параметры могут существенно различаться в различных рыночных условиях.
- Риск проскальзывания: вы можете столкнуться с большим проскальзыванием, когда рынок резко колеблется.
- Задержка технического индикатора: как MA, так и RSI имеют определенную задержку, что может привести к задержке входа.
Направление оптимизации стратегии
- Оптимизация динамических параметров: внедрение механизма адаптивных параметров для динамической настройки периода MA и порогового значения RSI в соответствии с волатильностью рынка.
- Фильтрация рыночной среды: добавьте механизм фильтрации волатильности для корректировки позиций или приостановки торговли в условиях высокой волатильности.
- Анализ за несколько временных периодов: внедрение подтверждения долгосрочных трендов для повышения точности определения направления торговли.
- Оптимизация стоп-лосса: внедрение механизма скользящего стоп-лосса для лучшей защиты прибыли.
- Фильтрация сигналов: добавьте вспомогательные индикаторы, такие как объем торгов, чтобы повысить надежность сигналов.
Подвести итог
Эта стратегия объединяет индикаторы тренда и импульса для создания торговой системы с четкой логикой и контролируемыми рисками. Несмотря на некоторые неотъемлемые риски, стратегия демонстрирует хорошую практичность благодаря разумному заданию параметров и контролю рисков. Последующие направления оптимизации будут в основном сосредоточены на динамической настройке параметров, идентификации рыночной среды и улучшении качества сигнала, что, как ожидается, еще больше повысит стабильность и прибыльность стратегии.
- 1