
Обзор
Это трёхмерная стратегия отслеживания трендов средней линии, основанная на методологии торговли Оливера Валеса. Стратегия использует перекрестные сигналы 20-циклической, 50-циклической и 200-циклической скользящих средних для выявления рыночных тенденций и торговых возможностей. 200-циклическая средняя линия служит основным фильтром трендов, а перекрестные линии 20-циклической и 50-циклической средней линии используются для генерации конкретных торговых сигналов.
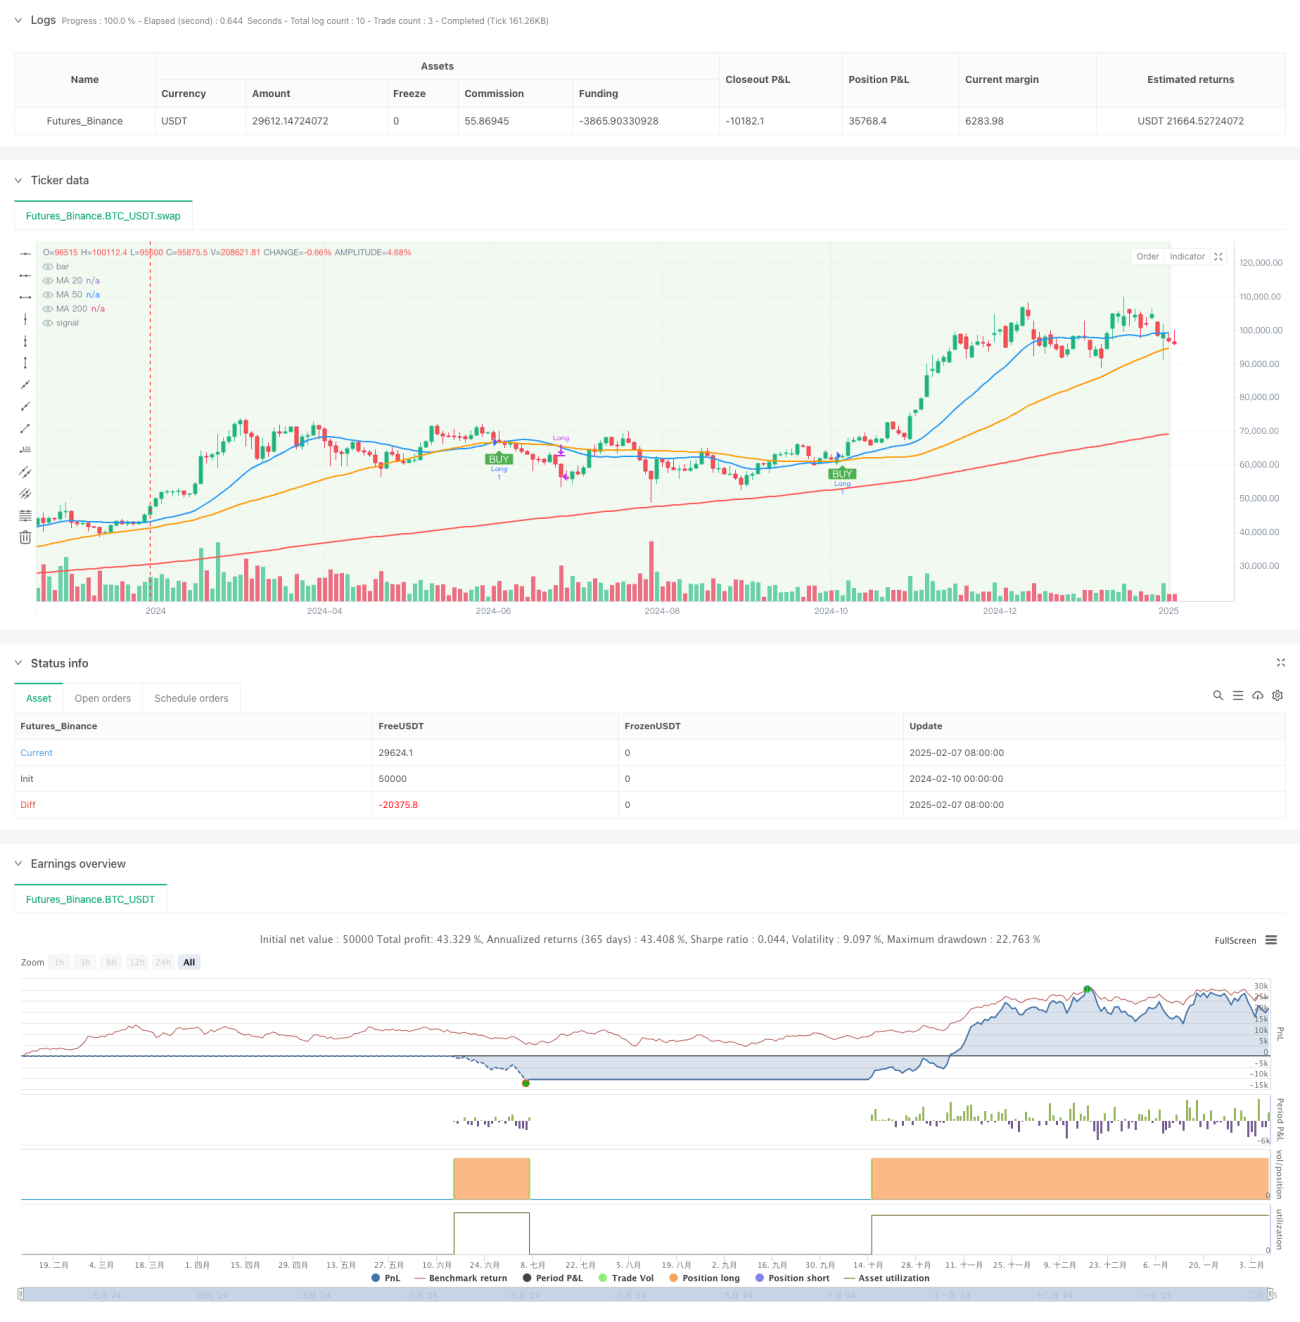
Стратегический принцип
Основная логика стратегии состоит из трех ключевых уровней:
- Идентификация тренда: использование 200 циклических средних линий в качестве разграничительной линии тренда. Когда цена находится выше 200 средних линий, считается восходящей тенденцией; когда цена находится ниже 200 средних линий, считается нисходящей тенденцией.
- Торговый сигнал: в восходящем тренде, когда 20-циклическая средняя линия вверх пересекает 50-циклическую среднюю линию, вызывает многосигнал; в нисходящем тренде, когда 20-циклическая средняя линия вниз пересекает 50-циклическую среднюю линию, вызывает пустой сигнал.
- Контроль риска: стратегия устанавливает по умолчанию 2% стоп-лосс и 4% стоп-стоп, при этом автоматически ликвидирует позиции при появлении обратного крестового сигнала.
Стратегические преимущества
- Механизм многократного подтверждения: обеспечивает более надежный торговый сигнал с помощью использования трех равнозначных линий.
- Тренд фильтрация: 200 равномерных тренд фильтрация эффективно снижает риск ложных прорывов.
- Гибкость: поддержка переключения между SMA и EMA, возможность корректировки параметров в зависимости от различных рыночных особенностей.
- Управление рисками: встроенные механизмы сдерживания убытков, защита средств.
- Визуализация: интуитивное отображение состояния тренда с помощью изменения цвета фона.
Стратегический риск
- Отсталость: движущийся средний по своей сути является отсталым показателем, что может привести к незначительной задержке входа или выхода из игры.
- Не применяется для рынка колебаний: в фазе горизонтальной сборки частое пересечение равномерных линий может создавать ложные сигналы.
- Риск фиксированного стоп-лора: использование фиксированного стоп-лора может не подходить для всех рыночных условий.
- Чувствительность параметров: различные среднелинейные циклические настройки могут привести к значительно различным результатам.
Направление оптимизации стратегии
- Введение анализа трафика: можно добавить индикатор подтверждения трафика, повышая надежность сигнала.
- Динамическая установка стоп-убытков: рассмотреть возможность использования ATR или индикатора волатильности для динамического регулирования стоп-убытков.
- Добавление фильтра силы тренда: можно вводить индикаторы силы тренда, такие как ADX, фильтрации слабых тенденций.
- Оптимизация времени входа: в сочетании с ценовой формой и поддержкой сопротивления, повышается точность входа.
- Добавлена временная фильтрация: можно установить окно времени торговли, чтобы избежать наиболее волатильных периодов.
Подвести итог
Это полностью структурированная, логически ясная стратегия отслеживания трендов. Благодаря совместной работе с тремя равномерными линиями, она гарантирует точность идентификации трендов и предоставляет четкие торговые сигналы. Механизм управления рисками стратегии относительно совершенен, но все еще есть место для оптимизации.
- 1